

Abstract
Objective
To determine whether the reference range for parathyroid hormone (PTH) should be lowered (from 65 pg/mL to a proposed value of 46 pg/mL) with use of the Allegro radioimmunometric assay.
Methods
We examined the reference range for PTH, adjusted for serum 25-hydroxyvitamin D (25-OHD), in 503 healthy African American and white women, who were 20 to 80 years old. We also analyzed other factors that are thought to influence PTH levels.
Results
Univariate predictors of PTH were identified, and a multivariate model was developed with use of the variables and PTH. Serum PTH was significantly higher in black study subjects than in white study subjects (P<0.02). Increasing PTH was also significantly correlated with increasing body mass index, age, and serum creatinine and with decreasing dietary calcium intake and serum 25-OHD levels. A stepwise multiple linear regression analysis yielded the following predictors of PTH: body mass index (R2 = 9.4%), age (R2 = 1.0%), and serum 25-OHD (R2 = 0.8%). In our study population, many PTH values were above the proposed new upper limit of 46 pg/mL.
Conclusion
The upper limit of the reference range for serum PTH should not be changed. Factors to be considered in analysis of serum PTH values in the upper reference range in patients with normocalcemia include obesity, race, 25-OHD levels, advanced age, serum creatinine, and dietary calcium intake.
Abbreviations: BMD = bone mineral density, BMI = body mass index, CV = coefficient of variation, 25-OHD = 25-hydroxy-vitamin D, PTH = parathyroid hormone
INTRODUCTION AND BACKGROUND
The earliest radioimmunoassay for parathyroid hormone (PTH) used polyclonal antisera directed against intact PTH(1-84) (1). Most early assays were directed against the middle or C-terminus of the PTH peptide (2). Investigators soon found that several fragments of PTH in serum were derived from the parathyroid glands and from peripheral metabolism of PTH(1-84) (3–11). The later development of a 2-site radioimmunometric assay allowed measurement of primarily intact PTH(1-84) (12–19). This assay uses 2 antibodies directed toward different regions of the peptide. The antibody directed toward the C-terminus is bound to a solid support. The nonbinding PTH fragments are washed away, and a second antibody, directed at the N-terminus, is used. This 2-site radioimmunometric assay improved detection of intact PTH and decreased detection of PTH peptides that did not have both N- and C-terminus antigenic regions. The assay had a low detection limit, facilitating the diagnosis of hypoparathyroidism, and separated hyperparathyroidism from hypercalcemia of malignancy. It did not detect even a high concentration of inactive C-terminus fragments. The assay technique was accepted throughout the world (20).
During the past decade, however, studies showed that vitamin D insufficiency severe enough to increase serum PTH levels was present in many people (21–24). Because vitamin D is in large part derived from sunlight, low levels of serum 25-hydroxyvitamin D (25-OHD) are found particularly in dark-skinned persons, in the winter, in those living in northern latitudes, or in those with decreased exposure to sunlight because of clothing coverage or use of sunblock preparations. The high prevalence of hypovitaminosis D suggested that the “normal” populations used to determine the reference range for PTH could have included a large number of subjects with vitamin D insufficiency and secondary hyperparathyroidism, resulting in an elevated PTH reference range.
Souberbielle et al (25), using a common immunoradiometric assay (Allegro intact PTH, Nichols Institute, San Juan Capistrano, CA), found that exclusion of subjects with low 25-OHD levels had a significant effect on the upper limits of the PTH reference range. They found that when 25-OHD levels were considered, the upper limits of “normal” of PTH declined from 65 pg/mL to 46 pg/mL in subjects with 25-OHD levels above 30 nmol/L, a change that would have clinical ramifications. Subsequently, these investigators validated their proposal of 46 pg/mL as the upper limit of the reference range of PTH by a review of medical records in patients with osteopenia (26). In an editorial accompanying their publication, however, their conclusions were questioned (27). It was pointed out that their patients had either osteopenia or osteoporosis, rather than being “normal.” In addition, the authors used an in-house assay for 25-OHD that yields values 40% lower than those from commercial assays. The editorial called for rigorous establishment of the normal range for PTH in subjects who are both vitamin D sufficient and without metabolic bone disease. Because PTH levels increase with advancing age, it was also suggested that normal values should be determined in subjects of all ages rather than simply the age-group with a mean of 59 ± 13 years included in the study by Souberbielle et al (25).
In a previously published study of skeletal physiology in healthy black and white women who were 20 to 80 years of age, we measured serum 25-OHD levels and PTH levels (28). In this report, we analyze those data to answer the following questions: (1) What are the factors, including serum 25-OHD, that influence serum PTH levels? and (2) Should the reference range of serum PTH be lowered?
MATERIAL AND METHODS
Study Participants
Participants were recruited from advertising in the local media and through a direct mail campaign. Exclusion characteristics consisted of any chronic illness, including hypertension, diabetes, or morbid obesity, any past history of illness or use of medication known to affect bone metabolism, any use of oral contraceptives or hormone replacement therapy, or a history of hysterectomy. After telephone screening, women were further excluded from the study because of abnormal results of blood chemistry studies (multichannel chemistries, complete blood cell count, urinalysis, free thyroxine, thyroid-stimulating hormone) or abnormal physical findings. The study was approved by the Institutional Review Board of Winthrop University Hospital, and written informed consent was obtained from each participant. A detailed history and physical questionnaire for risk factors was completed by each study participant, with the assistance of a nurse clinical research coordinator and physician. A 3-day diet history was obtained and was reviewed with the study dietitian, who used food models to estimate portion sizes.
The most common causes for exclusion from the study were undiagnosed diabetes, thyroid disease, and anemia. The study group consisted of 148 black and 129 white premenopausal participants and 87 black and 139 white postmenopausal subjects.
Laboratory Studies
Initial screening of the study participants demonstrated normal findings on physical examination and routine laboratory studies, including serum calcium, phosphorus, and alkaline phosphatase. Serum PTH was measured by the Allegro intact PTH immunoassay, purchased from Nichols Institute. The intra-assay coefficient of variation (CV) was 5.2%, and the interassay CV was 9.0%. Serum 25-OHD was measured by a radioreceptor assay purchased from Incstar. The intra-assay CV was 4.1%, and the interassay CV was 7.0%. This assay is now manufactured by DiaSorin (Stillwater, MN).
Bone Mineral Density
For each participant, we obtained individual scans of the proximal femur, radius, and lumbar spine (L2 through L4), using a Lunar Radiation densitometer (Lunar Radiation, Madison, WI, model DPX-L, software program 1.3Y). The scan was run at medium speed. In addition, the bone mineral density (BMD) of the radius was measured on a Hologic densitometer (Hologic, Waltham, MA). The CV of each site measured was 1% to 1.5%.
Statistical Analysis
Values for continuous variables are reported as means ± SD. Because of skewness (that is, the lognormal nature) of PTH and other serum values, we assessed the correlation of continuous predictors of PTH with the nonparametric (Spearman) correlation. Differences between ethnic groups for PTH were analyzed by the nonparametric rank sum test. Stepwise multiple linear regression was used to determine the best independent predictors of PTH; P<0.05 was the cutoff value. Because PTH was not normally distributed, we used a nonparametric approach for reference intervals (that is, selecting 2.5 and 97.5 percentiles), instead of the mean ± 2 SD. All calculations were performed with use of SAS (Version 8.2) for Windows. Results were considered statistically significant when P values were <0.05.
Metabolic bone disease was considered present if the Z-score was below −2.0 for either the lumbar spine or the femoral neck. Z-scores for each patient were calculated by computing the number of standard deviations below an age-matched BMD. Formulas for age-matched BMD were provided by GE Medical Systems (Lunar, Madison, WI).
Statistical methods have been developed for formal consideration of whether reference ranges should be partitioned (29). A stringent approach is to calculate the difference between the 2 subgroup means and divide it by the length of the reference range of the combined single group (30). If the ratio exceeds 25%, partitioning should be considered. A “middle-of-the-road” approach uses about 10% rather than 25% as the threshold ratio (31,32). This is the approach recommended by the National Committee for Clinical Laboratory Standards, now called the Clinical and Laboratory Standards Institutes. We analyzed our data with use of both methods for race, menopausal status, race-menopausal status, body mass index (BMI), and 25-OHD dichotomized by using various cutoff values from >30 nmol/L versus ≤30 nmol/L to >80 nmol/L versus ≤80 nmol/L, in increments of 10 nmol/L.
RESULTS
Predictors of PTH—Univariate and Multivariate Analysis
In Table 1, we provide descriptive statistics of all continuous variables and the univariate correlations with PTH. Mean PTH was significantly higher in black study subjects (38.9 ± 14.0 pg/mL) than in white study subjects (35.8 ± 12.6 pg/mL) (P<0.02). Increasing PTH was also significantly correlated with increasing BMI (Fig. 1), increasing age (Fig. 2), decreasing dietary calcium, increasing serum creatinine, and decreasing 25-OHD (Fig. 3). The largest correlation was between PTH and BMI (r = 0.29; P<0.0001).
Table 1.
Variables and Their Spearman Correlation With Serum Parathyroid Hormone*
| Variable | No. of patients† | Mean | Median | SD | SpearmanR | Pvalue‡ |
|---|---|---|---|---|---|---|
| Parathyroid hormone (pg/mL) | 497 | 37.3 | 35.5 | 13.4 | … | … |
| Age (yr) | 503 | 47.8 | 48.0 | 14.6 | 0.16 | 0.0005 |
| Dietary calcium (mg/day) | 464 | 659.0 | 598.0 | 307.8 | −0.12 | 0.0135 |
| Serum creatinine (mg/dL) | 498 | 0.94 | 0.93 | 0.11 | 0.11 | 0.0128 |
| Height (cm) | 503 | 163.9 | 163.0 | 6.3 | 0.02 | 0.6972 |
| Body mass index (kg/m2) | 503 | 25.0 | 24.7 | 3.9 | 0.29 | <0.0001 |
| 25-OHD (nmol/L) | 492 | 51.5 | 44.9 | 33.8 | −0.14 | 0.0024 |
25-OHD = 25-hydroxyvitamin D.
Number for whom data were compiled for each specific variable.
Significance of the correlation.
Fig. 1.
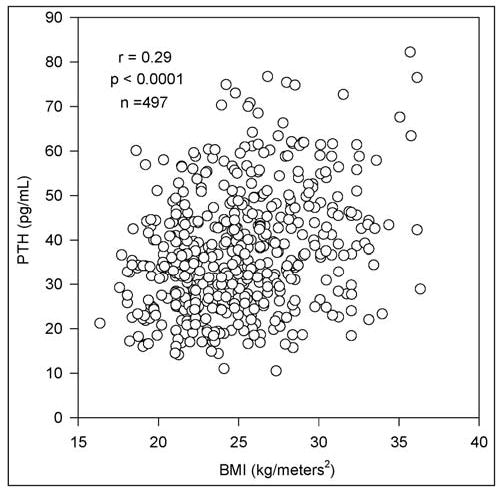
Direct correlation of parathyroid hormone (PTH) and body mass index (BMI) in 497 study subjects.
Fig. 2.
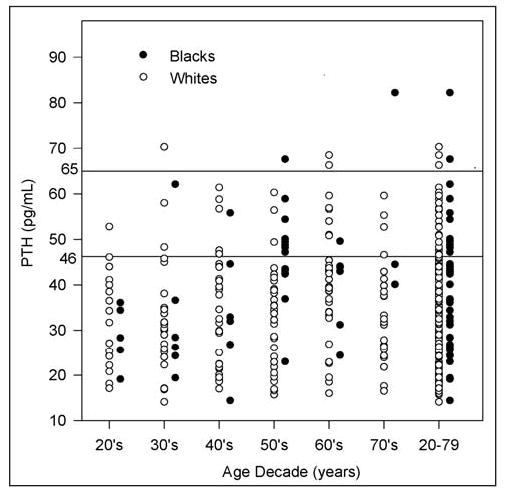
Parathyroid hormone (PTH) levels for each decade of life from the 20s through the 70s and for the inclusive ages 20 through 79 years. The current upper limit of the reference range for PTH (65 pg/mL) has an expected number of outliers. Use of 46 pg/mL as the upper limit of the reference range would result in a large number of subjects with hyperparathyroidism.
Fig. 3.
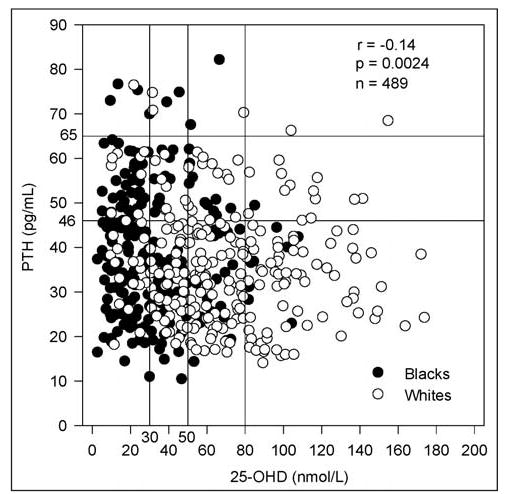
Inverse relationship between parathyroid hormone (PTH) and serum 25-hydroxyvitamin D (25-OHD).
All significant correlations and race were used as candidates for a stepwise multiple linear regression analysis, as well as interaction terms with race. Predictors of PTH in order of decreasing importance were BMI (R2 = 9.4%; P<0.0001), age (R2 = 1.0%; P<0.01), and serum 25-OHD (R2 = 0.8%; P<0.04). The total R2 for this model was 11.2% (P<0.001). Analysis of our unadjusted data showed that 22.3% of our overall study population had serum PTH levels above 46 pg/mL (27.8% of black study subjects and 17.5% of white study subjects) (Fig. 3).
Reference Ranges for PTH for Various 25-OHD Cutoff Values
We computed reference ranges for PTH for various cutoff values of serum 25-OHD and reported these data separately for black subjects and white subjects as well as for both study groups combined (Table 2). Reference ranges were computed for 25-OHD cutoff values of >30 nmol/L and, in 10-unit increments, up to and including >80 nmol/L.
Table 2.
Parathyroid Hormone Reference Ranges for Various 25-Hydroxyvitamin D Cutoff Values, Shown for Black Study Subjects, White Study Subjects, and Both Collectively
|
Black study subjects |
White study subjects |
Black + white study subjects |
||||
|---|---|---|---|---|---|---|
| Cutoff value (nmol/L) | No. | Reference range* | No. | Reference range* | No. | Reference range* |
| 30 or less | 127 | 18.5–70.0 (17.3–67.5) | 27 | 18.2–76.5 (16.5–77.8) | 154 | 18.2–73.0 (17.2–72.2) |
| >30 | 101 | 14.9–72.7 (14.8–67.2) | 234 | 16.6–61.4 (16.0–62.2) | 335 | 16.6–66.3 (16.0–66.0) |
| >40 | 65 | 14.4–74.9 (13.8–74.6) | 206 | 16.6–59.6 (16.0–59.4) | 271 | 16.5–62.1 (15.7–65.2) |
| >50 | 42 | 19.1–67.6 (19.1–66.0) | 172 | 16.5–60.3 (15.8–59.6) | 214 | 16.5–62.1 (15.8–63.8) |
| >60 | 30 | 19.1–82.2 (20.4–74.6) | 131 | 16.0–59.6 (15.7–59.0) | 161 | 16.5–59.6 (15.8–59.0) |
| >70 | 15 | 19.1–49.5 (20.4–47.1) | 109 | 16.0–66.3 (14.8–65.2) | 124 | 16.0–59.6 (15.7–58.8) |
| >80 | 9 | 23.0–49.5 (20.4–45.4) | 82 | 16.0–59.6 (15.7–58.8) | 91 | 16.0–59.6 (15.7–58.8) |
| No cutoff | 228 | 16.5–72.7 (17.2–67.5) | 261 | 16.8–61.5 (16.4–62.2) | 489 | 16.6–67.6 (16.6–67.2) |
Reference ranges (pg/mL) refer to the 2.5 and 97.5 percentiles (values in parentheses are percentiles adjusted for age).
In addition to the unadjusted 2.5 and 97.5 percentiles, the corresponding PTH reference ranges adjusted for age were compiled (Table 2). The adjusted PTH percentiles were obtained by adjusting each patient’s PTH values by age with use of the following method. By regression of PTH values against age for each race, we obtained regression coefficients (slopes) of 0.29 pg/mL per year for black study subjects and 0.09 pg/mL per year for white study subjects. A race-specific PTH adjustment was made for each patient, which either increased or decreased the PTH value for each year of patient age that was above or below the respective mean age of the race. In other words, the formula we used for PTH adjustment for age was PTH (adjusted) = PTH (unadjusted) + slope X (mean age – patient age). As shown in Table 2, adjustment for age did not significantly change the reference ranges. With relatively large sample sizes for the various 25-OHD cutoff values, only a very slight decline in the 97.5 percentile of PTH for increasing cutoff values was noted (Table 2). This finding is consistent with the small negative correlation of PTH versus 25-OHD (Fig. 3); however, the finding by Souberbielle et al (25) of 46 pg/mL as a proposed revised upper limit of the reference range for PTH does not appear to have been replicated with our data.
PTH Values Adjusted for Z-Scores and 25-OHD Level: Reference Ranges for Age Decades
In Table 3, the study participants with serum 25-OHD levels above 50 nmol/L are considered (214 participants). When we also excluded patients with Z-scores below −2.0 for the lumbar spine or the femoral neck, the number declined by 5% of participants. Thus, the data in Table 3 are based on 205 study participants (40 black and 165 white women). This 5% decline appears reasonable on the basis of our Z-score criterion of −2.0. A scatterplot of the PTH values generating the reference ranges for each age decade is shown in Figure 2. Examination of the 97.5 percentiles (where sample sizes are largest) does not suggest lowering of the upper limit of normal PTH from 65 pg/mL to 46 pg/mL. For both groups combined in Figure 2, many plotted points exist between these 2 PTH limits for most of the age decades. In contrast, relatively few data points are above 65 pg/mL. These graphical observations seem to indicate the adequacy of the current upper limit of normal PTH of 65 pg/mL.
Table 3.
Parathyroid Hormone Reference Ranges Shown by Age Decade for Black Study Subjects, White Study Subjects, and Both Collectively*
|
Black study subjects |
White study subjects |
Black + white study subjects |
||||
|---|---|---|---|---|---|---|
| Age decade (yr) | No. | Reference range† | No. | Reference range† | No. | Reference range† |
| 20–29 | 5 | 19.1–36.1 | 17 | 17.1–52.8 | 22 | 17.1–52.8 |
| 30–39 | 6 | 19.4–62.1 | 24 | 14.1–70.3 | 30 | 14.1–70.3 |
| 40–49 | 6 | 14.4–55.8 | 30 | 17.0–61.4 | 36 | 14.4–61.4 |
| 50–59 | 14 | 23.0–67.8 | 32 | 15.7–60.3 | 46 | 16.6–60.3 |
| 60–69 | 6 | 24.4–49.6 | 38 | 16.0–68.5 | 44 | 16.0–66.3 |
| 70–79 | 3 | 40.1–82.2 | 24 | 16.5–59.6 | 27 | 16.5–82.2 |
| Overall (20–79) | 40 | 16.7–74.9 | 165 | 16.5–60.3 | 205 | 16.5–62.1 |
Patients with Z-scores less than −2.0 were excluded; all patients had 25-hydroxyvitamin D values >50 nmol/L.
Reference ranges (pg/mL) refer to the 2.5 and 97.5 percentiles.
Trichotomized BMI as a Predictor of PTH
To investigate high BMI further as a predictor of PTH, we trichotomized BMI. If we redo the regression by taking logs of PTH and consider normal BMI as the reference group, we are able to estimate the percentage increase of PTH attributable to being overweight or obese, in comparison with normal BMI, adjusted for age and 25-OHD. The unadjusted percentage increases of PTH from normal to overweight and from normal to obese are 16.3% and 27.7%, respectively. Clearly, being overweight or obese is associated with a much higher percentage increase of PTH in comparison with increasing age as much as 10 years or decreasing 25-OHD by 10 nmol/L. Adjusted percentage increases for high BMI are just slightly less than the unadjusted increases.
Ethnic Group as a Predictor of PTH
Univariate analysis showed that black study subjects had significantly higher PTH values than did white study subjects (P<0.02). Nonetheless, in the multivariate analysis, with use of P<0.05 as a cutoff, ethnic group failed to enter into the multivariate analysis. It is of interest to determine why this result eventuates—that is, how differences in PTH by race are explained by other variables and to what extent. An analysis of mean age, BMI, and 25-OHD, stratified by race, is presented in Table 4. Black subjects in our study population had significantly higher BMI, younger age, and lower levels of serum 25-OHD than did white subjects. These 3 continuous variables, however, were univariate and multivariate predictors of PTH; once entered into the equation in a stepwise manner, race became insignificant (P = 0.80). We adjusted mean PTH by race for various combinations of variables in a regression model. When we adjusted only for age and 25-OHD, differences in PTH by race could not be completely explained, inasmuch as race was still significant (P = 0.05). With the additional adjustment for BMI, ethnic mean differences of PTH became very small (0.4 pg/mL) and insignificant (P = 0.80).
Table 4.
Analysis of Age, Body Mass Index, and 25-Hydroxyvitamin D, Stratified by Race*
|
Black study subjects |
White study subjects |
||||
|---|---|---|---|---|---|
| Variable | Mean | SD | Mean | SD | Pvalue† |
| Age (yr) | 43.7 | 13.4 | 51.4 | 14.7 | <0.0001 |
| Body mass index (kg/m2) | 26.3 | 4.1 | 23.9 | 3.3 | <0.0001 |
| 25-OHD (nmol/L) | 32.7 | 21.1 | 67.8 | 34.3 | <0.0001 |
25-OHD = 25-hydroxyvitamin D.
By rank sum test.
Partitioning of Subgroups in the PTH Reference Range
The more stringent approach, proposed by Sinton et al (30), indicated no need for consideration of partitioning of any of the subgroups, including the variables of BMI and serum 25-OHD. The less stringent analysis, recommended by the National Committee for Clinical Laboratory Standards, would support the conclusion that partitioning would not be considered for 25-OHD (and other variables) but could be considered for normal weight versus overweight and obese subjects. The PTH reference range for normal weight subjects was 16.0 to 59.6 pg/mL in comparison with 18.4 to 72.7 pg/mL for those who were overweight or obese. Thus, if one chose to partition PTH values, it would be done on the basis of adiposity rather than serum 25-OHD levels.
DISCUSSION
The current study confirms the manufacturer’s reference range for serum PTH with use of the Allegro radioimmunometric assay and establishes that its upper limit should not be lowered from 65 pg/mL. Our study participants were healthy volunteers recruited through a direct mail campaign. Volunteers with chronic illness, morbid obesity, hypertension, diabetes, thyroid disease, or osteoporosis were excluded from the study. They were further found to be healthy by a thorough history and physical examination and routine laboratory studies. Adjustment of the data by excluding subjects with a Z-score below −2.0 had no influence on the reference range. Unlike most previous studies, our study included subjects from 20 to 79 years of age. The size of our study population was sufficient to develop a reference range. Formal analysis to determine whether any subgroup should be partitioned suggested only that consideration could be given to partitioning for BMI. We believe it is practical that consideration be given to BMI, age, renal function, vitamin D status, and calcium intake when PTH levels are evaluated.
The problem with standardization and operator variability in 25-OHD assays should be emphasized (33). A variety of methods are available, and different extraction procedures are used. The International Vitamin D External Quality Assessment Scheme is an effort to harmonize 25-OHD assays among different laboratories (33). Our laboratory is a member of this effort at standardization. Our serum 25-OHD level was based on a radioimmunoassay developed by Incstar, which became the current widely used assay manufactured by DiaSorin. The current DiaSorin assay differs from the original Incstar assay by only +2.75 nmol/L (DiaSorin technical report, 1999).
In addition, comment should be made about the Allegro radioimmunoassay used in the study by Souberbielle et al (25) and our study. Improvements have been made in this assay for intact PTH, resulting in the Immulite and Nichols intact assays (15,34,35). The correlations between these assays and the Allegro assay have been reported to be greater than 0.9 (15,34,35). Moreover, the reference ranges for these assays are essentially the same as that reported for the Allegro assay (36–38). Our findings should apply to these intact PTH assays as well. Because we did not study the newer Scantibodies assay in this population, we cannot comment on the reference range for that assay (39).
Levels of PTH in the highest quartile of the reference range may not always be deleterious. In our comparative study of African American and white women, we found that, despite having lower levels of serum 25-OHD and higher levels of serum PTH, black women have lower bone turnover and higher bone density (28). The higher PTH values found in African American subjects (which some investigators have hypothesized may even be beneficial) seem to be due to lower serum 25-OHD levels and a higher BMI in black women because race did not enter our multivariate model. Moreover, in a recent clinical trial examining vitamin D supplementation in African American women in midlife, we found no effect of vitamin D supplements on bone density (40).
Obesity is associated with low 25-OHD and high PTH levels (41–43). Wortsman et al (44) investigated the mechanism for low serum 25-OHD in the setting of obesity. They compared obese and nonobese subjects after ultraviolet exposure and oral administration of vitamin D2. Serum concentrations of vitamin D3 (ultraviolet irradiation) and vitamin D2 (oral intake) were inversely correlated with BMI. These authors concluded that there is decreased bioavailability of vitamin D because of its deposition in body fat.
Of note, in our current study group, only 12.5% of participants were obese; nevertheless, BMI emerged as the strongest predictor of PTH levels. Our trichotomized analysis of BMI demonstrated that the reference range for PTH is considerably influenced by the presence of obesity. The importance of obesity as a determinant of PTH levels is underscored by the observation that our study population was less obese than the general population in the United States (45).
Age also entered our model for determinants of serum PTH levels. Secondary hyperparathyroidism has been thought to be common in the elderly population because of declining renal function. Vieth et al (46) showed that, for similar 25-OHD concentrations, PTH levels were higher in elderly subjects than in younger persons. This observation is consistent with our findings. They proposed that older adults need more vitamin D to prevent secondary hyperparathyroidism because they require higher 25-OHD concentrations to suppress the elevated PTH levels that accompany declining renal function.
CONCLUSION
The data in this healthy female population suggest that the upper limit of the reference range for PTH with use of the intact Allegro radioimmunometric assay should not be lowered. Instead, in patients with normal serum calcium levels and PTH in the upper reference range, clinicians should consider whether they have higher PTH values because of increased body weight, advanced age, reduced renal function, low dietary calcium intake, or low serum 25-OHD levels. When these variables are not present, it is appropriate to consider the entity of normocalcemic hyperparathyroidism (25,35–37). Because they are heavier and have lower 25-OHD levels as a group, African American women have higher PTH values than do white women.
Acknowledgments
This research was funded by the National Institute of Aging (RO1 AG15325), National Institutes of Health. We thank Sharon Sprintz, RT, and Jane Moore, RN, for their expertise and Audrey Gallo-Neglia for preparation of the manuscript.
References
- 1.Berson SA, Yalow RS, Aurbach GD, Potts JT., Jr Immunoassay of bovine and human parathyroid hormone. Proc Natl Acad Sci U S A. 1963;49:613–617. doi: 10.1073/pnas.49.5.613. [DOI] [PMC free article] [PubMed] [Google Scholar]
- 2.Martin KJ, Hruska K, Freitag JJ. Clinical utility of radioimmunoassays for parathyroid hormone. Miner Electrolyte Metab. 1980;3:283–290. [Google Scholar]
- 3.Hanley DA, Takatsuki KJ, Sultan JM, Schneider AB, Sherwood LM. Direct release of parathyroid hormone fragments from functioning bovine parathyroid glands in vitro. J Clin Invest. 1978;62:1247–1254. doi: 10.1172/JCI109245. [DOI] [PMC free article] [PubMed] [Google Scholar]
- 4.Mayer GP, Keaton JA, Hurst JG, Habener JF. Effects of plasma calcium concentration on the relative proportion of hormone and carboxyl fragments in parathyroid venous blood. Endocrinology. 1979;104:1778–1784. doi: 10.1210/endo-104-6-1778. [DOI] [PubMed] [Google Scholar]
- 5.Morrissey JJ, Hamilton JW, MacGregor RR, Cohn DV. The secretion of parathormone fragments 34–84 and 37–84 by dispersed porcine parathyroid cells. Endocrinology. 1980;107:164–171. doi: 10.1210/endo-107-1-164. [DOI] [PubMed] [Google Scholar]
- 6.MacGregor RR, Cohn DV, Hamilton JW. The content of carboxyl-terminal fragments of parathormone in extracts of fresh bovine parathyroids. Endocrinology. 1983;112:1019–1025. doi: 10.1210/endo-112-3-1019. [DOI] [PubMed] [Google Scholar]
- 7.Singer FR, Segre GV, Habener JF, Potts JT., Jr Peripheral metabolism of bovine parathyroid hormone in the dog. Metabolism. 1975;24:139–144. doi: 10.1016/0026-0495(75)90014-1. [DOI] [PubMed] [Google Scholar]
- 8.Segre GV, D’Amour P, Potts JT., Jr Metabolism of radioiodinated bovine parathyroid hormone in the rat. Endocrinology. 1976;99:1645–1652. doi: 10.1210/endo-99-6-1645. [DOI] [PubMed] [Google Scholar]
- 9.Bringhurst FR, Segre GV, Lampman GW, Potts JT., Jr Metabolism of parathyroid hormone by Kupffer cells: analysis by reverse-phase high-performance liquid chromatography. Biochemistry. 1982;21:4252–4258. doi: 10.1021/bi00261a011. [DOI] [PubMed] [Google Scholar]
- 10.Martin KJ, Finch JL, Hruska K, Slatopolsky E. Effect of biological activity of PTH on its peripheral metabolism in the rat. Kidney Int. 1987;31:937–940. doi: 10.1038/ki.1987.89. [DOI] [PubMed] [Google Scholar]
- 11.Martin KJ, Hruska KA, Freitag JJ, Klahr S, Slatopolsky E. The peripheral metabolism of parathyroid hormone. N Engl J Med. 1979;301:1092–1098. doi: 10.1056/NEJM197911153012005. [DOI] [PubMed] [Google Scholar]
- 12.Nussbaum SR, Zahradnik RJ, Lavigne JR, et al. Highly sensitive two-site immunoradiometric assay of parathyrin, and its clinical utility in evaluating patients with hypercalcemia. Clin Chem. 1987;33:1364–1367. [PubMed] [Google Scholar]
- 13.Brown RC, Aston JP, Weeks I, Woodhead JS. Circulating intact parathyroid hormone measured by a two-site immunochemiluminometric assay. J Clin Endocrinol Metab. 1987;65:407–414. doi: 10.1210/jcem-65-3-407. [DOI] [PubMed] [Google Scholar]
- 14.Kao PC, van Heerden JA, Grant CS, Klee GG, Khosla S. Clinical performance of parathyroid hormone immunometric assays. Mayo Clin Proc. 1992;67:637–645. doi: 10.1016/s0025-6196(12)60717-4. [DOI] [PubMed] [Google Scholar]
- 15.Michelangeli VP, Heyma P, Colman PG, Ebeling PR. Evaluation of a new, rapid and automated immunochemiluminometric assay for the measurement of serum intact parathyroid hormone. Ann Clin Biochem. 1997;34(Pt 1):97–103. doi: 10.1177/000456329703400115. [DOI] [PubMed] [Google Scholar]
- 16.Newman DJ, Ashby JP. Clinical and laboratory evaluation of a two-site immunoradiometric assay for intact parathyroid hormone. Ann Clin Biochem. 1988;25(Pt 6):654–660. doi: 10.1177/000456328802500610. [DOI] [PubMed] [Google Scholar]
- 17.Ratcliffe WA, Heath DA, Ryan M, Jones SR. Performance and diagnostic application of a two-site immunoradiometric assay for parathyrin in serum. Clin Chem. 1989;35:1957–1961. [PubMed] [Google Scholar]
- 18.Endres DB, Villanueva R, Sharp CF, Jr, Singer FR. Immunochemiluminometric and immunoradiometric determinations of intact and total immunoreactive parathyrin: performance in the differential diagnosis of hypercalcemia and hypoparathyroidism. Clin Chem. 1991;37:162–168. [PubMed] [Google Scholar]
- 19.Blind E, Schmidt-Gayk H, Scharla S, et al. Two-site assay of intact parathyroid hormone in the investigation of primary hyperparathyroidism and other disorders of calcium metabolism compared with a midregion assay. J Clin Endocrinol Metab. 1988;67:353–360. doi: 10.1210/jcem-67-2-353. [DOI] [PubMed] [Google Scholar]
- 20.Martin KJ, Akhtar I, Gonzalez EA. Parathyroid hormone: new assays, new receptors. Semin Nephrol. 2004;24:3–9. doi: 10.1053/j.semnephrol.2003.08.019. [DOI] [PubMed] [Google Scholar]
- 21.Lips P, Duong T, Oleksik A, et al. A global study of vitamin D status and parathyroid function in postmenopausal women with osteoporosis: baseline data from the multiple outcomes of raloxifene evaluation clinical trial [erratum in J Clin Endocrinol Metab. 2001;86:3008] J Clin Endocrinol Metab. 2001;86:1212–1221. doi: 10.1210/jcem.86.3.7327. [DOI] [PubMed] [Google Scholar]
- 22.Tangpricha V, Pearce EN, Chen TC, Holick MF. Vitamin D insufficiency among free-living healthy young adults. Am J Med. 2002;112:659–662. doi: 10.1016/s0002-9343(02)01091-4. [DOI] [PMC free article] [PubMed] [Google Scholar]
- 23.Chapuy MC, Preziosi P, Maamer M, et al. Prevalence of vitamin D insufficiency in an adult normal population. Osteoporos Int. 1997;7:439–443. doi: 10.1007/s001980050030. [DOI] [PubMed] [Google Scholar]
- 24.Chapuy MC, Schott AM, Garnero P, Hans D, Delmas PD, Meunier PJ (EPIDOS Study Group) Healthy elderly French women living at home have secondary hyperparathyroidism and high bone turnover in winter. J Clin Endocrinol Metab. 1996;81:1129–1133. doi: 10.1210/jcem.81.3.8772587. [DOI] [PubMed] [Google Scholar]
- 25.Souberbielle JC, Cormier C, Kindermans C, et al. Vitamin D status and redefining serum parathyroid hormone reference range in the elderly. J Clin Endocrinol Metab. 2001;86:3086–3090. doi: 10.1210/jcem.86.7.7689. [DOI] [PubMed] [Google Scholar]
- 26.Souberbielle JC, Lawson-Body E, Hammadi B, Sarfati E, Kahan A, Cormier C. The use in clinical practice of parathyroid hormone normative values established in vitamin D-sufficient subjects. J Clin Endocrinol Metab. 2003;88:3501–3504. doi: 10.1210/jc.2003-030097. [DOI] [PubMed] [Google Scholar]
- 27.Holick MF. The parathyroid hormone D-lema. J Clin Endocrinol Metab. 2003;88:3499–3500. doi: 10.1210/jc.2003-031025. [DOI] [PubMed] [Google Scholar]
- 28.Aloia JF, Vaswani A, Yeh JK, Flaster E. Risk for osteoporosis in black women. Calcif Tissue Int. 1996;59:415–423. doi: 10.1007/BF00369203. [DOI] [PubMed] [Google Scholar]
- 29.Sasse EA, Doumas B, Miller WG, et al (National Committee for Clinical Laboratory Standards [NCCLS]). How to Define and Determine Reference Intervals in the Clinical Laboratory: Approved Guideline. 2nd ed. NCCLS document C28-A2 (ISBN 1-156238-406-6). Wayne, PA: NCCLS, 2000. Available at: http://www.nccls.org/es/source/orders/free/c28-a2.pdf Accessed for verification September 24, 2005.
- 30.Sinton TJ, Cowley DM, Bryant SJ. Reference intervals for calcium, phosphate, and alkaline phosphatase as derived on the basis of multichannel-analyzer profiles. Clin Chem. 1986;32(1 Pt 1):76–79. [PubMed] [Google Scholar]
- 31.Harris EK, Wong ET, Shaw ST., Jr Statistical criteria for separate reference intervals: race and gender groups in creatine kinase. Clin Chem. 1991;37:1580–1582. [PubMed] [Google Scholar]
- 32.Harris EK, Boyd JC. On dividing reference data into subgroups to produce separate reference ranges. Clin Chem. 1990;36:265–270. [PubMed] [Google Scholar]
- 33.Carter GD, Carter R, Jones J, Berry J. How accurate are assays for 25-hydroxyvitamin D? Data from the International Vitamin D External Quality Assessment Scheme. Clin Chem. 2004;50:2195–2197. doi: 10.1373/clinchem.2004.040683. [DOI] [PubMed] [Google Scholar]
- 34.Hermse D, Franzson L, Hoffmann JP, et al. Multicenter evaluation of a new immunoassay for intact PTH measurement on the Elecsys System 2010 and 1010. Clin Lab. 2002;48(3–4):131–141. [PubMed] [Google Scholar]
- 35.Inaba M, Nakatsuka K, Imanishi Y, et al. Technical and clinical characterization of the Bio-PTH (1-84) immunochemiluminometric assay and comparison with a second-generation assay for parathyroid hormone. Clin Chem. 2004;50:385–390. doi: 10.1373/clinchem.2003.026831. [DOI] [PubMed] [Google Scholar]
- 36.IMMULITE 2000 Intact PTH. Diagnostic Products Corporation. (PIL2KPP-14, 2005-04-05): page 5. Available at: http://www.dpcweb.com/package_inserts/immulite_2000/pdfs/Bone%20Metabolism/l2kpp-14.pdf Accessed for verification September 24, 2005.
- 37.Nichols Advantage Intact Parathyroid Hormone Assay. San Juan Capistrano, CA: Nichols Institute Diagnostics. Catalog No. 62-7022, Item No. 36B-7022: page 9. Rev. E. Available at: http://www.nicholsdiag.com/products/bone/di-ipth.pdf Accessed for verification September 24, 2005.
- 38.INTACT PTH—Parathyroid Hormone. San Juan Capistrano, CA: Nichols Institute Diagnostics. Catalog No. 60-4446, Item No. 36T-4446: page 6. Rev. C.
- 39.Tanno Y, Yokoyama K, Nakayama M, et al. IRMA (whole PTH) is a more useful assay for the effect of PTH on bone than the Allegro intact PTH assay in CAPD patients with low bone turnover marker. Nephrol Dial Transplant. 2003;18(Suppl 3):III97–III98. doi: 10.1093/ndt/gfg1025. [DOI] [PubMed] [Google Scholar]
- 40.Aloia JF, Talwar SA, Pollack S, Yeh J. A randomized controlled trial of vitamin D3 supplementation in African American women. Arch Intern Med. 2005;165:1618–1623. doi: 10.1001/archinte.165.14.1618. [DOI] [PMC free article] [PubMed] [Google Scholar]
- 41.Andersen T, McNair P, Fogh-Andersen N, Nielsen TT, Hyldstrup L, Transbol I. Increased parathyroid hormone as a consequence of changed complex binding of plasma calcium in morbid obesity. Metabolism. 1986;35:147–151. doi: 10.1016/0026-0495(86)90116-2. [DOI] [PubMed] [Google Scholar]
- 42.Bell NH, Epstein S, Greene A, Shary J, Oexmann MJ, Shaw S. Evidence for alteration of the vitamin D-endocrine system in obese subjects. J Clin Invest. 1985;76:370–373. doi: 10.1172/JCI111971. [DOI] [PMC free article] [PubMed] [Google Scholar]
- 43.Bell NH, Epstein S, Shary J, Greene V, Oexmann MJ, Shaw S. Evidence of a probable role for 25-hydroxyvitamin D in the regulation of human calcium metabolism. J Bone Miner Res. 1988;3:489–495. doi: 10.1002/jbmr.5650030503. [DOI] [PubMed] [Google Scholar]
- 44.Wortsman J, Matsuoka LY, Chen TC, Lu Z, Holick MF. Decreased bioavailability of vitamin D in obesity [erratum in Am J Clin Nutr. 2003;77:1342] Am J Clin Nutr. 2000;72:690–693. doi: 10.1093/ajcn/72.3.690. [DOI] [PubMed] [Google Scholar]
- 45.Flegal KM, Carroll MD, Ogden CL, Johnson CL. Prevalence and trends in obesity among US adults, 1999–2000. JAMA. 2002;288:1723–1727. doi: 10.1001/jama.288.14.1723. [DOI] [PubMed] [Google Scholar]
- 46.Vieth R, Ladak Y, Walfish PG. Age-related changes in the 25-hydroxyvitamin D versus parathyroid hormone relationship suggest a different reason why older adults require more vitamin D. J Clin Endocrinol Metab. 2003;88:185–191. doi: 10.1210/jc.2002-021064. [DOI] [PubMed] [Google Scholar]