

Abstract
The gerA, gerB, and gerK operons, which encode germinant receptors in spores of Bacillus subtilis, were transcribed only in sporulation, and their mRNA levels peaked initially ∼3 h before the initiation of accumulation of the spore's dipicolinic acid. After a rapid fall, levels of these mRNAs peaked again ∼5 h later. In one wild-type strain (PS832), gerA mRNA was the most abundant, with levels of gerB and gerK mRNAs ∼50% of that of gerA mRNA, whereas gerB mRNA was the most abundant in another wild-type strain (PY79). The synthesis of gerK mRNA in sporulation was abolished by loss of the forespore-specific RNA polymerase sigma factor, σG, and induction of σG synthesis in vegetative cells led to synthesis of gerK mRNA. SpoVT, a regulator of σG-dependent gene expression, repressed gerK expression. The gerK promoter showed sequence similarities to σG-dependent promoters, and deletion of elements of this putative promoter abolished gerK expression in sporulation.
Spores of Bacillus species formed in sporulation are metabolically dormant and extremely resistant to environmental stresses (17, 27). As a consequence, these spores can survive for extremely long periods in the absence of nutrients (12, 17, 27). However, the spores can respond to nutrients in their environment, and when appropriate nutrients are present, the spore can rapidly return to life via spore germination followed by outgrowth (16, 23, 26). Spores sense nutrients via germinant receptors located in the spore's inner membrane (10, 22). In Bacillus subtilis there are currently three known functional germinant receptors encoded by the gerA, gerB, and gerK operons, each of which contain three cistrons (16, 23, 26), and the three proteins encoded by each of these operons likely interact to form a functional germinant receptor (11, 20). The GerA receptor responds to l-alanine alone, while the GerB receptor is required for the spore's response to a mixture of glucose, fructose, and K+ (GFK) plus either l-alanine or l-asparagine (16, 23, 26). The precise function of the GerK receptor is not known, but GerK is essential for the response of the GerB receptor to alanine or asparagine and GFK and for the stimulation of the GerA receptor's response to glucose (1, 16, 23, 26). It has been suggested that GerK's major function is to respond to glucose (1).
The regulation of expression of the gerA and gerB operons in B. subtilis was initially studied using transcriptional lacZ fusions to these operons (6, 9). These lacZ fusions are expressed only during sporulation in the developing forespore several hours before the forespore begins to accumulate its large depot (∼10% of spore dry weight) of pyridine-2,6-dicarboxylic acid (dipicolinic acid [DPA]). Transcription of the gerA and gerB operons is largely (the gerA operon) or exclusively (the gerB operon) by RNA polymerase with the forespore-specific sigma factor, σG (6, 7, 9, and see below), and the −10 and −35 sequences in the promoters of the gerA and gerB operons conform to those in σG-dependent promoters. Studies of genes expressed in the forespore under σG control by microarray technology have also identified the gerA and gerB operons as members of the σG regulon, although gerA is also a member of the σF regulon (29, 30, 33). In addition to positive regulation by σG, expression of gerA and gerB is repressed by SpoVT, a DNA-binding protein that modulates expression of many σG-dependent genes (3, 5).
Microarray technology has shown that the gerK operon is also controlled by σG, as are two other tricistronic operons, yndDEF and yfkQRS, whose products show significant amino acid sequence homology to those of the gerA, gerB, and gerK operons yet have no known function in spore germination (21, 29, 33). There have been no detailed studies of the regulation of gerK expression, and no information on the relative levels of gerA, gerB, and gerK mRNAs is available. This latter information would be of interest, since the level of at least the GerB receptor is extremely low (∼25 molecules/spore; 22), and knowledge of relative levels of the GerA, GerB, and GerK receptors may give some insight into factors determining rates of spore germination with various nutrients and nutrient combinations. Consequently, we have used quantitative reverse transcriptase PCR (qRT-PCR) to measure levels of gerK mRNA in growth and sporulation and compared these levels to those of gerA and gerB mRNAs. The regulation of expression of gerK mRNA by σG and SpoVT has also been studied, and the gerK mRNA start site has been identified by 5′ rapid amplification of cDNA ends (5′-RACE).
Levels of gerKA, gerAA, and gerBA mRNAs during sporulation of various B. subtilis strains.
Two relatively closely related wild-type B. subtilis strains, PS832 and PY79, were used in this work, both of which are derivatives of strain 168 (Table 1). We also used (Table 1) (i) a transformant of PS832 that carries plasmid pDG298 in which the coding gene for σG is under the control of the isopropyl-β-d-thiogalactoside (IPTG)-inducible spac promoter (strain PS766); (ii) a derivative of PY79 in which spoVT is deleted (strain IB1); and (iii) a derivative of strain PY79 with a null mutation in sigG (strain SC500) (Table 1). Strains PY79, IB1, SC500, and PS832 were sporulated using the nutrient exhaustion method at 37°C in liquid 2× SG medium (18) without antibiotics. 2× SG medium is similar to Schaefffer's sporulation medium (25) but is significantly richer and supports higher cell densities than does Schaeffer's medium (13, 18). 2× SG medium has been used to measure the timing of a variety of sporulation events, including expression of a number of forespore-specific genes such as gerA and gdh and the various ssp genes (2, 4, 14, 24, 30, 31). At various times, samples were harvested from cultures for RNA extraction. In general, the pellet fraction from 2 ml of culture was suspended in 0.6 ml of RLT buffer provided in the RNeasy Mini kit (QIAGEN, Valencia, CA), and cells were disrupted in a tube of Lysing Matrix B (Qbiogene, Irvine, CA) by shaking with glass beads in a Mini-BeadBeater (Biospec Products, Bartlesville, OK). RNA in the supernatant fluid from the disrupted cells was isolated according to the RNeasy Mini kit protocol. The extracted RNAs were treated with the TURBO DNA-free kit (Ambion, Austin, TX), and the RNA was further purified and concentrated with the RNEasy MiniElute Cleanup kit (QIAGEN). Defined amounts of the purified RNA were reverse transcribed with gene-specific primers (all primer sequences are available on request) using Superscript III Reverse Transcriptase (Invitrogen, Carlsbad, CA), and each resultant first-strand cDNA was analyzed by real-time PCR based on SYBR green intercalation using the iQ SYBR Green Supermix (Bio-Rad, Hercules, CA). The increase in fluorescence caused by dye intercalation with the PCR products was measured using the iCycler system (Bio-Rad), and these data were used to measure the amounts of various RNAs. The amounts of target mRNA in samples of cellular RNA were determined with reference to a standard curve of threshold-crossing values generated using known amounts of an in vitro transcript of each target mRNA. In vitro transcription was performed with the T7 RiboMax Express Large Scale RNA Production System (Promega, Madison, WI) and PCR-prepared gene-specific templates whose 5′ ends contained the core sequence of the T7 promoter. The transcripts were purified and concentrated as described above for RNA extracted from cells. The levels of various mRNA in cells are reported relative to those of 16S rRNAs, since levels of total rRNAs remain relatively constant throughout sporulation (28). Most mRNA levels were determined in at least two separate experiments, and values from replicate experiments were within 35% of each other.
TABLE 1.
B. subtilis strains used
| Strain | Genotype | Phenotype | Source |
|---|---|---|---|
| PS766a | [pDG298] | sigG under Pspac control | 31 |
| PS832a | Wild type | Laboratory stock | 4 |
| PY79b | trp | Wild type | 34 |
| IB1b | spoVT trp | spoVT | 3 |
| SC500b | sigG trp | Asporogenous | 2 |
The background is PS832.
The background is PY79.
The mRNA from gerKA, the first gene in the gerK operon, was not detected until midway in sporulation of either of the wild-type parental strains, PY79 and PS832 (Fig. 1 and data not shown). The initial peak in the level of gerKA mRNA was attained well before the accumulation of maximum levels of DPA by the developing spore, as determined by harvesting culture samples and extracting and analyzing DPA colorimetrically as described previously (18) (Fig. 1). The time of the initial appearance of gerKA mRNA was ∼3.5 h after the initiation of sporulation (Fig. 1; the vertical arrow denotes the initiation of sporulation), identical to that for the appearance of gerAA and gerBA mRNA (data not shown), and was when expression of lacZ fusions to many σG-dependent forespore-specific genes have been detected during sporulation in 2× SG medium (2, 4, 14, 30, 31). Surprisingly, while the initial level of gerKA mRNA attained midway in sporulation of either PY79 or PS832 fell almost to zero, this fall was followed by a second increase that resulted in an even higher level of gerKA mRNA (Fig. 1 and data not shown). The appearance of this second peak was only slightly before maximum DPA levels were acquired by the developing spore (Fig. 1). Levels of gerAA and gerBA mRNAs changed in parallel with those of gerKA mRNA, as did those of two other σG-dependent forespore-expressed RNAs transcribed from the spoVA operon (spoVAA mRNA) and the gdh gene, including the second peak late in sporulation (data not shown). While levels of RNAs from all three germinant receptor operons changed in parallel during sporulation of PY79 and PS832, the relative levels of the three mRNAs differed between these two strains (Table 2).
FIG. 1.

Levels of gerKA mRNA and DPA during sporulation of B. subtilis. B. subtilis strain PY79 (wild type) was sporulated, samples were harvested, DPA was extracted and analyzed, RNA was extracted,and gerKA mRNA levels were quantitated relative to those of 16S rRNA as described in the text. The vertical arrow in the figure denotes the time of initiation of sporulation as determined by following the optical density at 600 nm of the culture. Symbols: •, DPA; ○, gerKA mRNA.
TABLE 2.
Levels of gerAA, gerBA, and gerKA mRNAs in various types of B. subtilis cellsd
| Cells analyzed | Genotype | Relative peak mRNA levelsa
|
||
|---|---|---|---|---|
| gerAA | gerBA | gerKA | ||
| PY79 strains | ||||
| Sporulating PY79, peak 1 | Wild type | 0.3 | 1.0 (2 × 10⁻⁴) | 0.6 |
| Sporulating PY79, peak 2 | Wild type | 0.3 | 0.9 | 1.0 (2 × 10⁻⁴) |
| Sporulating SC500 | sigG | —b | —b | NDc (≤5 × 10⁻⁶) |
| Sporulating IB1, peak 1 | spoVT | 0.5 | 0.5 | 1.0 (5 × 10⁻⁴) |
| Sporulating IB1, peak 2 | spoVT | 1.0 (3 × 10⁻⁴) | 0.7 | 0.5 |
| PS832 strains | ||||
| Sporulating PS832, peak 1 | Wild type | 1.0 (4 × 10⁻⁴) | 0.5 | 0.6 |
| Sporulating PS832, peak 2 | Wild type | 1.0 (4 × 10⁻⁴) | 0.4 | 0.5 |
| IPTG induced PS766 | Pspac-sigG | 0.4 | 1.0 (1.3 × 10⁻³) | 0.9 |
ger mRNA levels are given relative to the mRNA whose level was the highest based on ratios of the level of mRNA to 16S rRNAs, and this level was set at 1.0. Values in parentheses are the actual ratios of the level of this ger operon's mRNA to the level of 16S rRNAs.
—, not analyzed.
ND, gerKA mRNA could not be detected in this strain.
As expected, gerKA mRNA was not detected at any time in sporulation of a strain that lacked σG (Table 2, strain SC500), nor was gerA or gerB mRNAs (6, 9, 29, 33). This is consistent with the transcription of gerK by RNA polymerase with σG. A second important regulator for σG-dependent forespore-specific genes is the product of the spoVT locus that is also transcribed by RNA polymerase with σG (3, 5). SpoVT is a DNA-binding protein that can either repress or activate almost all σG-dependent genes and is homologous to AbrB, a key regulator of gene expression during the transition into stationary phase in B. subtilis (3, 5). SpoVT has been reported to repress gerA, gerB, and gerK expression on the basis of either lacZ reporter assays (gerA and gerB) or microarray technology (all three operons) (3, 29, 33). We also found this to be the case for peak 1 of gerKA mRNA, whose level was ∼4-fold higher in a spoVT strain than that in an isogenic wild-type strain (Table 2, compare results with strains PY79 [wild type] and IB1 [spoVT]). Levels of gerKA mRNA during sporulation of the spoVT strain also exhibited the same two peaks seen in wild-type strains (Table 2 and data not shown). The level of gerAA mRNA, although not that of gerBA mRNA, was also significantly higher during sporulation of the spoVT strain, and there were still two peaks in the levels of both mRNAs (Table 2, compare results with strains PY79 [wild type] and IB1 [spoVT], and data not shown).
Levels of gerKA, gerAA, and gerBA mRNAs upon induction of σG synthesis in vegetative cells.
We also examined levels of gerKA mRNA in vegetative cells in which σG synthesis was induced (Fig. 2). Strain PS766 (Pspac-sigG) was grown at 37°C in Luria-Bertani medium (19) to an optical density at 600 nm of ∼0.5, the culture made to 2 mM in isopropyl-β-d-thiogalactoside (IPTG), and growth continued. At various times before and after IPTG addition, samples were harvested and RNAs were prepared and quantitated as described above. While gerKA mRNA was not detected prior to induction, it accumulated rapidly after induction of σG synthesis and to a level higher than the peak levels in sporulation before falling to a very low level (Fig. 2; Table 2; compare values in strains PS832 [wild type] and PS766 [Pspac-sigG]). Levels of gerAA and gerBA mRNA also changed in parallel with that of gerKA mRNA (Fig. 2).
FIG. 2.

Levels of gerAA, gerBA, and gerKA mRNA with or without induction of σG synthesis during vegetative growth of B. subtilis. B. subtilis strain PS766 (Pspac-sigG) was grown, RNA was isolated at various times with or without induction of σG synthesis by addition of IPTG, and levels of various RNAs were quantitated as described in the text. Symbols: ○ and •, gerKA mRNA; □, gerBA mRNA; ▵, gerAA mRNA; ○, □, and ▵, with IPTG induction; and •, without IPTG induction. The vertical arrow denotes the time of IPTG addition.
Identification and analysis of the gerKA transcription start site.
To obtain further information on the mechanism of regulation of gerK expression, we determined the gerKA transcription start site by 5′-RACE (Fig. 3). The 5′ ends of gerKA mRNA purified as described above from cultures with peak levels of gerKA RNA in either sporulation or during vegetative growth after induction of σG synthesis were mapped using a SMART RACE cDNA Amplification kit (Clontech, Mountain View, CA). The level of gerKA mRNA from cultures in which σG synthesis was induced was high enough to directly sequence the 5′-RACE PCR product, and this identified a single major (∼80%; see below) 5′ end at a G residue 21 nucleotides (nt) upstream of the translation initiation codon (Fig. 3). Levels of gerKA mRNA from sporulating cells were lower than those from cells in which σG synthesis was induced (Table 2), and thus the 5′-RACE PCR products from sporulating cell RNA were first cloned in plasmid pCR2.1 (Invitrogen). When 8 to 10 clones obtained with RNAs from peak 1 or 2 in gerKA mRNA during sporulation of strain PY79 (wild type), PS832 (wild type), or IB1 (spoVT) were sequenced, ∼20 to 25% gave the same 5′ end as that found with the majority of gerKA mRNA from cells in which σG synthesis was induced. However, the remainder gave a 5′ end that was 4 nt downstream at an A residue (Fig. 3). This more downstream 5′ end was also identified on ∼20% of the gerKA transcripts synthesized in vegetative cells after induction of σG synthesis.
FIG. 3.

DNA sequence in the promoter region of the gerK operon in wild-type strains PY79 and PS832. The translation initiation codon of gerKA, the first gene in the gerK operon, is in boldface italic letters, the putative gerKA ribosome-binding site is heavily underlined, and the putative −10 and −35 sequences of the gerK promoter are overlined. The two 5′ ends of gerKA mRNA determined as described in the text are indicated by the boldface nucleotides, with the more upstream G residue denoted as the primary transcript (+1 position). The consensus sequences for σF- and σG-dependent promoters are from reference 30. The abbreviations used in the consensus −10 and −35 sequences are the following: H, C or T; M, A, C or T; R, A or G; W, A or T; and X, any nucleotide.
The sequences centered approximately 10 and 35 nt upstream of the more upstream 5′ end of gerKA mRNA showed fairly good homology to the consensus sequences in these regions for σG-dependent promoter sequences, and the spacing of the −10 and −35 sequences was also identical to that in the σG-dependent consensus promoter (Fig. 3). To confirm that these upstream sequences were indeed important for gerK expression, three deletion mutations were introduced in this region in strain PS832 by cutting at appropriate restriction enzyme cleavage sites that were generated with the QuikChange Site Directed Mutagenesis kit (Stratagene, La Jolla, CA). In the construction of these deletion strains, a kanamycin resistance marker was introduced ∼70 bp upstream of the −35 sequence. The introduction of this marker had no discernible effect on the level or timing of gerKA mRNA synthesis (data not shown), indicating that all information involved in regulation of gerK expression is within ∼100 bp upstream of the operon's transcription start site. Specific residues deleted in three different constructs were in the −10 region (bp −11 to −24, giving strain PgerK-Δ10), the spacer region (bp −24 to −31, giving strain PgerK-Δspacer), and the −35 region (bp −34 to −39, giving strain PgerK-Δ35) (Fig. 3). When the strains carrying any of these deletions were sporulated, the levels of gerKA mRNA were reduced ≥15-fold at all times tested, including times when wild-type strains gave maximum levels of gerK mRNA (data not shown).
gerK is a member only of the σG regulon.
The results presented above are consistent with gerK being a member of the σG regulon, as has been indicated previously by microarray technology (29, 33). The −10 and −35 sequences prior to the more upstream 5′ end of gerKA mRNA also are similar to those in σG promoters, with only one position in the −10 region of gerKA differing from the σG consensus −10 sequence (Fig. 3). The −10 and −35 sequences of the gerKA promoter are also very similar to those in σF promoters, which in turn are very similar to those of σG promoters (29, 33). However, a distinguishing feature of σF promoters is a G residue three residues upstream of the most upstream nucleotide in the −10 region and, very often, a second G downstream and adjacent to the first one (Fig. 3). While the gerKA promoter does have two G residues upstream of the −10 region, these residues are 1 nt closer to the upstream end of the −10 region than in σF promoters. Thus, one would not expect the gerKA promoter to be σF dependent, and it is not (33). The gerB promoter lacks G residues upstream of the −10 region and is also not transcribed by RNA polymerase with σF (6, 33). In contrast, the gerA promoter has two G residues situated appropriately upstream of the −10 region and is recognized by both σF and σG (9, 30, 33).
The presence of two 5′ ends for gerKA mRNA in both sporulating cells and vegetative cells in which σG synthesis had been induced was surprising, and we cannot rule out the possibility that the more downstream 5′ end is the result of initiation of transcription at this A residue. However, gerKA mRNA with this latter 5′ end was only a small percentage of gerKA transcripts in vegetative cells in which σG synthesis was induced, and there are no consensus −10 and −35 sequences appropriately located upstream of this A residue. Consequently, we feel it is much more likely that the more downstream 5′ end is the result of some rapid cleavage of a transcript that initiated at the upstream G residue.
Relative levels of different germinant receptors.
The results in this communication also included the relative levels during sporulation of the mRNAs from the gerAA, gerBA, and gerKA genes (Table 2). These relative levels varied significantly in the two parental wild-type strains we analyzed for reasons that are not completely clear. The DNA sequences in the 50 bp upstream of the transcription start sites of these three operons are the same in strains PS832 and PY79 (and identical to those in the fully sequenced B. subtilis genome). However, it is possible that more upstream differences exist and are important in differences in the transcription in the two strains. An alternative possibility is that the activity of SpoVT is much lower in strain PS832 than in PY79, as the ratios of various mRNAs in strain PS832 are similar to those in the spoVT deletion in the PY79 background (Table 2). However, we have not analyzed these points further.
In strain PS832, where levels of the GerBA protein, and presumably all three proteins encoded by the gerB operon, are ∼25 molecules/spore (22), gerAA mRNA was the most abundant during sporulation. Levels of protein encoded by the gerA, gerB, and gerK operons will be dependent not only on the relative levels of the resultant polycistronic mRNAs but also on the rate of translation, in particular the rate of initiation of translation of the first open reading frame (ORF), since there is almost certainly translational coupling (15) in these polycistronic mRNAs. While the relative rates of initiation of translation of the gerAA, gerBA, and gerKA ORFs are not known, the spacing between the end of the ribosome-binding site (rbs) and the translation initiation codon in these mRNAs is near optimal for B. subtilis genes (Fig. 4) (8, 32). However, the rbss for these ORFs, in particular for gerKA mRNA, are far from optimal, and the initiation codon for gerAA is TTG rather than the preferred ATG in gerBA and gerKA (Fig. 4) (8, 32). Therefore, rates of initiation of translation of mRNAs from all three operons will likely be low (8, 32), and thus levels of the proteins encoded by these operons will also be low. Consequently, it appears most likely that levels of the GerA and GerK receptors in spores will be low, in the range of those for the GerB receptor (22), at 10 to 100 molecules per spore.
FIG. 4.
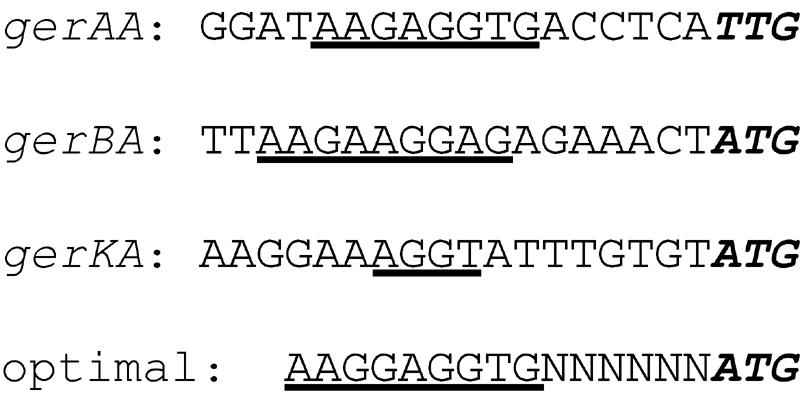
DNA sequences upstream of the translation start sites of the gerAA, gerBA, and gerKA cistrons. The sequences shown are from strain PS832 (wild type) determined in this work; these are identical to those in strain PY79 (wild type). The translation initiation codons are in boldface italics, and each rbs is underlined. The optimal rbs sequence, the optimal spacing between the rbs and translation initiation codon, and the optimal initiation codon are shown below the sequence and are taken from reference 29. N denotes any nucleotide.
Reasons for and significance of changes in mRNA levels after σG induction in vegetative cells and in sporulation.
There are two other observations of note in this work. First, the levels of the gerAA, gerBA, and gerKA mRNAs not only increased in sporulation or after induction of σG synthesis in vegetative cells but also then decreased rapidly. While the reason for the increases in the levels of these mRNAs is almost certainly the generation of active σG, the reason for the subsequent decrease in these mRNA levels is less clear. Presumably, these mRNAs are degraded rapidly, as are most bacterial mRNAs, and thus a likely reason for the decline in their levels is the loss of functional σG, although there are certainly other possible explanations. Why loss of σG might take place either late in sporulation or after induction of σG synthesis in vegetative cells is not clear. However, the loss in functional σG must take place in the developing spore, since σG-dependent genes are not expressed early in spore outgrowth (9, 14, 31). Similarly, while the level of β-galactosidase from lacZ fusions to a number of σG-dependent genes increases rapidly after induction of σG synthesis in vegetative cells, ∼3 h after induction the levels of β-galactosidase do not increase further (6, 9, 24, 31), even though the inducer IPTG should still be present. This latter finding is certainly consistent with levels of mRNAs for these σG-dependent lacZ fusions decreasing markedly 2 to 3 h after induction of σG synthesis. Clearly, the mechanism of loss in σG function in sporulating or induced vegetative cells is a subject worth further investigation.
The second surprising result from this work was the appearance of two peaks in levels not only of gerKA mRNA during sporulation but in levels of mRNAs from other known σG-dependent genes tested as well. The timing of the appearance of the first peak in the levels of these mRNAs corresponds well to the timing of synthesis of proteins encoded by these operons or genes as measured either directly or using various lacZ fusions (6, 9, 14, 30, 31). However, the biological significance of the second peak in the levels of these mRNAs is not clear. It seems almost certain that the second peak in levels of gerKA and the other mRNAs analyzed is due to σG-dependent transcription, since it was abolished in a sigG mutant, was increased in a spoVT strain, and was abolished by deletion of specific σG promoter elements upstream of gerKA. However, the second peak in the levels of these mRNAs appears well after expression of the encoded proteins in the forespore is thought to take place, when energy metabolism in the developing forespore is close to shutting down, and when forespore ATP levels have fallen dramatically (6, 9, 14, 28). While the expression of at least one σG-dependent gene is delayed compared to that of other σG-dependent genes, this delay is at most only ∼1 h, not the ∼5 h delay before appearance of the second peak in σG-dependent mRNA levels seen in the current work (24). Indeed, we do not know if the σG-dependent mRNAs that comprise this second peak are even synthesized in the forespore, as perhaps they are synthesized in the mother cell. In sum, the significance of this second peak of σG-dependent gene expression late in sporulation and how this expression is triggered and then stopped are unclear and are matters for further study.
Acknowledgments
This work was supported by a grant from the National Institutes of Health (GM 19698).
REFERENCES
- 1.Atluri, S., K. Ragkousi, D. E. Cortezzo, and P. Setlow. 2006. Cooperativity between different nutrient receptors in germination of spores of Bacillus subtilis and reduction of this cooperativity by alterations in the GerB receptor. J. Bacteriol. 188:28-36. [DOI] [PMC free article] [PubMed] [Google Scholar]
- 2.Bagyan, I., L. Casillas-Martinez, and P. Setlow. 1998. The katX gene, which codes for the catalase in spores of Bacillus subtilis, is a forespore-specific gene controlled by σF, and KatX is essential for hydrogen peroxide resistance of the germinating spore. J. Bacteriol. 180:2057-2062. [DOI] [PMC free article] [PubMed] [Google Scholar]
- 3.Bagyan, I., J. Hobot, and S. Cutting. 1996. A compartmentalized regulator of developmental gene expression in Bacillus subtilis. J. Bacteriol. 178:4500-4507. [DOI] [PMC free article] [PubMed] [Google Scholar]
- 4.Bagyan, I., M. Noback, S. Bron, M. Paidungat, and P. Setlow. 1998. Characterization of yhcN, a new forespore-specific gene of Bacillus subtilis. Gene 212:179-188. [DOI] [PubMed] [Google Scholar]
- 5.Cat Dong, T., S. M. Cutting, and R. J. Lewis. 2004. DNA-binding studies on the Bacillus subtilis transcriptional regulator and AbrB homolog SpoVT. FEMS Microbiol. Lett. 233:247-256. [DOI] [PubMed] [Google Scholar]
- 6.Corfe, B. M., A. Moir, D. L. Popham, and P. Setlow. 1994. Analysis of the expression and regulation of the gerB spore germination operon of Bacillus subtilis. Microbiology 140:3079-3083. [DOI] [PubMed] [Google Scholar]
- 7.Errington, J. 1993. Bacillus subtilis sporulation: regulation of gene expression and control of morphogenesis. Microbiol. Rev. 57:1-33. [DOI] [PMC free article] [PubMed] [Google Scholar]
- 8.Farwell, M. A., M. W. Roberts, and J. C. Rabinowitz. 1992. The effect of ribosomal protein S1 from Escherichia coli and Micrococcus luteus on protein synthesis in vitro by E. coli and Bacillus subtilis. Mol. Microbiol. 6:3375-3383. [DOI] [PubMed] [Google Scholar]
- 9.Feavers, I. M., J. Foulkes, B. Setlow, D. Sun, W. L. Nicholson, P. Setlow, and A. Moir. 1990. The regulation of transcription of the gerA spore germination operon of Bacillus subtilis. Mol. Microbiol. 4:275-282. [DOI] [PubMed] [Google Scholar]
- 10.Hudson, K. D., B. M. Corfe, E. H. Kemp, I. M. Feavers, P. J. Coote, and A. Moir. 2001. Localization of GerAA and GerAC germination proteins in the Bacillus subtilis spore. J. Bacteriol. 183:4317-4322. [DOI] [PMC free article] [PubMed] [Google Scholar]
- 11.Igarashi, T., and P. Setlow. 2005. Interaction between individual components of the GerA and GerB nutrient receptors that trigger germination of Bacillus subtilis spores. J. Bacteriol. 187:2513-2518. [DOI] [PMC free article] [PubMed] [Google Scholar]
- 12.Kennedy, M. J., S. L. Reader, and L. M. Swierczynski. 1994. Preservation records of microorganisms: evidence of the tenacity of life. Microbiology 140:2513-2529. [DOI] [PubMed] [Google Scholar]
- 13.Leighton, T. J., and R. H. Doi. 1971. The stability of messenger ribonucleic acid during sporulation in Bacillus subtilis. J. Biol. Chem. 246:3189-3195. [PubMed] [Google Scholar]
- 14.Mason, J. M., R. H. Hackett, and P. Setlow. 1988. Regulation of expression of genes coding for small, acid-soluble proteins of Bacillus subtilis spores: studies using lacZ gene fusions. J. Bacteriol. 170:239-244. [DOI] [PMC free article] [PubMed] [Google Scholar]
- 15.McCarthy, J. E. G., and C. Gualzeri. 1990. Translational control of prokaryotic gene expression. Trends Genet. 6:78-85. [DOI] [PubMed] [Google Scholar]
- 16.Moir, A., B. M. Corfe, and J. Behravan. 2002. Spore germination. Cell. Mol. Life Sci. 59:403-409. [DOI] [PMC free article] [PubMed] [Google Scholar]
- 17.Nicholson, W. L., N. Munakata, G. Horneck, H. J. Melosh, and P. Setlow. 2000. Resistance of Bacillus endospores to extreme terrestrial and extraterrestrial environments. Microbiol. Mol. Biol. Rev. 64:548-572. [DOI] [PMC free article] [PubMed] [Google Scholar]
- 18.Nicholson, W. L., and P. Setlow. 1990. Sporulation, germination and outgrowth, p. 391-450. In C. R. Harwood and S. M. Cutting (ed.), Molecular biological methods for Bacillus. John Wiley & Sons Ltd., Chichester, England.
- 19.Paidhungat, M., B. Setlow, A. Driks, and P. Setlow. 2000. Characterization of spores of Bacillus subtilis which lack dipicolinic acid. J. Bacteriol. 182:5505-5512. [DOI] [PMC free article] [PubMed] [Google Scholar]
- 20.Paidhungat, M., and P. Setlow. 1999. Isolation and characterization of mutations in Bacillus subtilis that allow spore germination in the novel germinant d-alanine. J. Bacteriol. 181:3341-3350. [DOI] [PMC free article] [PubMed] [Google Scholar]
- 21.Paidhungat, M., and P. Setlow. 2000. Role of Ger proteins in nutrient and nonnutrient triggering of spore germination in Bacillus subtilis. J. Bacteriol. 182:2513-2519. [DOI] [PMC free article] [PubMed] [Google Scholar]
- 22.Paidhungat, M., and P. Setlow. 2001. Localization of a germinant receptor protein (GerBA) to the inner membrane of Bacillus subtilis spores. J. Bacteriol. 183:3982-3990. [DOI] [PMC free article] [PubMed] [Google Scholar]
- 23.Paidhungat, M., and P. Setlow. 2002. Spore germination and outgrowth, p. 537-548. In J. A. Hoch, R. Losick and A. L. Sonenshein (ed.), Bacillus subtilis and its relatives: from genes to cells. ASM Press, Washington, D.C.
- 24.Panzer, S., R. Losick, D. Sun, and P. Setlow. 1989. Evidence for an additional temporal class of gene expression in the forespore compartment of sporulating Bacillus subtilis. J. Bacteriol. 171:561-564. [DOI] [PMC free article] [PubMed] [Google Scholar]
- 25.Schaeffer, P., J. Millet, and J.-P. Aubert. 1965. Catabolite repression of bacterial sporulation. Proc. Natl. Acad. Sci. USA 54:704-711. [DOI] [PMC free article] [PubMed] [Google Scholar]
- 26.Setlow, P. 2003. Spore germination. Curr. Opin. Microbiol. 6:550-556. [DOI] [PubMed] [Google Scholar]
- 27.Setlow, P. Spores of Bacillus subtilis: their resistance to radiation, heat and chemicals. J. Appl. Microbiol., in press. [DOI] [PubMed]
- 28.Singh, R. P., B. Setlow, and P. Setlow. 1977. Levels of small molecules and enzymes in the mother cell compartment and the forespore of sporulating Bacillus megaterium. J. Bacteriol. 130:1130-1138. [DOI] [PMC free article] [PubMed] [Google Scholar]
- 29.Steil, L., M. Serrano, A. O. Henriques, and U. Völker. 2005. Genome-wide analysis of temporally regulated and compartment-specific gene expression in sporulating cells of Bacillus subtilis. Microbiology 151:399-420. [DOI] [PubMed] [Google Scholar]
- 30.Sun, D., P. Fajardo-Cavazos, M. D. Sussman, F. Tovar-Rojo, R.-M. Cabrera-Martinez, and P. Setlow. 1991. Analysis of the effect of chromosome location of Bacillus subtilis forespore genes on their spo gene dependence and transcription by EσF: identification of features of good EσF-dependent promoters J. Bacteriol. 173:7867-7874. [DOI] [PMC free article] [PubMed] [Google Scholar]
- 31.Sun, D., P. Stragier, and P. Setlow. 1989. Identification of a new σ-factor involved in compartmentalized gene expression during sporulation of Bacillus subtilis. Genes Dev. 3:141-149. [DOI] [PubMed] [Google Scholar]
- 32.Vellanoweth, R. L., and J. C. Rabinowitz. 1992. The influence of ribosome-binding-site elements on translational efficiency in Bacillus subtilis and Escherichia coli in vivo. Mol. Microbiol. 6:1105-1114. [DOI] [PubMed] [Google Scholar]
- 33.Wang, S., B. Setlow, E. M. Conlon, J. L. Lyons, D. Imamura, T. Sato, P. Setlow, R. Losick, and P. Eichenberger. The forespore line of gene expression in Bacillus subtilis. J. Mol. Biol., in press. [DOI] [PubMed]
- 34.Youngman, P., J. Perkins, and R. Losick. 1984. Construction of a cloning site near one end of Tn917 into which foreign DNA may be inserted without affecting transposition in Bacillus subtilis or expression of the transposon-borne erm gene. Plasmid 12:1-9. [DOI] [PubMed] [Google Scholar]