Abstract
The photoreaction kinetics of the BLUF domain of AppA5-125 was studied by monitoring time-dependence of an apparent diffusion coefficient (D) using the pulsed laser-induced transient grating technique. It was found that D of the photoproduct is time-dependent. From the concentration dependence of the reaction rate, it was concluded that the BLUF domain of AppA forms a dimer upon the photoexcitation. Since AppA exists as a dimeric form in the ground state, this dimerization reaction indicates the tetramer formation in the signaling state. From the slope of the plot of observed rate constants (kobs) against the AppA concentration, the second order rate constant is determined to be ∼2.5 × 10⁵ M−1s−1, which is ∼4 orders in magnitude lower than the diffusion controlled reaction. It indicates that a relative orientation of the protein molecules during the dimerization process causes additional constraints, which slow down the reaction rate.
INTRODUCTION
Recently, a novel family of blue-light photoreceptors, the BLUF domains (for sensors of blue light using FAD (1)) emerged burgeoning interest. These BLUF domains have been identified by sequence homology in purple photosynthetic bacteria, in cyanobacteria, and in the unicellular eukaryote, Euglena gracilis. They are involved in photophobic responses in E. gracilis (2), in transcriptional regulation in Rhodobacter sphaeroides (3), and in phototaxisin Synechocystis (4). Until now, five members of this family have been spectroscopically characterized: AppA from Rb. sphaeroides (3,5,6), YcgF from Escherichia coli (7), Slr1694 from Synechocystis PCC6803 (8), Tll0078 from Thermosynechococcus elongatus BP-1 (9), and the photoactivated adenylyl cyclase (PAC) from E. gracilis (2). Among them the BLUF domain of AppA from Rb. sphaeroides (3,5,6,10–16) has been extensively investigated with respect to both function and photochemistry. AppA is a light and redox-responding regulator of photosynthesis gene transcription in Rb. sphaeroides, where it can be found in two different functional forms (3). Under anaerobic low-light growth conditions, AppA is in a “dark-adapted” form, which is able to bind and inactivate the repressor PpsR, thus allowing the RNA polymerase to maximally transcribe photosynthesis genes. Under aerobic highlight conditions or under strong blue light illumination, FAD in AppA is photoexcited and AppA is transformed into a signaling state (“light-adapted” form) that is incapable of interacting with the photosynthesis repressor PpsR. Under these conditions, there is a maximal repression of the photosynthesis gene expression (3). However, despite of the efforts, the photochemistry and structural dynamics underlying the signaling state formation in the BLUF domain of AppA are still unclear.
The isolated N-terminal BLUF domain exhibits a photocycle identical to that observed with full-length AppA (5). Photoexcitation of AppA involving a singlet excited state in the flavin chromophore leads to formation of a red-shifted intermediate state (or signaling state) after 10 ns that slowly decays to the ground state with a lifetime of 30 min (11). The red shift was attributed to altered π-π stacking interactions between the isoalloxazine ring and a conserved tyrosine residue (Tyr-21) on the basis of an NMR analysis using wild-type AppA and some mutants (5). In addition, FTIR studies on Slr1694 and the BLUF domain of AppA indicated that the signaling state formation in the BLUF domain is accompanied by the rearrangements of hydrogen bonds between the C(4)=O group of the flavin and residues lining the chromophore binding pocket (8,12). Very recently, Dragnea et al. proposed that a temporary electron transfer occurs from conserved Tyr-21 to N5 of flavin in the BLUF domain of AppA and is a triggering event for subsequent hydrogen bond rearrangements (14). Furthermore, the dark state x-ray structure of the BLUF domain of AppA was determined at a 2.3 Å resolution (15) and it indicated that the BLUF domain of AppA forms the dimer in the crystal through the hydrophobic interactions of a β-sheet of two monomers. The hydrogen bond network and the overall protein topology of the BLUF domain (but not its sequence) bear some resemblances to the LOV (Light-Oxygen-Voltage sensing) domains, a subset of the PAS (Per-ARNT-Sim) domains widely involved in signaling. Nearly all residues are conserved in the BLUF domains surround the flavin chromophore, many of which are involved in an intricate hydrogen bond network (15).
There are several reports related to a structural change of AppA in the signaling state. FTIR, time-resolved fluorescence, and steady-state Raman studies indicated that the BLUF domain of AppA undergoes some structural changes upon blue light illumination (11,12,14). A size-exclusion chromatography study of full-length AppA suggested that the signaling state is accompanied by a conformational change that increases the Stokes radius and/or the aggregation state of the protein (3). Recently, it was established that the ground state of the BLUF domain of AppA exists as a dimer even in a very dilute solution (16). However, it was not clear whether the BLUF domain of AppA aggregated or not in the signaling state. There has been no report on dynamical behavior of AppA after the photoexcitation.
The kinetics of chemical reactions may be monitored by the transient absorption or time-resolved fluorescence techniques. Indeed, the transient absorption method was applied to the photoreaction of AppA, but a detailed study showed that the absorption detected signal indicated only the decay of the excited triplet state in a microsecond time range, not the other process, which may be expected for creating the signaling state. An inherent limitation of these techniques is that the signal appears only if a reaction induces some structural changes near the chromophore. If there is a very little change of the environment around the chromophore, these two techniques cannot detect the protein dynamics.
It was recently reported that the diffusion coefficient is a useful physical property to monitor the spectrally silent dynamics of structural changes or conformational changes (17–22). For monitoring the diffusion in time-domain, it was reported that the pulsed laser induced transient grating (TG) method is a powerful and suitable technique (17–22). In this study, we have investigated conformational changes or aggregation kinetics of this protein in the signaling state by the time-resolved TG technique. We found clear evidence for the tetramer formation of the photoexcited AppA for the first time. Not only that, the kinetics of the protein association was measured and the reaction mechanism is discussed.
EXPERIMENTAL PROCEDURES
The experimental setup and the principle of the TG measurement were similar to that reported previously (17–26). Briefly, a laser pulse from a dye laser (Lumomics, Ontario, Canada, HyperDye 300; wavelength = 465 nm) pumped by an excimer laser (Lambda Physik, Göttingen, Germany, XeCl operation; 308 nm) was used as an excitation beam and a diode laser (780 nm) was used as a probe beam. The excitation beam was split into two by a beam splitter and crossed inside a sample cell. The sample was photoexcited by the created interference pattern to induce the refractive index modulation in the sample. A part of the probe beam was diffracted by the modulation (TG signal). The signal was isolated from the excitation laser beam with a glass filter and a pinhole, as detected by a photomultiplier tube (Hamamatsu, R1477, Hamamatsu, Japan), and recorded by a digital oscilloscope. The spacing of the fringe was measured by the decay rate constant of the thermal grating signal from a calorimetric standard sample (bromocresol purple in water), which releases all the photon energy of the excitation as the thermal energy within a time response of our system. All measurements were carried out at room temperature.
Wild-type AppA(5-125) was expressed and purified essentially as described previously (13). Heterologous protein (over)production was performed in /E. coli/ M15 (pREP4), grown in production broth (PB; which contains 20 g L-1 tryptone, 10 g L-1 yeast extract, 5 g L−1 dextrose, 5 g L−1 NaCl, and 8.7 g L−1 K2HPO4, pH 7.0). Ampicillin and kanamycin were used at 100 and 50 μg mL−1, respectively. Before proceeding with purification, using nickel-affinity resin, cell-free extract was incubated for 1 h on ice, with a large molar excess of FAD. Purified protein was dialyzed to 10 mM Tris-HCl, pH 8.0, and stored at −20°C. Purity of the samples was checked by SDS-PAGE, using the PHAST system (Amersham Biosciences, Piscataway, NJ) and with UV/Vis spectroscopy. The flavin composition of the purified protein was determined by thin-layer chromatography (TLC) as described in (13).
PRINCIPLE AND THEORETICAL
Under weak diffraction conditions, the TG signal intensity (ITG) is proportional to the square of variations in the refractive index (δn) and in the absorbance. We can neglect the absorption term by selecting a probe wavelength at which the absorption change is sufficiently small. Then, the refractive index change consists of the following three components: temperature rise due to the released thermal energy (δnth, thermal grating), the molecular refractive index difference between the reactant and products due to the change of the absorption spectrum (δnpop, population grating), and the density change caused by the reaction volume (δnv, volume grating). We call the sum of δnpop and δnv the species grating (δnspe), because the time profiles of δnpop and δnv are identical for most cases. The TG signal intensity (ITG) is given by
 |
(1) |
where α is a constant representing the sensitivity of the system. If the thermal energy is released promptly, the thermal grating signal may be expressed by
 |
(2) |
where Dth is the thermal diffusivity and q is the grating wavenumber. We can separate the thermal contribution from the other two components by the time-resolved method (23–25). The key point of the separation is based on the fact that the thermal grating signal decays with a rate constant given by the thermal diffusivity (Dth) but the time development of the other signal is determined by the kinetics of the reaction and the molecular diffusion. Since the thermal diffusivity is usually 2 or 3 orders of magnitude larger than usual molecular diffusion coefficients in solution, the thermal component can be easily separated from the species grating signal. If we can neglect the reaction kinetics in the molecular diffusion kinetics, the time-dependence of δnspe is given by (17–22)
 |
(3) |
where δnR(>0) and δnP(>0) represent the refractive index changes by the reactant and product, respectively. DR and DP are the molecular diffusion coefficients of the reactant and product, respectively. The reaction kinetics can be separated from the diffusion process by measuring the TG signal at different q2, because the decay due to the diffusion process depends on q2, whereas the reaction kinetics should not.
When proteins are dimerized during the diffusion process, the apparent D is time dependent, and hence, the observed TG signal should be different from that predicted by Eq. 3. For analyzing the observed TG signal, we may use the following model:
 |
(Scheme 1) |
where A* indicates an intermediate created by the photoexcitation and the dimer is formed between this intermediate (A*) and the ground state protein (A) with a rate constant k. The time dependence of the spatial modulation of these species is given by the following rate equations:
 |
(4) |
 |
(5) |
 |
(6) |
where x is the coordinate along the grating wavevector, k is the reaction rate constant, and DR, DI, and DP denote the diffusion coefficients of the reactant, intermediate, and the product, respectively. Solving these equations under a condition that the concentration of A is sufficiently large so that it can be treated as a constant, we may find the time dependence of the TG signal as
 |
(7) |
where δn1, δn2 and δn3 are the refractive index of the ground state protein, the intermediate, and the product, respectively.
In this study, we found that DI is nearly equal to DR from a fact described below. By replacing DI by DR and k[A] by kobs, the above equation is expressed as
 |
(8) |
This functional form is the same as that calculated based on the two-state model used for detecting conformational changes of proteins (17,18,22).
RESULTS AND DISCUSSION
Time-dependent diffusion
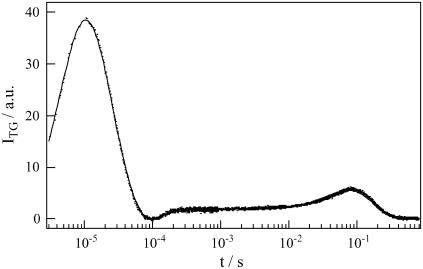
Fig. 1 represents the TG signal of AppA after the photoexcitation. The signal rose quickly with the time-response of our system (∼20 ns) and there appeared a weak slow rising component with a time constant of ∼3.4 μs. Measuring the TG signal at different q2, we found that this time constant of the rise component did not depend on q2. Hence the rising part of the TG signal represents the species grating signal, which reflects an intrinsic dynamics of the protein, not the diffusion. This species grating signal may be due to the volume change of the protein or absorption change of FAD. Recently, Gauden et al. (11) investigated the photocycle of AppA by the transient absorption and time-resolved fluorescence methods and found that FAD triplet state is formed at a low yield of ∼9% and decays to the ground state with a lifetime of 3 μs. Hence, we attributed the ∼3.4 μs-dynamics in the TG signal to the decay rate of the triplet state of FAD. After this species grating signal, the TG signal decayed to zero with a time constant of several microseconds, which depended on the grating conditions. This decay rate constant agreed well with Dthq2 at the experimental q2 determined by the thermal grating signal from the calorimetric reference sample. Hence, this was the thermal grating component created by the thermal energy due to the nonradiative transition from the excited state of FAD.
FIGURE 1.
Representative TG signal of the concentrated solution of AppA (0.95 mM) at q2 = 1.3 × 10¹¹m−2.
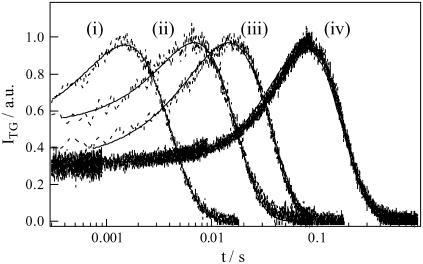
After the thermal grating signal decayed to zero, the signal rose again and finally it decayed to the baseline. This rise-decay component depended on q2 as shown in Fig. 2. This q2-dependence indicates that these components represent the diffusion processes. The sign of the preexponential factor can be determined without any ambiguity by using the fact that the sign of the thermal grating signal is negative (δnth<0). As the thermal grating signal reaches zero, the rise and decay parts of the diffusion signal represent the reactant and product diffusions, respectively. This rise-decay feature of the diffusion signal indicates that D of the parent and the product are different each other, and the product diffuses slower than reactant. We will explain the origin of the slower diffusion of the product in a latter section.
FIGURE 2.
Normalized TG signals of concentrated solution of BLUF domain of AppA (0.95 mM) at various q2 conditions. The q2 are i), 4.5 × 10¹² m−2, ii), 1.3 × 10¹² m−2, iii), 5.6 × 10¹¹ m−2, and iv), 1.3 × 10¹¹ m−2. The best fitted curve based on Eq. 3 is shown by the solid line.
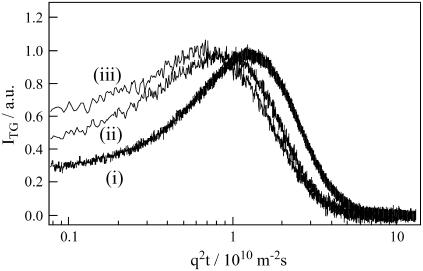
It is more interesting to note that not only the rate but also the temporal profile of the signal depends on q2. If D of the parent and the product are constants in time, and the product is created from the parent promptly, the profile should be expressed by Eq. 3. However, we found that this profile could not be fitted by the biexponential function. If the profile represents only the diffusion process, the time-dependence should be expressed by a combination of terms of exp(−Dq2t) (e.g., Eq. 3). In this case, if the signal measured at various q2 is plotted against q2t, the shape of the signals should be identical. However, the signals are totally different depending on the q2-value (Fig. 3). Therefore, the failure of the biexponential function cannot be explained by simply adding more diffusion terms. One explanation we can think from this fact is that the diffusion process is time-dependent (17,18,22). For analyzing the observed TG signal, a model that represents the time-dependent D (e.g., Eq. 8) should be used.
FIGURE 3.
TG signals of the BLUF domain of AppA (0.95 mM) at various q2 are plotted against q2t. The q2 values are i), 1.3 × 10¹¹ m−2, ii), 5.6 × 10¹¹ m−2, and iii), 4.5 × 10¹² m−2.
Origin of diffusion change
Since the theoretical equation based on the two-state model presented in the Principle and theoretical section contains many parameters, we have to know some parameters independently for a reliable determination of parameters from the fitting. For that purpose, we determined DR and DP without using the two-state model as follows. It should be mentioned that after the reaction (conformational change or aggregation) completes, D should be time-independent. Therefore, the temporal profile of the TG signal after this time should be expressed by a biexponential function (Eq. 3) and, from the rate constants, DR and DP can be determined.
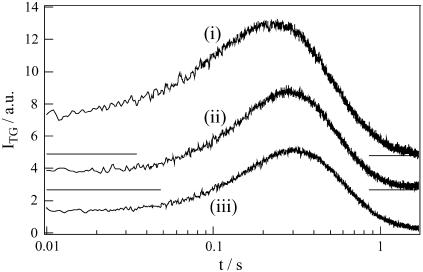
To perform this analysis, we measured the diffusion signal at a low q2 condition (3.9 × 10¹⁰ m−2: Fig. 4), and fitted the signal from 80 ms after the photoexcitation. Later we will see that this time is sufficiently slower that the time constant of the kinetics. We found that the temporal profile after this time can actually be fitted well by the biexponential function, and this fact ensures that D does not depend on time after 80 ms. From the biexponential fitting, DR and DP are determined to be (8.8 ± 0.4) × 10−11 m2s−1 and (7.2 ± 0.4) × 10−11 m2s−1, respectively. Therefore, we found that the product diffuses 1.22 times slower than the reactant.
FIGURE 4.
TG signals of the BLUF domain of AppA at various concentrations at low q2 (3.9 × 10¹⁰ m−2) condition. The concentrations are i), 0.95 mM, ii), 0.27 mM, and iii), 0.17 mM.
First, we compare DR with D of other proteins. The molecular mass of the BLUF domain of AppA is ∼15.5 kDa. D of a protein with a similar size, e.g., myoglobin (18 kDa) measured by the TG method is 10 × 10−11 m2s−1, which is larger than DR of AppA (27). We think that this difference in D reflects the dimeric form of AppA in solution (16). Indeed, D of Green fluorescent protein having a molecular mass of ∼30 kDa (about the same size as the dimer of AppA) was reported to be 8.7 ×10⁻¹¹ m2s−1 in water (28). The similar D to DR of AppA ensures the dimeric form of AppA. This is the first reported D of the ground and signaling states of the BLUF domain of AppA.
The significant difference in D between the reactant and product is very interesting. According to the Stokes-Einstein relationship, D is given by (29,30)
 |
(9) |
where kB, T, η, a, and r are Boltzmann constant, temperature, viscosity, a constant representing the boundary condition between the diffusing molecule and the solvent, and radius of the molecule, respectively. If the difference in D between the reactant and product is interpreted in terms of the difference in the molecular radius, the molecular volume of the product should be 1.9 times larger than that of the reactant and it is unreasonable to consider that the intrinsic molecular volume increases 1.9 times by a simple chemical reaction.
One possible explanation is the conformational change of the protein, which leads to increase the interaction between the solvent and the protein. For example, it was found that D of the LOV2 domain with the liker part of phototropin decreased 0.77 times by the product formation compared with D of the reactant, and this decrease in D was attributed to a strong interaction between the protein and solvent due to unfolding of the α-helix in the linker part in the product state (17). The BLUF domain of AppA consists of a five-stranded β-sheet, two α-helices on top of this, and the FAD chromophore anchored between these two α-helices (15). Some rearrangements of the hydrogen bonding between flavin to the conserved residues were observed after the photoexcitation (12,14).
Another possible explanation for the large reduction in D is the dimerization of the BLUF domain after the photoreaction. (Since the BLUF domain of AppA already exists as a dimer in the ground state even in a very diluted solution (15,16), which was confirmed by the TG measurement described above, the formation of the dimer in this case means the tetramer formation in the signaling state. Hereafter, we refer this process “dimerization”, because this process is a bimolecular reaction.) The 1.9 times increase of the molecular volume is a very reasonable value for this dimerization reaction.
To examine these possibilities, we measured the TG signal at various AppA concentrations. If the dimerization is the main cause of the difference in D, this reaction rate should be slower at a lower concentration. On the other hand, if a conformational change is responsible for the 1.22 times reduction in D in the signaling state, the temporal profile of the TG signal should not depend on concentration, besides the absolute intensity.
Under a low q2 condition (q2 = 3.9 × 10¹⁰ m−2), the temporal profile of the diffusion signal is relatively similar at any concentrations we used; i.e., all TG profiles in this timescale consist of the rise-decay component (Fig. 4). At this low q2, the diffusion peak can be reproduced by a biexponential function with DR = (8.8 ± 0.4) × 10−11 m2s−1 and DP = (7.2 ± 0.4) × 10−11 m2s−1) after 80 ms at any concentration. Therefore the final product should be the same at all concentrations after a sufficiently long time.
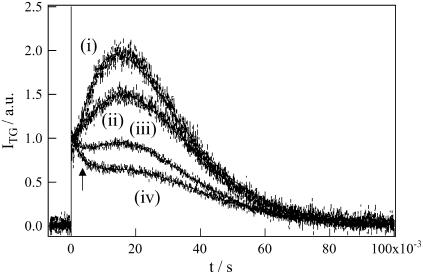
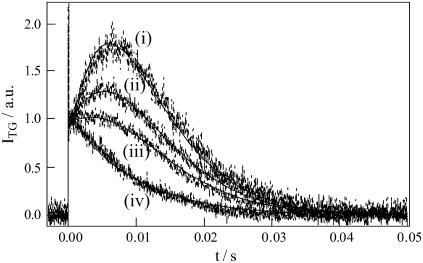
On the other hand, in a middle q2 condition (5.6 × 10¹¹ m−2), the temporal profile of diffusion signal depended on the concentration rather significantly (Fig. 5). In a fast timescale, the temporal profile of the TG signals changes much drastically with the concentration (Fig. 6). The signal became an approximately single exponential decay as the concentration decreased (Fig. 6). Considering that the diffusion peak arises due to the difference between DR and DP, one may understand that the nearly single exponential behavior indicates a small change in D in this time range. As DR and the final DP are always constant as shown above at low q2 experiment, the small change in D should be interpreted in terms of the slower rate of change in DP with decreasing the concentration. This concentration dependence of the TG profile and the 1.22 times decrease in D (i.e., ∼2 times increase in molecular volume) in the product state support the dimerization mechanism in the excited state of this protein.
FIGURE 5.
Concentration dependence of the TG signals of the BLUF domain of AppA at q2 = 5.6 × 10¹¹ m−2. The concentrations are i), 0.95 mM, ii), 0.38 mM, iii), 0.21 mM, and iv), 0.15 mM. The solid lines are best fitted curve fitted by Eq. 8 for i and ii; iii and iv are fitted by Eq. 8 and one additional diffusion component that corresponds to FAD diffusion (shown by an arrow).
FIGURE 6.
Concentration dependence of the TG signals of the BLUF domain of AppA at q2 = 1.3 × 10¹² m−2. The concentrations are i), 0.95 mM, ii), 0.48 mM, iii), 0.31 mM, and iv) 0.17 mM. The solid lines are the best fitted curve by Eq. 8.
There are two possibilities for the dimer formation mechanism. One possibility is that the photoexcited AppA (AppA*) is associated with the ground state AppA to yield the dimer (Scheme 2):
 |
(Scheme 2) |
In this case, if the concentration of AppA* is low enough compared to AppA, the rate equation is the same as that of the pseudo-first order rate equation and eventually, the temporal profile should be independent of the laser power. Secondly, if a photoexcited AppA is associated with another photoexcited AppA (AppA*),
 |
(Scheme 3) |
the rate equation becomes the second-order rate equation. In this case, the reaction rate depends on the concentration of the photoexcited protein; hence, the TG profile depends on the laser power.
We observed that the temporal profile of the TG signal is independent of the laser power; only the signal intensity increases with the increase in the laser power, but not the temporal shape. Therefore, we concluded that Scheme 2 is appropriate to describe the reaction. According to this scheme, the observed feature of the TG signal can be explained qualitatively as follows. Upon photoirradiation, this protein changes its conformation, and the dimerization reaction takes place. Since this dimerization occurs faster at a higher concentration, the biexponential feature is observed even at an early time range (i.e., under a high q2 condition). In a diluted solution, the dimerization process and the D change become slower, so that a single exponential like feature is observed in the fast timescale. This single exponential behavior provides us another important information; i.e., D of the initially created product is similar to DR (DI = DR in Eq. 7).
Kinetics of dimer formation
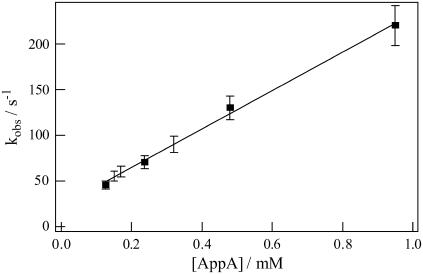
On the basis of the above observations, we should use Eq. 8 for the fitting of the TG signal. The adjustable parameter is the rate constant kobs and the refractive index change. The fitting is generally satisfactory (e.g., Figs. 5 and 6), and we determine kobs at all concentrations. For example, the time constant was 4.5 ms at 0.95 mM. (This time is sufficiently shorter than the time range we used for the biexponential fitting in the previous section (>80 ms).) The rate constant kobs decreased as the concentration decreased. From the slope of the plot of kobs versus concentration (Fig. 7) and a relation of kobs = k[AppA], we determined the second order rate constant, k, to be ∼2.5 × 10⁵ M−1s−1. Interestingly, this value is much smaller than that of a diffusion controlled reaction (∼109 M−1s−1) calculated by the Smolochowski-Einstein equation for a bimolecular reaction in solution (31). This difference indicates that the collision between two protein molecules is not the sole criterion for the aggregation process; i.e., their relative orientations dictate additional constraints, which slow down the rate of the reaction by four orders of magnitude.
FIGURE 7.
Plot of the observed rate constants (kobs) obtained from the fitting of the TG signals at different concentrations of AppA by Eq. 8 against the concentration.
We think that this photoinduced dimer finally dissociates to the original species, because the TG signal is reproducible when the repetition rate of the excitation is slow enough. This leads to the conclusion that there is no covalent bond formation in the aggregated state.
Previously, the kinetics of the photoreaction of AppA was studied by the transient absorption method (11). The results showed that, as long as the reaction was monitored by the absorption change, the signaling state was formed directly from the singlet excited state of FAD on a fast (<1 ns) timescale after blue light excitation (11). The fast formation of the signaling state suggested that there was no large difference in the structure between the ground state and the signaling state. Parallel to the formation of the signaling state, the FAD triplet state is formed with a low quantum yield. The triplet state decays to the ground state with a 3-μs time constant and the signaling state returned to the ground state in ∼30 min (11). In our TG signal, the signal rose quickly with the time response of our system (∼20 ns) and then the weak slow rising component appeared, which was attributed to the decay of the triplet state of FAD. The time constant of this triplet state decay is very close to that measured by the absorption detection (11). After this dynamics, even though the absorption does not change, we observed a new kinetics with a few milliseconds time constant as the diffusion change dynamics, which should be attributed to the dimerization reaction. Therefore, this dimerization reaction is spectrally silent dynamics and arises due to the protein-protein interaction. We suggest that this state is the signaling state of AppA.
Previously, it was reported that the dark-adapted wild-type AppA156 exhibited an elution profile of 35 kDa and light-adapted state exhibited an elution profile of 37 kDa by a gel chromatographic technique. It indicated that the light excitation of the chromophore caused a conformational change in AppA156, so that the Stokes radius increased, but any elution profile that corresponds to the dimer formation was not reported. It is difficult to specify the exact cause of the difference between this chromatographic result and this observation, because the experimental conditions were different. However, it should be noted that our TG technique monitors sensitively the refractive index change caused only by the creation of the photoexcited state, whereas the gel chromatography monitors all AppA proteins in the solution. It might be difficult to detect the dimer contribution among the whole proteins, unless the population of the dimer is dominant. This different sensitivity could be one possible reason of the different observations. Moreover, although covalently linked or stable noncovalent linked protein aggregates may be detected by a size exclusion liquid chromatography, a noncovalent protein aggregate that is formed by a weak hydrophobic or hydrogen bond interaction may not be detectable, because of a possible dissociation during the elution through the column (32).
As mentioned above, the dimerization kinetics was not detected by the absorption techniques. This spectrally silent feature means that the contact region in the aggregation complex is far away from the chromophore (FAD) region. In our construct of the BLUF domain, the residues 111–125 are not belong to the BLUF domain. Anderson et al. recently showed that the residues 120–129 have no ordered secondary structure but make extensive hydrogen bonds with the same sequence on another molecule in a dimer (15). Considering above facts we think that amino acids 111–125 are likely to be involved for the formation of the dimer. In other words, we may speculate that, if this domain is blocked by other domains in the full-length AppA, this dimerization dynamics may not occur. To fully understand the photoreceptor function of this protein, it may be necessary to extend this study to the full-length AppA or a mutant, Y21F, in which the light-induced structural changes are absent. These studies will be performed in future.
Finally, we mention about additional signal component, which was observed in some of our experiments. Sometimes, we observed one extra diffusion signal particularly in a diluted sample in an early time region (e.g., arrow in Fig. 5). The D-value of this component is ∼5.5 × 10⁻¹⁰ m2s−1. According to this D-value, we attribute the diffusing molecule to the FAD radical, which arises as a byproduct of the laser excitation. Very recently, it was reported that a long exposure (8 min) to a laser beam (∼2 μJ/mm2) resulted in flavin being liberated from the binding pocket and it was considered as a byproduct of the laser excitation (14). For a concentrated solution, we generally did not observe this component. Because the TG signal of a concentrated solution (0.95 mM) can be recorded at a low laser power (∼5 μJ/mm2), FAD may not be removed from the protein and does not exhibit any diffusion signal in the concentrated sample.
CONCLUSION
The kinetics of photoreaction of the BLUF domain of AppA5–125 is studied from a view point of diffusion coefficient (D) using the pulsed laser induced transient grating (TG) method. The temporal profile of the TG signals changed depending on the observation time, indicating that D of the product is time-dependent after the photoexcitation. We measured D of the ground and signaling states of AppA from the TG signal under a low q2 condition. The observed diffusion coefficients for the ground state and signaling state of AppA are (8.8 ± 0.4) × 10−11 m2s−1 and (7.2 ± 0.4) × 10−11 m2s−1, respectively. Comparing D of AppA with that of other proteins, we suggest that AppA form a dimer in the ground state. Moreover, the TG signal profile depended on the concentration drastically in particular on an early timescale. The observed TG signal could be well fitted by the dimerization model. The dimerization rate constant (kobs) decreases as the concentration decreases. From the plot of kobs against the concentration, the second order rate constant was determined to be ∼2.5 × 10⁵ M−1s−1. This value is lower than the diffusion controlled rate expected for a bimolecular association reaction with a steric factor of unity. The slower rate of aggregation is attributed to the orientational constraint of AppA during the formation of the tetramer. This study can be a demonstration showing that the diffusion measurement is a powerful way to monitor spectrally silent dynamics including the dimerization reaction.
Acknowledgments
This work is supported by Grant-in-Aid (Nos. 13853002 and 15076204) from the Ministry of Education, Science, Sports and Culture in Japan. P.H is thankful to 21COE for the financial support and Japan Society for the Promotion of Science for the postdoctoral fellowship.
References
- 1.van der Horst, M. A., and K. J. Hellingwerf. 2004. Photoreceptor proteins, “star actors of modern times”: a review of the functional dynamics in the structure of representative members of six different photoreceptor families. Acc. Chem. Res. 37:13–20. [DOI] [PubMed] [Google Scholar]
- 2.Iseki, M., S. Matsunaga, A. Murakami, K. Ohno, K. Shiga, K. Yoshida, M. Sugai, T. Takahashi, T. Hori, and M. Watanabe. 2002. A blue-light-activated adenylyl cyclase mediates photoavoidance in Euglena gracilis. Nature. 415:1047–1051. [DOI] [PubMed] [Google Scholar]
- 3.Masuda, S., and C. E. Bauer. 2002. AppA is a blue light photoreceptor that antirepresses photosynthesis gene expression in Rhodobacter sphaeroides. Cell. 110:613–623. [DOI] [PubMed] [Google Scholar]
- 4.Masuda, S., and T. A. Ono. 2004. Biochemical characterization of the major adenylyl cyclase, Cya1, in the cyanobacterium Synechocystis sp. PCC 6803. FEBS Lett. 577:255–258. [DOI] [PubMed] [Google Scholar]
- 5.Kraft, B. J., S. Masuda, J. Kikuchi, V. Dragnea, G. Tollin, J. M. Zaleski, and C. E. Bauer. 2003. Spectroscopic and mutational analysis of the blue-light photoreceptor AppA: a novel photocycle involving flavin stacking with an aromatic amino acid. Biochemistry. 42:6726–6734. [DOI] [PubMed] [Google Scholar]
- 6.Laan, W., M. A. van der Horst, I. H. van Stokkum, and K. J. Hellingwerf. 2003. Initial characterization of the primary photochemistry of AppA, a blue-light-using flavin adenine dinucleotide-domain containing transcriptional antirepressor protein from Rhodobacter sphaeroides: a key role for reversible intramolecular proton transfer from the flavin adenine dinucleotide chromophore to a conserved tyrosine? Photochem. Photobiol. 78:290–297. [DOI] [PubMed] [Google Scholar]
- 7.Rajagopal, S., J. M. Key, E. B. Purcell, D. J. Boerema, and K. Moffat. 2004. Purification and initial characterization of a putative blue light-regulated phosphodiesterase from Escherichia coli. Photochem. Photobiol. 80:542–547. [DOI] [PubMed] [Google Scholar]
- 8.Masuda, S., K. Hasegawa, A. Ishii, and T. A. Ono. 2004. Light induced structural changes in a putative blue-light receptor with a novel FAD binding fold sensor of blue-light using FAD (BLUF); Slr1694 of synechocystis sp. PCC6803. Biochemistry. 43:5304–5313. [DOI] [PubMed] [Google Scholar]
- 9.Fukushima, Y., K. Okajima, Y. Shibata, M. Ikeuchi, and S. Itoh. 2005. Primary intermediate in the photocycle of a blue-light sensory BLUF FAD-protein, Tll0078, of Thermosynechococcus elongatus BP-1. Biochemistry. 44:5149–5158. [DOI] [PubMed] [Google Scholar]
- 10.Braatsch, S., M. Gomelsky, S. Kuphal, and G. Klug. 2002. A single flavoprotein, AppA, integrates both redox and light signals in Rhodobacter sphaeroides. Mol. Microbiol. 45:827–836. [DOI] [PubMed] [Google Scholar]
- 11.Gauden, M., S. Yeremenko, W. Laan, I. H. van Stokkum, J. A. Ihalainen, R. van Grondelle, K. J. Hellingwerf, and J. T. Kennis. 2005. Photocycle of the flavin-binding photoreceptor AppA, a bacterial transcriptional antirepressor of photosynthesis genes. Biochemistry. 44:3653–3662. [DOI] [PubMed] [Google Scholar]
- 12.Masuda, S., K. Hasegawa, and T. A. Ono. 2005. Light-induced structural changes of apoprotein and chromophore in the sensor of blue light using FAD (BLUF) domain of AppA for a signaling state. Biochemistry. 44:1215–1224. [DOI] [PubMed] [Google Scholar]
- 13.Laan, W., T. Bednarz, J. Heberle, and K. J. Hellingwerf. 2004. Chromophore composition of a heterologously expressed BLUFdomain. Photochem. Photobiol. Sci. 3:1011–1016. [DOI] [PubMed] [Google Scholar]
- 14.Dragnea, V., M. Waegele, S. Balascuta, C. Bauer, and B. Dragnea. 2005. Time-resolved spectroscopic studies of the AppA blue-light receptor BLUF domain from Rhodobacter sphaeroides. Biochemistry. 44:15978–15985. [DOI] [PMC free article] [PubMed] [Google Scholar]
- 15.Anderson, S., V. Dragnea, S. Masuda, J. Ybe, K. Moffat, and C. Bauer. 2005. Structure of a novel photoreceptor, the BLUF domain of AppA from Rhodobacter sphaeroides. Biochemistry. 44:7998–8005. [DOI] [PMC free article] [PubMed] [Google Scholar]
- 16.Laan, W., M. Gauden, S. Yeremenko, R. van Grondelle, J. T. M. Kennis, and K. J. Hellingwerf. 2006. On the mechanism of activation of the BLUF domain of AppA. Biochemistry. 45:51–60. [DOI] [PubMed] [Google Scholar]
- 17.Eitoku, T., Y. Nakasone, D. Matsuoka, S. Tokutomi, and M. Terazima. 2005. Conformational dynamics of phototropin 2 LOV2 domain with the linker upon photoexcitation. J. Am. Chem. Soc. 127:13238–13244. [DOI] [PubMed] [Google Scholar]
- 18.Nishida, S., T. Nada, and M. Terazima. 2005. Hydrogen bonding dynamics during protein folding of reduced cytochrome c: temperature and denaturant concentration dependence. Biophys. J. 89:2004–2010. [DOI] [PMC free article] [PubMed] [Google Scholar]
- 19.Inoue, K., N. Baden, and M. Terazima. 2005. Diffusion coefficient and the secondary structure of Poly-L-glutamic acid in aqueous solution. J. Phys. Chem. B. 109:22623–22628. [DOI] [PubMed] [Google Scholar]
- 20.Inoue, K., J. Sasaki, M. Morisaki, F. Tokunaga, and M. Terazima. 2004. Time-resolved detection of sensory rhodopsin II-transducer interaction. Biophys. J. 87:2587–2597. [DOI] [PMC free article] [PubMed] [Google Scholar]
- 21.Nishihara, Y., M. Sakakura, Y. Kimura, and M. Terazima. 2004. The escape process of carbon monoxide from myoglobin to solution at physiological temperature. J. Am. Chem. Soc. 126:11877–11888. [DOI] [PubMed] [Google Scholar]
- 22.Nishida, S., T. Nada, and M. Terazima. 2004. Kinetics of intermolecular interaction during protein folding of reduced cytochrome c. Biophys. J. 87:2663–2675. [DOI] [PMC free article] [PubMed] [Google Scholar]
- 23.Terazima, M. 2002. Molecular volume and enthalpy changes associated with irreversible photoreactions. J. Photochem. Photobiol. C. 3:81–108. [Google Scholar]
- 24.Takeshita, K., N. Hirota, Y. Imamoto, M. Kataoka, F. Tokunaga, and M. Terazima. 2000. Temperature-dependent volume change of the initial step of the photoreaction of photoactive yellow protein (PYP) studied by transient grating. J. Am. Chem. Soc. 122:8524–8528. [Google Scholar]
- 25.Hara, T., N. Hirota, and M. Terazima. 1996. New application of the transient grating method to a photochemical reaction: the enthalpy, reaction volume change, and partial molar volume measurements. J. Phys. Chem. 100:10194–10200. [Google Scholar]
- 26.Terazima, M., T. Hara, and N. Hirota. 1995. Reaction volume and enthalpy changes in photochemical reaction detected by the transient grating method; photodissociation of diphenylcyclopropenone. Chem. Phys. Lett. 246:577–582. [Google Scholar]
- 27.Baden, N., and M. Terazima. 2004. A novel method for measurement of diffusion coefficients of proteins and DNA in solution. Chem. Phys. Lett. 393:539–545. [Google Scholar]
- 28.Swaminathan, R., C. P. Hoang, and A. S. Verkman. 1997. Photochemical properties of green fluorescent protein GFP-S65T in solution and transfected CHO cells: analysis of cytoplasmic viscosity by GFP translational and rotational diffusion. Biophys. J. 72:1900–1907. [DOI] [PMC free article] [PubMed] [Google Scholar]
- 29.Cussler, E. L. 1984. Diffusion, Mass Transfer in Fluid Systems. Cambridge University Press, Cambridge, UK.
- 30.Tyrrell, H. J. V., and K. R. Harris. 1984. Diffusion in Liquids: A Theoretical and Experimental Study. Butterworths, London.
- 31.Smoluchowski, M. 1917. Versuch einer mathematischen Theorie der Koagulationskinetik kolloider Lösungen. Z. Physik. Chem. Leipzig. 92:129–168. [Google Scholar]
- 32.Patapoff, T. W., R. J. Mrsny, and W. A. Lee. 1993. The application of size exclusion chromatography and computer simulation to study the thermodynamic and kinetic parameters for short-lived dissociable protein aggregates. Anal. Biochem. 212:71–78. [DOI] [PubMed] [Google Scholar]


