

Abstract
Photochemical reaction of a plant blue-light photoreceptor, Arabidopsis phototropin 1-LOV (light-oxygen-voltage sensing) domain 2, was studied with a view to the diffusion coefficients (D) using the pulsed-laser-induced transient grating method. Although the reaction dynamics completes at a rate of several microseconds as long as it is monitored by the absorption change, the diffusion coefficient was found to be time-dependent in a time range of submilliseconds to seconds. The observed signal can be analyzed by the two-state model, which includes the D-value decrease from D of the reactant (9.8 ± 0.4) × 10−11 m2/s to D of the product (8.0 ± 0.4) × 10−11 m2/s. The D-value of the reactant implies that the dominant form in the ground state of phototropin 1 LOV2 is the monomeric form in a concentration range of 50–200 μM. According to the Stokes-Einstein relationship, the D-change can be explained by a volume increase of 1.8 times. Furthermore, the rate of the D-change was roughly proportional to the concentration of the sample. These two observations indicate that the LOV2 domain transiently forms a dimer upon photoexcitation. When the sample concentration is increased (>180 μM), a new signal component appears within a few milliseconds. This signal represents a D increase from 8.0 × 10⁻¹¹ m2/s to 9.8 × 10⁻¹¹ m2/s with a time constant of 300 μs. The completely opposite D-change from that observed in a lower concentration, as well as the concentration dependence, implies that a dimer is formed in the ground state in a higher concentration range, even though the fraction of the dimer is still minor in this range. This dimer is photodissociated, with a time constant of 300 μs. This research clearly shows that the time-resolved diffusion measurement is a very powerful tool for detecting spectrally silent association/dissociation processes during chemical reactions. The photoreaction of the LOV2 domain is discussed.
INTRODUCTION
Protein association and/or dissociation are key reactions in regulating the molecular processes relating to a variety of biological functions, such as gene transcription, signal reception, or signal transduction. Association or dissociation reactions of small molecules with an ultraviolet-visible absorbing residue(s) can be monitored by their absorption spectral changes associated with the concentration variation or photochemical reactions, as demonstrated extensively (1). The kinetics of such reactions has been traced by a transient absorption spectroscopy. However, the absorption spectra of chromoproteins that have much higher molecular masses, are rather insensitive to the association/dissociation processes. In such cases, detection of these reactions becomes difficult, particularly when they are transient. We here propose a method to monitor the dynamics of transient association/dissociation processes of a protein reaction based on the time-resolved measurement of diffusion coefficient (D) using the pulsed-laser-induced transient grating (TG) method. We applied this technique to polypeptides containing a LOV (light-oxygen-voltage-sensing) domain of Arabidopsis phototropin 1 (phot1) to figure out the molecular events during the photochemical reaction.
Phototropin (phot) is a major member of the blue-light receptors in plants. These receptors bind a flavin mononucleotide noncovalently as a chromophore (2–6), and are involved in the photoregulation of phototropism, chloroplast relocations, and stomatal opening, all of which play important roles in the fine-tuning of photosynthetic activities. In Arabidopsis, there are two types of phot, phot1 and phot2, both of which have two LOV domains (LOV1 and LOV2) and a serine/threonine kinase domain in the N- and the C-terminal halves, respectively, and a linker connecting the LOV2 and kinase domains. LOV domains form a subset of a PAS (Per-ARNT-Sim) family that contributes to protein-protein interactions. Phot is thought to be a blue-light-regulated kinase in which two LOV domains play different roles. LOV2 acts as the main molecular switch for light regulation of kinase in both in vivo autophosphorylation and in vitro substrate phosphorylation (7). LOV1, on the other hand, plays only a small role in the switching but a larger role in attenuating the light sensitivity of the light regulation by LOV2 (7), although the photoreactions are the same between the two LOV domains. Since the photoreaction of flavin-type photoreceptors has different molecular processes and mechanisms from those of the photoreceptors having isomerizable chromophores, such as rhodopsin or bacteriorhodopsin, the studies on phot have been attracting many researchers recently.
Primary processes during the photoreception of phot have been studied mainly by the transient absorption method (8–11). Upon photoexcitation, the ground state of the LOV domains (D447) undergoes cyclic reactions comprising a triplet state (L660) formation, a second intermediate (S390) formation (12,13), and reversion to the ground state with from many seconds to minutes (14). In the S390 state, the thiol group of a conserved cysteine in the LOV domains forms an adduct with a C(4a) of the isoalloxazine ring in the flavin mononucleotide, which is thought to be a signaling state. The changes in the chromophore should be transferred to the kinase domain to regulate the kinase activity via conformational changes in the protein moiety. However, x-ray crystallographic study on LOV2 of Adiantum phytochrome 3, as well as crystallographic and Fourier transfer infrared (FTIR) studies on LOV1 of Chlamydomonas, showed only small conformational changes limited to the area near the chromophore (15–18). In contrast, FTIR studies on the photoreaction in the LOV1 and the LOV2 domains of Adiantum phytochrome 3 in the hydrated films detected conformational changes in the secondary structures in the backbones of the amino acid chains (19). Furthermore, NMR and small-angle x-ray scattering studies reported conformational changes in the linker (20–22). Recently, we found, by monitoring the time dependence of D using the TG method, that a large conformational change is induced in the linker of Arabidopsis phot2-LOV2 with a lifetime of 2 ms. The results indicated the presence of a “dark” intermediate (T390) after the formation of S390 during the photocycle of phot2 (23) and clearly demonstrated that D is a useful property for detecting spectrally silent dynamics.
It would be interesting and important to study the photoreaction dynamics of another phot, phot1, for revealing the reaction mechanisms of the phototropins. In our initial research, we investigated the photoreaction kinetics of Arabidopsis phot1 polypeptide containing the LOV2 domain without the linker (phot1-LOV2) by the time-resolved TG method. In contrast to that of phot2-LOV2, temporal profiles of the TG signal were sensitive to the grating wavenumber (q2) as well as the concentration of the sample. Dependence on q2 was interpreted in terms of the temporal variation of the D-value of the photoproduct. Analyses of the concentration dependence of TG signals of phot1-LOV2 solutions showed that the time-dependent D-change of the photoproduct can be interpreted as the dimerization process of the monomeric polypeptide. Furthermore, it was found that phot1-LOV2 in the ground state forms a dimer gradually with increasing concentrations, and this dimer dissociates upon photoreaction with a time constant of 300 μs. The molecular mechanism underlying these light-induced oligomeric structural changes of the phot1-LOV2 polypeptides and the usefulness of the TG method in these analyses are discussed. As far as we are aware, this is the first observation of spectrally silent transient light-induced dimer formation or light-induced dissociation reaction of any protein.
EXPERIMENTAL PROCEDURE
Measurement
The experimental setup was similar to that reported previously (23–29). Briefly, a laser pulse from a dye laser (HyperDye 300, wavelength 465 nm; Lumonics, Ontario, Canada) pumped by an excimer laser (XeCl operation, 308 nm; Lambda Physik, Göttingen, Germany) was used as an excitation beam and a diode laser (835 nm) as a probe beam. The excitation beam was split in two by a beam splitter and crossed inside a sample cell. The sample was photoexcited by the created interference pattern to induce the refractive index modulation in the sample. The TG signal was isolated from the excitation laser beam with a glass filter and a pinhole, and detected by a photomultiplier tube (Hamamatsu R1477, Hamamatsu, Japan). The spacing of the fringe was measured by the decay-rate constant of the thermal grating signal from a calorimetric standard sample (bromocresol purple), which releases all the photon energy of the excitation as thermal energy within the time range of response of our system. Repetition rate of the excitation was 0.01 Hz to avoid possible multiexcitation. All measurements were carried out at 21°C.
Preparation of recombinant LOV polypeptides
Arabidopsis phot1-LOV2 (449E-586R) polypeptide was prepared by overexpression systems with Escherichia coli as described in Nakasako et al. (22). The phot1-LOV2 polypeptide has extensions of additional amino acid residues to the LOV core (475K-578G) at both the N- and C-terminal ends to make it stable in solution, since the LOV2 core sample forms aggregates when it is left for long times at ambient temperature. In addition, the polypeptides have an extension sequence (Gly-Ser-Pro-Glu-Phe) coming from the expression vector at the N-terminus. The GST-tag-cleaved polypeptide was purified by gel chromatography with Sephacryl S-100 HR (Pharmacia, Peapack, NJ) in a buffer solution containing 100 mM NaCl, 25 mM Tris-HCl, and 1 mM Na2EDTA (pH 7.8). The purified polypeptide showed a single band upon Coomassie Brilliant Blue staining after sodium dodecyl sulfate polyacrylamide gel electrophoresis. Molecular mass and purity of the recombinant polypeptide sample were also examined by time-of-flight mass spectrometry with an AXIMA-QIT instrument (Shimadzu, Kyoto, Japan). The purified LOV polypeptide in the above buffer solution was concentrated by ultrafiltration and then used for the TG measurements. The TG signal was measured mostly at the concentration of 50 μM (0.9 mg/ml). Dependence of TG on the concentration was examined in the concentration range from 40 to 300 μM.
Principle and theory
The principles of the TG measurement and analysis of the signal based on the time-dependent D have been reported previously (23,27–29). Briefly, a photoinduced reaction is initiated by the spatially modulated light intensity that is produced by the interference of two excitation light waves (23–29). The sinusoidal modulations of the concentrations of the reactant and the product lead to sinusoidal modulation in the refractive index (δn). This modulation can be monitored by the diffraction of a probe beam (TG signal). In this experiment, the refractive index change mainly comes from the thermal energy releasing (thermal grating, δnth(t)) and created (or depleted) chemical species (species grating) by the photoreaction. The species-grating signal intensity is given by the difference of the refractive index changes due to the reactant (δnR) and the product (δnP). The total TG signal (ITG(t)) is expressed as
 |
(1) |
where α is a constant. It should be noted that the “product” in this equation does not necessarily mean the final product, but can be any molecule produced from the reactant at the observation time. The sign of the δnR(>0) term is negative, because the depletion of the reactant causes the 180° shift of the phase of spatial concentration modulation of the reactant from that of the product. The sign can be used for the assignment of the chemical species. The temporal profiles of the thermal grating and species grating can be calculated by diffusion equations. The thermal grating, δnth(t), decays with a rate constant of Dthq2 (23–29),
 |
(2) |
where  is the initial refractive index change of the thermal grating, Dth is the thermal diffusivity, and q is the grating wavenumber. When the molecular diffusion coefficient (D) is time-independent, the temporal profile of the species grating signal can be calculated by the molecular diffusion equation and we may find that the q-Fourier component of the concentration decays with a rate constant of Dq2 for the reactant and the product. Hence, the time development of the TG signal for describing the molecular diffusion part can be expressed by (23–29),
 |
(3) |
where DR and DP are diffusion coefficients of the reactant and the product, respectively. Furthermore,  and
and  are the initial refractive index changes due to changes in the reactant and the product concentrations, respectively, by the reaction.
When apparent D is time-dependent, the observed TG signal should be calculated from a diffusion equation with a concentration change term. Describing a reaction by the two-state model,
 |
(Scheme 1) |
where R, I, P, and k represent, respectively, the reactant, an intermediate species, a final product, and the rate constant of the change, one may find the time dependence of the refractive index as
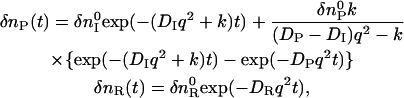 |
(4) |
where δnI and DI are the refractive index change due to the creation of the intermediate species and the diffusion coefficient of the intermediate species, respectively (23,29). Furthermore, we used the notation of δnP(t) to describe the species-grating signal of the product as well as the intermediate, both of which are created from the reactant by the photoexcitation. The diffusion coefficient extracted from the temporal profile of δnP(t) in a given time range is considered to be an apparent D at a specific time, and we may express this as DP(t) for explicitly showing the time-dependent feature. One should note that DP(t) changes from DI to DP with a rate constant of k. The temporal profile of the TG signal based on this model is calculated from Eqs. 1 and 4.
RESULTS
Time-dependent diffusion coefficient
A typical example of the TG signal of a phot1-LOV2 solution observed at 50 μM and at q2 = 3.4 × 10¹⁰ m−2 is shown in Fig. 1. The signal can be roughly separated into three phases, a rapid decay in microseconds, a following rise and decay, and a peak in a time region of longer than milliseconds. Although the temporal features after submilliseconds depend on q2 and the sample concentration, the signal in an early time region does not so much. We will describe and analyze the early two phases first, and then the last phase, that of the peak.
FIGURE 1.

TG signal (broken line) of phot1-LOV2 at 50 μM and q2 = 3.4 × 10¹⁰ m−2. The best-fitted curve to the observed TG signal based on the two-state model (Eqs. 1 and 4) is shown by the solid line, which is almost completely overlapped with the observed signal.
Upon actinic light excitation, the signal rose quickly within the time response of our measurement system (∼20 ns). We found that the subsequent temporal profile of the first two phases (500 ns–1 ms in Fig.1) can be reproduced well with a biexponential function. Hence, the TG signal in the whole time range may be expressed by
 |
(5) |
where k1 > k2, and δnspe(t) represents the species grating signal appearing in the longer time region, which will be analyzed later. The faster decay time constant k1 was determined to be 1.9 μs. This value did not depend on q2. The q2-independence indicates that this dynamics represents a chemical reaction, but not diffusion. Previous transient absorption studies reported that L660 of Avena phot1-LOV2 converted to S390 with a time constant of 4 μs (30) and that Chlamydomonoas phot-LOV1 formed the adduct in a biphasic manner with rates of 0.8 and 4 μs (8). Furthermore, we also observed a similar TG signal for Arabidopsis phot2-LOV2 with a lifetime of 0.9 μs, which we assigned to the photoconversion process from L660 to S390 (23). Based on the comparison with those rate constants, the 1.9-μs dynamics observed in the Arabidopsis phot1-LOV2 sample can be attributed to the conversion process from L660 to S390. The grating signal may include a major contribution from the population grating signal derived from the absorption change associating the adduct formation, and also from a small volume grating signal, which has been detected by the photoacoustic method (31,32).
The slower rate constant k2 of Eq. 5 was found to be dependent on the q2 value. This q2 dependence indicates that this dynamics characterized by k2 comes from the diffusion process. By comparing this with the thermal grating signal from a calorimetric reference sample (bromocresol purple), which should decay with a rate constant of Dthq2, it was concluded that the second exponential decay is the thermal grating component created by thermal energy due to the nonradiative transition from the excited state.
The TG signal appearing after this thermal grating signal is the species grating signal, δnspe(t) in Eq. 5, which reflects the chemical reaction kinetics as well as the molecular diffusion process. The temporal profile of this part depended on the q2 value and the concentration in a complex manner. Before showing the concentration dependence of the signal, the TG signals at a relatively low concentration ([LOV] = 50 μM) at various q2 are described and analyzed. In this low concentration sample, the signal after the thermal grating decayed to the base line monotonously in a high q2 range (q2 > 5 × 10¹² m−2) (Fig. 2 a). This decay could be expressed by a single exponential function.
 |
FIGURE 2.

TG signals (broken lines) of a 50-μM phot1-LOV2 solutions at q2 values of (a) 5.3 × 10¹², (b) 6.3 × 10¹¹, (c) 3.4 × 10¹¹, (d) 7.3 × 10¹⁰, and (e) 4.5 × 10¹⁰ m−2. The signals representing the molecular diffusion processes are shown, and these signals are normalized at the initial part of the diffusion signal. The best-fitted curves to the observed TG signals by the two-state model (Eqs. 1 and 4) are shown by the solid lines. The signals are almost completely simulated by the fitting curves, which are almost completely overlapped with the observed signal.
Since the time range of this signal depends on the q2 value (e.g., Fig. 2 b), this signal is certainly originated by the molecular diffusion process. If a product is formed by photoexcitation, molecular diffusion of the reactant and the product should be observed. According to the theoretical consideration in Principle and theory, the temporal profile should be expressed by a biexponential function (Eq. 3) if D is a constant in the observation time range. This single exponential decay under a high q2 condition is a clear indication that D of the reactant (D447) and the product (S390) are the same (DR = DP); i.e., D does not change upon the reaction in this observation time range. From the rate constant of the exponential fitting and q2 value of Fig. 2 a, D (= DR = DP) was calculated to be (9.8 ± 0.4) × 10−11 m2/s. Since D is one of the quantities that represents the global molecular structure of proteins, this fact of DR = DP suggests that phot1-LOV2 does not change conformation significantly upon photoreaction within an ∼1-ms time range.
Interestingly, the temporal profile drastically changed by decreasing q2. Under a relatively low q2 condition (Fig. 1 and Fig. 2, c–d), the signal once decayed to the baseline and then a growth-decay signal (diffusion peak) appeared. From the facts that the signal once came to zero before the appearance of the diffusion peak, and that the sign of δnth is negative at this temperature, we can deduce that the rise component corresponds to the negative change of the refractive index and the subsequent decay component to the positive change. From the signs of these refractive index changes and Eq. 1, the rise and decay components of the TG signal can be attributed to the molecular diffusion processes of the reactant (ground state protein (D447)) and the photoproduct, respectively; i.e., the faster rate of the rising component compared to the rate of decay indicates that the product diffuses more slowly than the reactant (DR > DP) in this time range.
The drastic change of the profile depending on q2 can be rationalized by considering that apparent D is time-dependent. Supporting this explanation are three more reasons for a time-dependent D. First, the profile could not be fitted by the biexponential function (Fig. 3). This fact indicates that the reaction cannot be a simple transformation from the ground state (D447) to the final product: an intermediate species must be involved. Second, the diffusion peak intensity depended significantly on the observation time (Fig. 2). If both DP and DR are time-independent, the diffusion peak intensity should not depend on q2, as predicted from Eq. 3. Contrary to this prediction, the TG signal in a fast timescale (i.e., with a large q2) was weak and the intensity increased with increasing the observation time by decreasing q2 (Fig. 2). This time dependence of the signal intensity can be explained in terms of the time-dependent apparent D as follows. On the basis of Eq. 3, the signal intensity should be weak when DP is close to DR because of the cancellation of the two terms in Eq. 3. With the increase in the difference between DP and DR, the apparent signal intensity becomes stronger. Since D of the reactant (DR) should be constant, the time-dependent change in the signal intensity should come from the time-dependent decrease of apparent D of the product. Third, more clear evidence for the time-dependent D may be obtained by the q2t plot of the signals. When the profile in this time range reflects only the diffusion process with a constant D, temporal profiles of the TG signals can be expressed by a combination of terms of exp(−Dq2t) (e.g., Eq. 3). In this case, all the TG signals measured at various q2 should have an identical shape when they are plotted against q2t. However, the shapes differ markedly among the profiles measured at the different q2 (Fig. 4), indicating that the constant D cannot explain the observed TG profiles.
FIGURE 3.

TG signal (dotted line) of a 190-μM phot1-LOV2 solution measured at q2 = 6.3 × 10¹¹ m−2 and a fitted curve (solid line) calculated by the biexponential function (Eq. 3). The signal cannot be simulated by this function.
FIGURE 4.

TG signals of a 50-μM phot1-LOV2 solution measured at q2 of (a) 6.3 × 10¹², (b) 3.4 × 10¹², (c) 7.3 × 10¹¹, and (d) 3.5 × 10¹¹ m−2. The times of peak after photoexcitation are 32, 58, 196, and 398 ms, respectively and they are indicated in the figure. The signals are normalized at the peak intensity and plotted against q2t to show the temporal changes of D.
On the basis of this evidence, the temporal profile of the TG signal was analyzed using the two-state model (Eq. 4) with a time-dependent apparent D (DP(t)) as follows. To obtain a reliable rate constant of the D-change from the fitting, the number of adjustable parameters was reduced. First, DR is fixed at 9.8 × 10⁻¹¹ m2/s, which was obtained from the high q2 signal (Fig.2 a). Second, since the signal in the high q2 range (q2 > 5 × 10¹² m−2) is expressed by the single exponential function, DP(t) just after the photoexcitation (DI in Eq. 4) should be similar to DR; i.e., we assumed DI = DR. Third, the q2t plot (Fig. 4) shows that the signals are similar at low q2 values. In other words, the time dependence of DP(t) almost completes in a slow time region, e.g., 200 ms (we will show below that indeed this time is sufficiently longer than the time constant of the kinetics). Therefore, since DR and DP(t) are constant in this slow time region, the signal after 200 ms should be expressed by a biexponential function (Eq. 3), and we thus determined the final DP(t) (Fig. 5) to be DP = (8.0 ± 0.4) × 10−11 m2/s. Using these parameters, the observed TG signal can be reproduced very well in a wide observation time range (i.e., at various q2) using a single reaction rate, k. The remarkable agreement between the fitted and the observed signals (Fig. 2) supports the belief that the two-state model is appropriate for describing this process. The time constant of the change determined from the fitting is 40 ± 10 ms at 50 μM. The photoreaction process with a lifetime of 1.9 μs accompanying the adduct formation (S390) should be a trigger for this diffusion change.
FIGURE 5.

TG signals (broken line) of a 50-μM phot1-LOV2 solution measured at the q2 of 3.5 × 10¹⁰ m−2, and a fitted curve (solid line) by the biexponential function (Eq. 3). The signal is well simulated after 200 ms.
Light-induced dimerization reaction
The above analyses show us that the molecular diffusion processes at 50 μM are well explained by the two-state model consisting of DR and DP(t) with a reaction constant of 40 ms. The DP(t) is decreased from the initial DI = 9.8 × 10⁻¹¹ m2/s (= DR) to the final DP = 8.0 × 10⁻¹¹ m2/s. The origin of the 0.82-fold decrease in DP compared with DR is discussed here.
The Stokes-Einstein relationship (Eq. 6) is frequently used as a basis for the molecular interpretation of D (33,34),
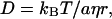 |
(6) |
where kB, T, η, a, and r are the Boltzmann constant, temperature, viscosity, a constant representing the boundary condition between the diffusing molecule and the solvent, and the radius of the molecule, respectively. Comparing D of phot1-LOV2 (17 kDa, DR = 9.8 × 10⁻¹¹ m2/s) with that of other water-soluble proteins of a similar size, e.g., D of myoglobin (18 kDa) = 11 ∼ 9 ×10⁻¹¹ m2/s (35–37), one may find that DR of phot1-LOV2 is a typical value for a protein of this size. This fact suggests that phot1-LOV2 exists as a monomeric form in the solution at this concentration.
According to the Stokes-Einstein relationship, under a given environment (T and η), D reflects the molecular size. However, it has been reported that D is also affected by a change in intermolecular interaction between proteins and the solvent molecules (23–29). Both effects are very difficult to separate rigorously. In this phot1-LOV2 case, we consider that the D-change by the intermolecular interaction is minor, because we previously found that D-change of phot2-LOV2 after the photoadduct formation is small. Although this previous observation cannot completely exclude the possible effect of the intermolecular interaction as the cause of the D-change, the following concentration dependence experiments suggest that the volume effect may be dominant in this case. If the difference in D between the reactant and the product (DP/DR = 0.82) is interpreted in terms of the difference in the molecular radius, the molecular volume of the product should be (1/0.82)3 = 1.8 times larger than that of the reactant. One of the possible explanations for the reduction of D is a dimerization reaction of the monomeric phot1-LOV2 upon the photoreaction, and this possibility is examined below in terms of the concentration dependence of the signal.
If the protein conformational change is responsible for the change in D, the reaction rate should be independent of concentration, and the profile of the TG signal in any timescale should not depend on concentration, except for the absolute intensity. On the other hand, if this D-change is caused by a multimolecular process, the kinetics of the TG signal should be sensitive to the concentration. In a relatively low q2 range than 7.0 × 10¹⁰ m−2; i.e., in a relatively long time range for the diffusion signal, the temporal profile was rather insensitive to the concentration. In a concentration range of 40–250 μM, a diffusion peak similar to that in Fig. 5 was observed and these peaks could be reproduced well by a biexponential function with DP = 9.8 × 10⁻¹¹ m2/s and DR = 8.0 × 10⁻¹¹ m2/s after 200 ms (data not shown). Therefore, the product with the final DP is not dependent on the concentration, at least after 200 ms. On the other hand, in a middle q2 range (Fig. 6; q2 = 6.3 × 10¹¹ m−2), the temporal profiles depended on the concentration significantly. In particular, we should note that the intensity of the diffusion peak relative to the thermal grating intensity decreased with decreasing concentration (Fig. 6). Considering that the diffusion peak appears to be due to the difference between DP(t) and DR, one may find that the change in DP(t) is smaller in this time range for a dilute sample. Since the final DP is independent of the concentration, as shown above, this change should be due to the slower rate of the DP(t)-change with decreasing the concentration. This concentration dependence of the rate indicates that more than one molecule are involved in the D-change process. The 1.8-fold increase in the molecular volume suggests that dimerization is a cause of the D-change. Below, we investigate this process by more quantitative analysis of the rate.
FIGURE 6.

TG signal (broken lines) measured at q2 = 6.3 × 10¹¹ m−2 with the concentrations of 40 μM, 60 μM, 70 μM, 80 μM, 120 μM, and 190 μM in the order of the concentration increase shown by the arrow. The signals are normalized at the initial part of the diffusion signal.
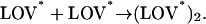
For producing the dimer, there may be two possible reaction schemes: the phototransformed phot1-LOV2 (LOV*) is associated with the ground-state phot1-LOV2 (LOV) to yield a dimer (Scheme 2), or two phototransformed phot1-LOV2s form the dimer (Scheme 3).
 |
(Scheme 2) |
 |
(Scheme 3) |
These possibilities can be tested by measuring the laser-power dependence of the rate constant. If the concentration of LOV is high enough compared with that of LOV*, which was satisfied under our experimental conditions (data not shown), the reaction of Scheme 2 can be represented by the pseudo-first-order reaction and the rate constant of this reaction should be essentially independent of the laser power. On the other hand, the reaction of Scheme 3 should be the second-order reaction on the phototransformed phot1-LOV2, so that the rate depends on the laser power; that is, the profile should be changed by changing the laser power. We found that, besides the absolute signal intensity, the temporal profile, which represents the reaction rate, did not depend on laser power (data not shown). Therefore, we conclude that Scheme 2 is appropriate to describe the dimerization process.
Furthermore, this scheme is supported by the fact that the temporal profile of the signal can be well reproduced based on the two-state model (see Time-dependent diffusion coefficient), as follows. According to the above consideration, the reaction scheme may be written as
 |
(Scheme 4) |
where kd is a bimolecular reaction rate and may be written as ki[LOV], where ki is the intrinsic bimolecular reaction rate constant and [LOV] is the concentration of phot1-LOV2. This scheme is identical to Scheme 1, whereas the reactions of Scheme 3 are bimolecular reactions of phototransformed molecules and cannot be reduced to Scheme 1. The very good fit of the observed signal based on the two-state model implies that Scheme 2 is appropriate to describe the dimerization process.
The determined kd is plotted against [LOV] in Fig. 7. From the slope of the plot, ki is determined to be 6.6 × 10⁵ M−1s−1. This value is much smaller than that of the diffusion-limited reaction rate calculated from DR and reaction distance (R), which was assumed to be twice the radius of gyration of LOV2 (4πR(2DR)NA = 6.1 × 10⁹ M−1s−1, where NA is the Avogadro number) (22,38,39). This small ki suggests a very small steric factor; that is, the dimerization reaction occurs only at a specific relative orientation of two phot1-LOV2 monomers.
FIGURE 7.

Concentration dependence of the rate constant (kd) of a phot1-LOV2 solution. The bar indicates the standard deviation, and the straight line was obtained by the least-square curve-fitting method.
We consider that the light-induced dimer should eventually dissociate to return to a monomeric form, because the observed signal is reproducible as long as the repetition rate of the excitation pulse is low enough (0.01 Hz). No permanent change was observed. Therefore, this dimer formation is not due to a covalent bonding. It may be reasonable to assume that the dimer dissociates when the photoadduct state of LOV2 returns to the ground state. We should emphasize that this TG technique for the D measurement in the time domain can detect such transient dimer formations.
Photodissociation reaction
As described in the previous section, the molecular diffusion signal at a low concentration under a high q2 condition decayed almost single-exponentially (Fig. 2 a). This feature indicates that the molecular diffusion process is faster than the dimerization reaction on this timescale. Very interestingly, increasing the concentration at this q2, we observed a significant change of the profile.
Fig. 8 depicts the concentration dependence of the signal in a concentration range of 40–300 μM. When the concentration was low enough, the species grating signal decayed single-exponentially. When the concentration was increased, the signal showed rise and decay (Fig. 8). At first glance, this signal seems to be similar to the signal observed in a low-q2 region (e.g., Fig. 2, c–e, or Fig. 3). However, a significant difference is that, since the diffusion signal after the thermal grating signal does not reach to baseline before the rise and decay signal in the concentrated solutions, the signs of δn of the rise and decay components are, respectively, positive and negative, which is opposite to what we observed for the dilute sample. Therefore, the rise component is attributed to the diffusion of a product and decay to that of the reactant. Apparently, from the rates of the rise and decay components, one may easily find that the product diffusion is faster than that of the reactant at the high concentrations (DR < DP).
FIGURE 8.

TG signals (broken lines) of phot1-LOV2 solutions with the concentrations of (a) 56 μM, (b) 110 μM, (c) 180 μM, (d) 200 μM, and (e) 300 μM measured at q2 = 7.9 × 10¹² m−2. The signals are normalized at the initial part of the diffusion signal. The best-fitted curves to the observed TG signals by the two-state model (Eqs. 1 and 4) are shown by the solid lines.
The temporal profile can again be fitted by the two-state model (Eq. 4). It was surprising to find that the signal was reproduced almost perfectly with D of the reactant at the low concentration DR = 8.0 × 10⁻¹¹ m2/s, DI = DR, D of the product DP = 9.8 × 10⁻¹¹ m2/s, and k−1 = 300 μs. It should be noted, from the results of the previous section, that D of the dimer and the LOV monomer are 8.0 × 10⁻¹¹ m2/s and 9.8 × 10⁻¹¹ m2/s, respectively. Therefore, at these concentrated solutions, the reactant exists in a dimeric form and the product is a monomer. The observed TG signal indicates that the dimer is dissociated to yield a monomer with a time constant of 300 μs upon photoexcitation.
The fraction of the dimer should depend on the concentration. Indeed, the concentration dependence of Fig. 8 shows that the fraction of the dimer was increased with increasing concentration. However, it is difficult to quantitatively estimate the fraction, unless the TG signal due to the purely dimer solutions is known. Nevertheless, we guess that the fraction of the dimer cannot be so high, for the following reason. When D changes upon photoreaction, the growth-decay profile (diffusion peak) should appear. This peak intensity must be stronger than that for the signal without D-changes, because δnP and δnR in Eq. 3 are cancelled by each other in this case. Indeed, this situation was demonstrated in Fig. 2 (for example, Fig. 2, a versus e). However, the diffusion peak intensity for the photodissociation reaction of the dimer, even at a high concentration (Fig. 8 e), is not so much stronger than that of the exponentially decaying component at a low concentration (Fig. 8 a). This weak signal intensity implies that the fraction of the dimer is not high even at this highest concentration (300 μM).
This dissociation reaction should contribute to the signals measured at any q2. However, since the signal due to this dissociation reaction is much weaker than that due to the dimerization reaction (diffusion peak) due to the small fraction of the dimer, this contribution was masked by the strong diffusion peak at middle or low q2. The minor contribution of the dimer can explain why the TG signal did not depend on the phot1-LOV2 concentration under a low q2 condition, as described in the previous section.
DISCUSSION
Previously, a small-angle x-ray scattering study on Arabidopsis phot1-LOV2 showed dimer formation at sample concentrations >67 μM (1 mg/ml), whereas the TG study described in the above sections shows it in the monomeric form at 50 μM (22). In the small-angle x-ray scattering study, the phot1-LOV2 polypeptide covers the core portion (Arabidopsis phot1-LOV2 (462–586) (D. Matsuoka, Osaka Prefecture University, and S. Tokutomi, 2006, personal communication)), whereas our sample consists of a 13-amino-acid extension at the N-terminus that is requisite to prevent aggregate formation during the long-time measurements at room temperature. This may explain the discrepancy. Gel chromatography on the LOV2 domain of oat phototropins, on the other hand, reported that they exist as a monomer at low concentrations (40), which is consistent with our result.
The light-induced dimerization of the monomer implies that the dimer form is stable in the S390 state. On the other hand, the ground-state dimer is dissociated by the photoexcitation. These two observations seem to be contradictory. How can we account for these observations? Although we have no exact explanation, one may consider two possibilities. First, the conformations of the ground-state dimer ((LOV)2) and the dimer created by the phototransfomation (LOV*-LOV) could be different. If the ground-state dimer is unstable in the transformed state, the dimer in the ground state should be dissociated upon photoexcitation. Second, both observations are consistent if the transient dynamics of the phototransformed LOV2 causes the driving force of the photodissociation. The initial impact of the phototransfomation or transient fluctuation of phot1-LOV2 leads the dissociation with the time constant of 300 μs. On the other hand, the phototransformed monomer produces the dimer later in the millisecond time range by molecular collision with a favorable orientation. The schematic illustrations of these possible reactions are shown in Fig. 9.
FIGURE 9.

Schematic showing the photoreaction process of phot1-LOV2 detected by TG. (a) Light-induced association of two monomers. (b) Light-induced dissociation of a dimeric form.
The observed photodissociation process may lead to an interesting speculation on the molecular mechanism of conformational change in the phot2-LOV2 sample with a linker. According to the previous study of the phot2-LOV2 sample, the linker part is detached from the phot2-LOV2 domain upon photoexcitation. This new intermediate cannot be distinguished from S390 by their absorption spectra, since they have an almost identical electronic structure around the chromophore. However, it has a different conformation in the protein moiety, especially in the linker, from those of S390 (23). Our observation here of the photodissociation of the ground-state dimer could be related to the photodetachment of the linker from the LOV2 domain observed before. If there is an analogy between the dissociation of (LOV*-LOV) and LOV*-linker, we may speculate that the time constant of the photodetachment of the linker from the LOV2 domain could be 300 μs. The photoreaction dynamics of the phot1-LOV2 domain with the linker will be studied in the future to reveal the molecular origin of the conformational change of the phototropins.
CONCLUSION
We studied the photoreaction kinetics of Arabidopsis phot1-LOV2 domain from the viewpoint of the diffusion coefficient. We found that D of this phot1-LOV2 decreases with time upon photoexcitation from (9.8 ± 0.4) × 10−11 m2/s to (8.0 ± 0.4) × 10−11 m2/s. The rate increased with increasing concentration almost linearly. From the D-value, as well as the concentration dependence, we concluded that LOV2 exists as a monomeric form in a dilute solution and the phototransformed monomer produces the dimer with the ground-state phot1-LOV2. Very interestingly, it was found that the fraction of dimeric form increases gradually with increasing concentration. This dimer is photodissociated with a time constant of 300 μs. The light-induced association and dissociation reactions observed for the same sample can be explained by different dimeric structures for the ground-state dimer and the light-induced dimer, or it may indicate that the transient conformational fluctuation causes the dissociation reaction. These photodissociation and photoassociation processes of phot1-LOV2 do not appear in the transient signal detected by the absorption change. Furthermore, this transient change cannot be detected by a conventional gel chromatographic technique. We believe this time-resolved D measurement will, in future, be a useful and powerful technique to detect spectrally silent transient dynamics including protein-association and -dissociation reactions, which could participate in many sensor protein reactions.
Acknowledgments
This work is supported by a Grant-in-Aid (Nos. 13853002 and 15076204 to M.T., and 13139205 and 17084008 to S.T.) from the Ministry of Education, Science, Sports and Culture in Japan.
Daisuke Matsuoka and Satoru Tokutomi's present address is Dept. of Biological Science, Graduate School of Science, Osaka Prefecture University, Sakai, Osaka, 599-8531, Japan.
References
- 1.Beens, H., and A. Weller. 1975. Organic Molecular Photophysics. J. B. Birks, editor. John Wiley & Sons. London.
- 2.Celaya, R. B., and E. Liscum. 2005. Phototropins and associated signaling: providing the power of movement in higher plants. Photochem. Photobiol. 81:73–80. [DOI] [PubMed] [Google Scholar]
- 3.Huala, E., P. W. Oeller, E. Liscum, I. S. Han, E. Larsen, and W. R. Briggs. 1997. Arabidopsis NPH1: a protein kinase with a putative redox-sensing domain. Science. 278:2120–2123. [DOI] [PubMed] [Google Scholar]
- 4.Christie, J. M., P. Reymond, G. K. Powell, P. Bernasconi, A. A. Raibekas, E. Liscum, and W. R. Briggs. 1998. Arabidopsis NPH1: a flavoprotein with the properties of a photoreceptor for phototropism. Science. 282:1698–1701. [DOI] [PubMed] [Google Scholar]
- 5.Christie, J. M., M. Salomon, K. Nozue, M. Wada, and W. R. Briggs. 1999. LOV (light, oxygen, or voltage) domains of the blue-light photoreceptor phototropin (nph1): binding sites for the chromophore flavin mononucleotide. Proc. Natl. Acad. Sci. USA. 96:8779–8783. [DOI] [PMC free article] [PubMed] [Google Scholar]
- 6.Briggs, W. R., and J. M. Christie. 2002. Phototropins 1 and 2: versatile plant blue-light receptors. Trends Plant Sci. 7:204–210. [DOI] [PubMed] [Google Scholar]
- 7.Matsuoka, D., and S. Tokutomi. 2005. Blue light-regulated molecular switch of Ser/Thr kinase in phototropin. Proc. Natl. Acad. Sci. USA. 102:13337–13342. [DOI] [PMC free article] [PubMed] [Google Scholar]
- 8.Kottke, T., J. Heberle, D. Hehn, B. Dick, and P. Hegemann. 2003. Phot LOV1: photocycle of a blue-light receptor domain from the green alga Chlamydomonas reinhardtii. Biophys. J. 84:1192–1201. [DOI] [PMC free article] [PubMed] [Google Scholar]
- 9.Schüttrigkeit, T. A., C. K. Kompa, M. Salomon, W. Rüdiger, and M. E. Michel-Beyerle. 2003. Primary photophysics of the FMN binding LOV2 domain of the plant blue light receptor phototropin of Avena sativa. Chem. Phys. 294:501–508. [Google Scholar]
- 10.Kennis, J. T. M., S. Crosson, M. Gauden, I. H. M. van Stokkum, K. Moffat, and R. van Grondelle. 2003. Primary reactions of the LOV2 domain of phototropin, a plant blue-light photoreceptor. Biochemistry. 42:3385–3392. [DOI] [PubMed] [Google Scholar]
- 11.Schleicher, E., R. M. Kowalczyk, C. W. M. Kay, P. Hegemann, A. Bacher, M. Fischer, R. Bittl, G. Richter, and S. Weber. 2004. On the reaction mechanism of adduct formation in LOV domains of the plant blue-light receptor phototropin. J. Am. Chem. Soc. 126:11067–11076. [DOI] [PubMed] [Google Scholar]
- 12.Salomon, M., J. M. Christie, E. Knieb, U. Lempert, and W. R. Briggs. 2000. Photochemical and mutational analysis of the FMN-binding domains of the plant blue light receptor phototropin. Biochemistry. 39:9401–9410. [DOI] [PubMed] [Google Scholar]
- 13.Salomon, M., W. Eisenreich, H. Dürr, E. Schleicher, E. Knieb, V. Massey, W. Rüdiger, F. Müller, A. Bacher, and G. Richter. 2001. An optomechanical transducer in the blue light receptor phototropin from Avena sativa. Proc. Natl. Acad. Sci. USA. 98:12357–12361. [DOI] [PMC free article] [PubMed] [Google Scholar]
- 14.Kasahara, M., T. E. Swartz, M. A. Olney, A. Onodera, N. Mochizuki, H. Fukuzawa, E. Asamizu, S. Tabata, H. Kanegae, M. Takano, J. M. Christie, A. Nagatani, and W. R. Briggs. 2002. Photochemical properties of the flavin mononucleotide-binding domains of the phototropins from Arabidopsis, rice, and Chlamydomonas reinhardtii. Plant Physiol. 129:762–773. [DOI] [PMC free article] [PubMed] [Google Scholar]
- 15.Crosson, S., and K. Moffat. 2001. Structure of a flavin-binding plant photoreceptor domain: insights into light-mediated signal transduction. Proc. Natl. Acad. Sci. USA. 98:2995–3000. [DOI] [PMC free article] [PubMed] [Google Scholar]
- 16.Crosson, S., and K. Moffat. 2002. Photoexcited structure of a plant photoreceptor domain reveals a light-driven molecular switch. Plant Cell. 14:1067–1075. [DOI] [PMC free article] [PubMed] [Google Scholar]
- 17.Swartz, T. E., P. J. Wenzel, S. B. Corchnoy, W. R. Briggs, and R. A. Bogomolni. 2002. Vibration spectroscopy reveals light-induced chromophore and protein structural changes in the LOV2 domain of the plant blue-light receptor phototropin 1. Biochemistry. 41:7183–7189. [DOI] [PubMed] [Google Scholar]
- 18.Fedorov, R., I. Schlichting, E. Hartmann, T. Domratcheva, M. Fuhrmann, and P. Hegemann. 2003. Crystal structures and molecular mechanism of a light-induced signaling switch: the Phot-LOV1 domain from Chlamydomonas reinhardtii. Biophys. J. 84:2492–2501. [DOI] [PMC free article] [PubMed] [Google Scholar]
- 19.Iwata, T., D. Nozaki, S. Tokutomi, and H. Kandori. 2005. Comparative investigation of the LOV1 and LOV2 domains in Adiantum phytochrome3. Biochemistry. 44:7427–7434. [DOI] [PubMed] [Google Scholar]
- 20.Harper, S. M., L. C. Neil, and K. H. Gardner. 2003. Structural basis of a phototropin light switch. Science. 301:1541–1544. [DOI] [PubMed] [Google Scholar]
- 21.Harper, S. M., J. Christie, and K. H. Gardner. 2004. Disruption of the LOV-J helix interaction activates phototropin kinase activity. Biochemistry. 43:16184–16192. [DOI] [PubMed] [Google Scholar]
- 22.Nakasako, M., T. Iwata, D. Matsuoka, and S. Tokutomi. 2004. Light-induced structural changes of LOV domain-containing polypeptides from Arabidopsis phototropin 1 and 2 studied by small-angle x-ray scattering. Biochemistry. 43:14881–14890. [DOI] [PubMed] [Google Scholar]
- 23.Eitoku, T., Y. Nakasone, D. Matsuoka, S. Tokutomi, and M. Terazima. 2005. Conformational dynamics of phototropin 2 LOV2 domain with the linker upon photoexcitation. J. Am. Chem. Soc. 127:13238–13244. [DOI] [PubMed] [Google Scholar]
- 24.Terazima, M., and N. Hirota. 1993. Translational diffusion of a transient radical studied by the transient grating method, pyrazinyl radical in 2-propanol. J. Chem. Phys. 98:6257–6262. [Google Scholar]
- 25.Terazima, M., K. Okamoto, and N. Hirota. 1995. Translational diffusion of transient radicals created by the photoinduced hydrogen abstraction reaction in solution: anomalous size dependence in the radical diffusion. J. Chem. Phys. 102:2506–2512. [Google Scholar]
- 26.Terazima, M. 2000. Is the translational diffusion of organic radicals different from that of closed-shell molecules? Acc. Chem. Res. 33:687–694. [DOI] [PubMed] [Google Scholar]
- 27.Nada, T., and M. Terazima. 2003. A novel method for study of protein folding kinetics by monitoring diffusion coefficient in time domain. Biophys. J. 85:1876–1881. [DOI] [PMC free article] [PubMed] [Google Scholar]
- 28.Nishida, S., T. Nada, and M. Terazima. 2004. Kinetics of intermolecular interaction during protein folding of reduced cytochrome c. Biophys. J. 87:2663–2675. [DOI] [PMC free article] [PubMed] [Google Scholar]
- 29.Terazima, M. 2006. Diffusion coefficients as a monitor of reaction kinetics of biological molecules. Phys. Chem. Chem. Phys. 8:545–557. [DOI] [PubMed] [Google Scholar]
- 30.Swartz, T. E., S. B. Corchnoy, J. M. Christie, J. W. Lewis, I. Szundi, W. R. Briggs, and R. A. Bogomolni. 2001. The photocycle of a flavin-binding domain of the blue light photoreceptor phototropin. J. Biol. Chem. 276:36493–36500. [DOI] [PubMed] [Google Scholar]
- 31.Losi, A., and S. E. Braslavsky. 2003. The time-resolved thermodynamics of the chromophore-protein interactions in biological photosensors as derived from photothermal measurements. Phys. Chem. Chem. Phys. 5:2739–2750. [Google Scholar]
- 32.Losi, A., T. Kottke, and P. Hegemann. 2004. Recording of blue light-induced energy and volume changes within the wild-type and mutated phot-LOV1 domain from Chlamydomonas reinhardtii. Biophys. J. 86:1051–1060. [DOI] [PMC free article] [PubMed] [Google Scholar]
- 33.Tyrrell, H. J. V., and K. R. Harris. 1984. Diffusion in Liquids. Butterworth, London.
- 34.Cussler, E. L. 1994. Diffusion. Cambridge University Press,. Cambridge, UK.
- 35.Riveros-Moreno, V., and J. B. Wittenberg. 1972. The self-diffusion coefficients of myoglobin and hemoglobin in concentrated solutions. J. Biol. Chem. 247:895–901. [PubMed] [Google Scholar]
- 36.Wilkins, D. K., S. B. Grimshaw, V. Receveur, C. M. Dobson, J. A. Jones, and L. J. Smith. 1999. Hydrodynamic radii of native and denatured proteins measured by pulse field gradient NMR techniques. Biochemistry. 38:16424–16431. [DOI] [PubMed] [Google Scholar]
- 37.Bismuto, E., E. Gratton, and D. C. Lamb. 2001. Dynamics of ANS binding to tuna apomyoglobin measured with fluorescence correlation spectroscopy. Biophys. J. 81:3510–3521. [DOI] [PMC free article] [PubMed] [Google Scholar]
- 38.Smoluchowski, M. V. 1917. Versuch einer mathematischen Theorie der Koagulationskinetik kolloider Lösungen. Z. Phys. Chem. 92:129–168. [Google Scholar]
- 39.Atkins, P., and J. Paula. 2004. Atkins' Physical Chemistry. Oxford University Press, Oxford, UK.
- 40.Salomon, M., U. Lempert, and W. Rudiger. 2004. Dimerization of the plant photoreceptor phototropin is probably mediated by the LOV1 domain. FEBS Lett. 572:8–10. [DOI] [PubMed] [Google Scholar]