

Abstract
A microtiter plate assay for quantitation of reduced (GSH) and oxidized (GSSG) glutathione in the rat liver tissue and bile is described. The assay is based on the established enzymatic recycling method and a new thiol-masking reagent, 1-methyl-4-vinyl-pyridinium trifluoromethane sulfonate (M4VP). Samples were first processed by homogenization with (liver) or addition of (bile) sulfosalicylic acid. The total glutathione and GSSG were then determined before and after rapid (≤ 2 min) and efficient (100%) masking of the GSH content of the samples with M4VP followed by the enzymatic recycling assay. The percentages of error and coefficient of variation of the assay were within the accepted guidelines, indicating the accuracy and precision of the assay in the range of 6.25–100 pmol GSH per microplate well and 2.17–140 pmol GSSG per well, with lower limit of quantitation of 6.25 and 2.17 pmol per well for GSH and GSSG, respectively. Furthermore, the recoveries of added GSH or GSSG from the liver and bile samples were accurate and precise. The assay was applied to measurement of GSH, GSSG, and GSH:GSSG ratio in the liver and serially-collected bile samples in sham-operated and ischemic rat livers, demonstrating a depletion of glutathione and a decrease in the GSH:GSSG ratio as a result of ischemia. The developed assay is rapid, sensitive, accurate, and precise and is suitable for studies of the redox status of liver under physiologic and pathophysiologic conditions.
Keywords: Glutathione, Liver, Bile, Rat, Enzyme recycling reaction, Ischemia
Introduction
Glutathione is a tripeptide, which is present in high (mM range) concentrations in different tissues, including the liver. The peptide has an important role in detoxifying reactions such as scavenging cellular hydrogen peroxide and conjugation of electrophilic metabolites of xenobiotics [1]. Glutathione is present in the cells in both the reduced (GSH) and oxidized (GSSG) forms. Because of the action of the NADPH-dependent enzyme GSSG reductase (GR), the cellular content of glutathione is predominantly in favor of GSH under normal physiologic conditions. However, pathophysiologic conditions causing oxidative stress would result in an increase in the GSSG: GSH ratios [2, 3]. Therefore, methods that can accurately and specifically measure both GSH and GSSG in biological samples are crucial for understanding of the oxidation-reduction status of cells or tissues.
Most of the currently available methods that can measure both GSH and GSSG are based on either high-performance liquid chromatography [4–8] or measurement of total glutathione by an enzymatic recycling method before and after masking of reduced glutathione using a thiol reagent [9–11]. Chromatographic methods have the advantage of simultaneous separation and quantitation of GSH and GSSG in one run. However, for sensitivity purposes, most of them require derivatization [5, 8], extending the analysis time, or the use of electrochemical [4, 6] or mass spectrometric [7] detectors, which may not be easily available in some laboratories. Furthermore, chromatographic methods may also be disadvantageous in situations requiring analysis of a large number of samples in a short period of time.
The enzymatic recycling methods for measurement of total glutathione and GSSG levels in biological samples are based on the reaction of GSH with the thiol masking reagents N-ethylmaleimide (NEM) or 2-vinylpyridine (2VP). Tietze [9] used NEM to form a stable complex with GSH, preventing it from participating in the enzymatic recycling reaction with GR. Although this reaction is very effective (100% removal of GSH), it is relatively slow (40–60 min). Furthermore, the excess NEM has to be removed before the recycling reaction because it inhibits GR. Later [10], Griffith reported the use of 2VP, instead of NEM, which does not inhibit GR, and, therefore, need not be removed from the sample. However, the masking reaction still requires 20–60 min incubation at room temperature. Because GSH is unstable and may undergo autooxidation to GSSG at room temperature in some biological samples, a more rapid masking reaction is desirable. In this article, we report the use of a derivative of 2VP, namely 1-methyl-4-vinyl-pyridinium trifluoromethane sulfonate (M4VP), which completely masks GSH within 2 min. The method is optimized for measurement of GSH and GSSG in the rat liver tissue and bile samples using a rapid and efficient microplate assay.
Experimental
Reagents
Reduced glutathione (GSH), 5,5′-dithiobis(2-nitrobenzoic acid) (DTNB), and GSSG reductase (GR) were obtained from Sigma-Aldrich Co. (St. Louis, MO). NADPH was purchased from Calzyme Laboratories Inc. (San Luis Obispo, CA). Sulfosalicylic acid (SSA) was obtained from Alfa Aesar (Ward Hill, MA). Oxidized glutathione (GSSG) was obtained from Acros Organics (Morris Plains, NJ). 1-Methyl-4-vinyl-pyridinium trifluoromethane sulfonate (M4VP) was obtained from OxisResearch (Portland, OR). All other reagents were analytical grade and obtained from commercial sources.
Preparation of biological samples for analysis
Liver samples were homogenized in five volumes of cold SSA (5%, w/v in distilled water) in a hand-held homogenizer. After centrifugation at 14000 rpm for 10 min (4oC), the resulting supernatant was separated and stored at −80oC for further analysis. Similarly, bile samples were mixed with five volumes of SSA during sample collection, and following centrifugation stored at −80oC.
GSH masking for GSSG measurement
To measure GSSG by the enzymatic method in a sample containing both GSH and GSSG, free GSH must be masked first. This was accomplished by treating the sample with M4VP. The final method was optimized with regard to pH and the concentration of M4VP, as described below.
Effect of pH
A 6 mM solution of GSH in water was diluted six times with a cold solution of SSA in water (5%, w/v). After mixing, an equal volume of M4VP solution (3 mM in 1 mM HCl) was added, and the resulting sample was further diluted by addition of eight volumes of various solutions with different pH values. These solutions were phosphate (100 mM)-EDTA (1 mM) buffers at pH 5.0, 7.4 or 8.0, or 42.5, 50, or 100 mM sodium carbonate solutions, resulting in pH values of 2.5, 6.2, 6.8, 8.4, 9.0, or 10 in the final samples, respectively. To determine the time course of the reaction of M4VP with free GSH, the unreacted GSH was then estimated at 0 (before addition of M4VP), 1, 2, 5, 10, 15, and 30 min after the incubation of samples with M4VP at room temperature (n = 3).
Effects of M4VP Concentration
These experiments delineated the time course of the reaction of M4VP with GSH (6 mM) at different concentrations of M4VP resulting in M4VP: GSH concentration ratios of 1, 2, 3, 6, or 9 (n = 3). The procedure outlined above for pH effect was used, except that the pH of the final solution was fixed at 10 using 100 mM solution of sodium carbonate. In addition to these experiments using the 6 mM GSH concentrations, the time course of the reaction was also investigated using 1 mM GSH at M4VP: GSH concentration ratios of 1 and 9 (n = 3).
Final method for masking GSH with M4VP in the liver and bile samples
An aliquot of a 6 mM solution of M4VP was added to an equal volume of the SSA-diluted (six fold) bile or liver supernatant sample, and an additional eight volumes of 100 mM sodium carbonate were added to adjust the pH to ~10. The reaction of M4VP and free GSH was allowed to take place over 2 min at room temperature. Afterwards, the samples (n =3) were subjected to the recycling method described below.
Recycling method for determination of total glutathione or GSSG in liver and bile samples
Determination of GSH and/or GSSG was based on the GSH recycling method described before [9] and depicted in Scheme 1. In this reaction, GSH reacts with DTNB to form the disulfide GSTNB and the yellow-colored compound 5-thio-2-nitrobenzoic acid (TNB). The disulfide product (GSTNB) is then reduced by GR in the presence of NADPH, recycling GSH back into the reaction. The rate of formation of TNB, measured at 405 nm, is proportional to the concentrations of GSH in the sample. This method also quantitates GSSG because GSSG is reduced by GR, present in the reaction mixture, to two molecules of GSH (Scheme 1).
Scheme 1.
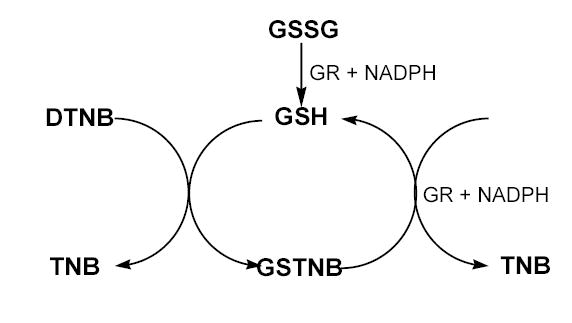
The enzymatic recycling method for quantitation of GSH and/or GSSG. GSSG, oxidized glutathione; GSH, reduced glutathione; GR, glutathione reductase; DTNB, 5,5′-dithiobis(2-nitrobenzoic acid); TNB, 5-thio-2-nitrobenzoic acid; GSTNB, the disulfide product of reaction of GSH with DTNB.
The method was used for determination of total (GSH plus GSSG) and oxidized (GSSG) glutathione by subjecting the M4VP-untreated and treated samples, respectively, to the recycling reaction. For determination of total glutathione, the untreated, SSA-diluted liver or bile samples were first diluted by an additional 500 fold using a phosphate (100 mM)-EDTA (1 mM) buffer (pH 7.4) before analysis. For GSSG measurement, M4VP-treated samples were diluted by an additional 6-fold using the same buffer.
Diluted liver or bile samples (50 μl), prepared as described above, were transferred to a 96-well microplate. Subsequently, 100 μl of the recycling reagent, which contained NADPH (0.30 mM), DTNB (0.225 mM), and GR (1.6 units/ml) in a phosphate (100 mM)-EDTA (1 mM) buffer (pH 7.4), was added. Immediately after the addition of the reagent, color development was recorded at 405 nm for 4 min using a Wallac 1420 microplate reader equipped with kinetic analysis software.
Preparation of standard curves
GSH
Standard GSH samples (0.375 to 6.00 mM in distilled water) in triplicates were subjected to the same procedure as described above for bile and liver samples. Briefly, standards were first treated with 5 volumes of SSA solution and then further diluted 500 fold with the phosphate-EDTA buffer (pH 7.4). A 50-μl aliquot of the diluted solution was subsequently treated with 100 μl of the recycling reagent solution in a 96-well microplate, and color development was recorded for 4 min. This procedure results in final amounts of 6.25–100 pmol GSH per well.
GSSG
Similarly, the GSSG standards (0.0156–1.00 mM in distilled water) in triplicates were subjected to the same procedure described above for determination of GSSG in bile and liver samples. Briefly, after addition of 5 volumes of SSA solution, the samples were further diluted 10 fold using one volume of 1 mM HCl (M4VP vehicle) and 8 volumes of 100 mM sodium carbonate solution. Following incubation at room temperature for 2 min, samples were diluted 6 fold with the buffer before being subjected to the recycling reaction. The final amounts of GSSG in the wells were 2.17–140 pmol.
Generation of standard curves
The rate of TNB formation, which is proportional to the concentrations of GSH or GSSG in the sample, was determined by linear regression analysis of the change in absorbance of the sample at 405 nm versus time (ΔA/min) over 4 min of measurement at 30-sec intervals. The ΔA/min values for individual standards were then plotted against the standard concentrations, and the parameters of the standard curve were determined using linear regression analysis.
Assay validation
The intra- and inter-run precision and accuracy of the assay (n = 4) were determined by percent CV and percent error values, respectively. Briefly, each set of quality control samples containing the lowest, midpoint, and highest concentrations in the calibration curves was run along with a calibration curve. The concentrations of the quality control samples were then determined against the calibration curve and used for the calculation of percent CV and percent error values. The quality control samples were run at the GSH concentrations of 6.25, 25.0, and 100 pmol per well and at GSSG concentrations of 2.17, 35.0, and 140 pmol per well.
The thiol-masking reagent NEM, used by Tietze [9], inhibits GR, requiring its removal before the recycling reaction. Therefore, we also studied whether excess M4VP, used in our studies, has any inhibitory effects on GR and/or the recycling reaction. A 3 mM standard solution of GSSG (equivalent to 6 mM GSH) was subjected to the GSSG assay in the presence and absence of M4VP (n = 3) and the average ΔA/min values for the two treatments were compared.
The assay validation also included the recovery of GSH and GSSG from rat liver samples spiked with 6 mM GSH or 0.1 mM GSSG and bile samples spiked with 4 mM GSH and 0.833 mM GSSG. The original and spiked samples were then subjected to the assay procedure for determinations of both GSH and GSSG based on appropriate calibration standards.
Finally, we also compared the performance of our assay, which is based on the rapid masking of GSH by M4VP, with a standard assay [10], which utilizes the slow reacting 2VP for GSH masking. Because the latter assay is conducted in a cuvette, as opposed to our microtiter plate assay, we also included a third assay, which is based on the 2VP masking in a microtiter plate [11]. Briefly, samples (n = 5) from different lobes of the liver of an untreated Sprague-Dawley rat were homogenized in five volumes of cold SSA (5%, w/v) and, after centrifugation, supernatants were collected. The same supernatants were then subjected to all three analytical methods for measurement of GSSG. The procedures were identical to those reported here for M4VP and those reported before using 2VP [10, 11]. Each assay utilized its own calibration standard.
Application of the assay
Two adult Sprague-Dawley rats were anesthetized with an intramuscular injection of ketamine: xylazine (80:12 mg/kg), and their common bile ducts were cannulated [12] for collection of bile. Global liver ischemia was induced in one rat by occluding the portal vein and hepatic artery for 60 min. A second animal was used as a sham-operated control undergoing the same procedure without the induction of ischemia. Abdominal tissues were kept moist with saline-soaked cotton gauzes, and the body temperature was kept constant using a heating pad. Bile samples, collected at 10-min intervals, were immediately diluted with 5 volumes of 5% SSA solution. Additionally, at 60 min after the ischemia or sham operation, livers were perfused, through a portal vein catheter, with a cold ringer’s lactate solution to remove blood. Livers were then harvested, snap frozen, and immediately stored at −80oC. Samples from the left, median, and right lobes from both livers were analyzed for their content of total, reduced, and oxidized glutathione. All the samples were analyzed in triplicates within 24 h of collection. All the procedures involving animals were approved by the Institutional Animal Care and Use Committee of our institution.
Data analysis
The concentration of reduced glutathione (GSH) was estimated by subtracting the measured oxidized (GSSG) glutathione levels from the measured total (GSH plus GSSG) glutathione in each sample. The recovery of GSH and GSSG from the spiked samples was determined by subtracting the GSH or GSSG concentrations in the original samples from the corresponding concentrations in the spiked samples.
The statistical comparison of multiple (≥ 3) means was performed using ANOVA with a post-hoc analysis of means based on Scheffe F test. For comparisons involving only two means, a two-tailed, unpaired t-test was used. Data are presented as mean ± SD.
Results
Reaction of GSH with M4VP
The time courses of the reaction of GSH with M4VP in the pH range of 2.5 to 10 are depicted in Figure 1. These experiments were carried out with a M4VP: GSH molar ratio of 3. Whereas there was no substantial reaction of GSH with M4VP at pH 2.5, a time-dependent increase in GSH masking was observed with all the other studied pH media (Figure 1). Additionally, an increase in the pH in the range of 6.2 to 10 resulted in a progressive increase in the rate of reaction (Figure 1); after 5 min of incubation, the percentages of unreacted GSH were 87.2 (pH 6.2), 81.7 (pH 6.8), 58.8 (pH 8.4), 10.1 (pH 9.0), and 0.916 (pH 10) (p < 0.05 for all the paired comparison of means). Based on theses studies, a pH of 10 was selected as the reaction environment for further optimization studies.
Figure 1.
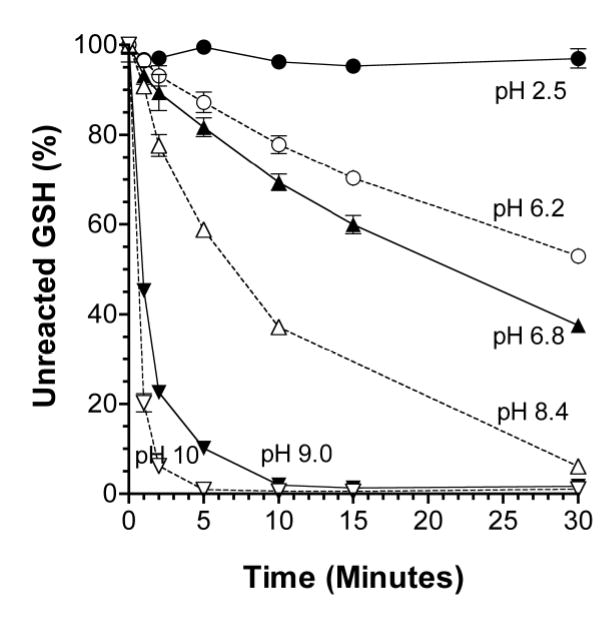
The time courses of the reaction of M4VP with GSH under different pH values, resulting in masking GSH. The M4VP: GSH ratio was fixed at 3. Symbols and bars represent the mean and SD values, respectively (n = 3).
The effects of molar ratio of M4VP: GSH at initial GSH concentrations of 1 or 6 mM on the time course of the reaction of GSH with M4VP at pH 10 are depicted in Figure 2. Because the expected liver or bile concentration of total glutathione is ≤ 6 mM, we first tested the effects of varying molar ratios of M4VP: GSH (1–9) at a fixed GSH concentration of 6 mM (Figure 2, top). The increase in the molar ratio in the range of 1 to 6 resulted in a progressive increase in the rate of reaction (Figure 2, top); the percentages of unreacted GSH at 2 min after reaction were 28.8 ± 0.3, 14.9 ± 0.5, 5.42 ± 0.30, and 0.529 ± 0.073 for the ratios of 1, 2, 3, and 6, respectively (p < 0.05 for all the paired comparisons of the means). However, a further increase in the ratio to 9 did not have any impact on the time course of the reaction as the data for the ratios of 6 and 9 were superimposable (Figure 2, top). Additional studies, using different initial concentrations of GSH (1 versus 6 mM) showed that at similar molar ratios of M4VP: GSH, the reaction was significantly faster when the absolute concentrations of GSH and M4VP were higher (Figure 2, bottom). This suggests that, in addition to the M4VP:GSH ratio, there may be a minimum concentration of M4VP necessary for the masking to be rapid. For example, after 2 min of reaction, the percentages of unreacted GSH were 78.6 ± 4.8 (1 mM GSH) versus 28.8 ± 0.3 (6 mM GSH) for the molar ratio of 1 and 11.6 ± 0.3 (1 mM GSH) versus 0.260 ± 0.011 (6 mM GSH) for the molar ratio of 9 (Figure 2, bottom).
Figure 2.

The time courses of the reaction of M4VP with GSH at M4VP:GSH molar ratios of 1, 2, 3, 6, or 9 in the presence of 6 mM GSH (top) and at M4VP:GSH molar ratios of 1 and 9 in the presence of 1 or 6 mM of GSH (bottom) in the sample. The pH was fixed at 10. Symbols and bars represent the mean and SD values, respectively (n = 3).
These studies show that the optimum pH and M4VP: GSH ratio for masking GSH with M4VP are ~10 and 6, respectively, based on a sample GSH concentration of ≤ 6 mM. Under these conditions, the masking of GSH was quantitative within 2 min of sample incubation (Figure 2, top). Therefore, standard curves for GSSG measurements were prepared using these optimal conditions with a 2-min incubation time.
To demonstrate the applicability of these optimal conditions to biological samples, the time courses of the reaction of GSH with M4VP were determined in the liver and bile samples taken from the sham-operated rat (Figure 3). Both bile and liver samples reached a plateau within 2 min of reaction, and there were no significant differences (p < 0.05) between the samples within the 2–10 min incubation time for either the bile or liver samples (Figure 3).
Figure 3.

The time courses of the reaction of M4VP with GSH present in the liver homogenate or bile samples using the final method (see the text for details). Symbols and bars represent the mean and SD values, respectively (n = 3).
Standard curves and assay validation
The time courses of the accumulation of TNB as a result of the recycling reaction for standards containing different concentrations of GSH and the resultant representative standard curve are shown in Figure 4. There was a linear increase in the absorbance over the 4-min measurement period for all the concentrations studied (Figure 4, top). The slopes of each of these lines (ΔA/min), after correction for the slope of the blank sample, were then plotted against their respective GSH concentration, resulting in a linear relationship in the range of 6.25–100 pmol GSH per well or 0.375–6.00 mM GSH in the original undiluted samples (Figure 4, bottom). A typical calibration curve for GSH could be defined by y = 0.000546x + 0.000 (r2= 0.999) (Figure 4, bottom), where y and x represent the ΔA/min and GSH amount (pmol) per well, respectively. Similar linear relationships were also observed for standard curves prepared by using GSSG standards subjected to the GSSG method (see Methods section). A typical calibration curve for GSSG was defined by y = 0.000442x + 0.000 (r2 = 0.999), where x in this case is GSH equivalent amounts per well.
Figure 4.
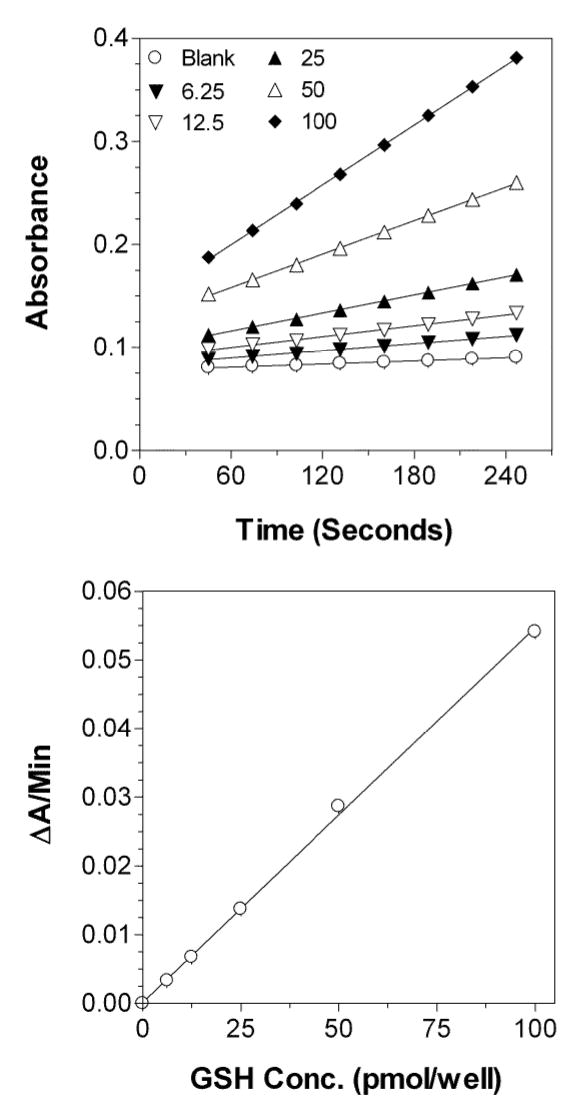
Typical time courses of the change in the absorbance versus time in the enzymatic recycling method (top) and the resulting calibration curve (bottom) for GSH concentrations in the range of 6.25–100 pmol per well (0.375–6.00 mM in the original samples). Each point is an average of triplicate measurements.
The validation data for both GSH and GSSG are presented in Table 1. The precision of the assay for GSH is demonstrated by intra- and inter-run %CV values of <10% for all three studied concentrations within the calibration range. Furthermore, the GSH measurement is accurate as demonstrated by % error values of < 6, except for the intra-run error for the lowest concentration, which was ~ 19%. Similarly, both the accuracy and precision of the assay for measurement of GSSG are within the accepted range, which requires a CV and error of <15%, except for the lower limit of quantitation, where both CV and error should not exceed 20% [13]. Based on these data (Table 1), the lower limits of quantitation for GSH and GSSG are 6.25 and 2.17 pmol per well, respectively.
Table 1.
Intra- and inter-run accuracy (% Error) and precision (%CV) of the assay for measurement of GSH and GSSG (n =4)a
|
Concentration, pmol per well |
|||||
|---|---|---|---|---|---|
| Test | Added | Calculated | % Error | ||
| Intra-run | Inter-run | Intra-run | Inter-run | ||
| GSH | 6.25 | 5.08 (3.87%) | 5.92 (9.36%) | −18.7 | −5.30 |
| GSH | 25.0 | 25.3 (2.49%) | 25.5 (8.21%) | 1.02 | 2.10 |
| GSH | 100 | 98.0 (1.29%) | 103 (4.42%) | −2.00 | 2.85 |
| GSSG | 2.17 | 2.28 (7.60%) | 2.51 (6.25%) | 5.31 | 16.1 |
| GSSG | 35.0 | 36.4 (3.44%) | 33.3 (5.09%) | 4.71 | −4.20 |
| GSSG | 140 | 153 (4.53%) | 143 (4.15%) | 10.5 | 2.93 |
CV values are presented in parentheses.
As for the potential inhibitory effects of M4VP on GR, the response of the assay to 3 mM concentration of GSSG (equivalent to 6 mM of GSH) in the presence of excess M4VP was 99.2 ± 1.7% of that in the absence of M4VP. This indicates that M4VP does not inhibit GR and/or the recycling process.
The recoveries of GSH and GSSG from the liver and bile samples are listed in Table 2. After addition of 6 mM GSH to the liver homogenate, the mean GSH concentration found in the liver using the assay was 5.88 mM with a high degree of accuracy and precision (Table 2). Further, the addition of this relatively large amount of GSH did not affect the measurement of GSSG in the sample, suggesting that GSH does not convert to GSSG during our assay procedure. Similarly, 0.1 mM GSSG added to the liver homogenate was accurately and precisely quantitated using our GSSG assay (Table 2). Although the addition of 0.1 mM GSSG is expected to increase the GSH levels by 0.2 mM, there was no significant difference between the GSH levels (~ 6 mM) before and after the addition of 0.1 mM GSSG (Table 2). This is most likely due to the fact that the addition of 0.2 mM GSH to our samples results in only 3% increase in the baseline levels of GSH (~ 6 mM), which is not expected to be picked up by our assay. Similar to the liver data, the recovery data for spiked bile samples were also both accurate, with errors of < 8%, and precise, with CVs of < 7% for both GSH and GSSG (Table 2).
Table 2.
Recovery of GSH and GSSG from spiked liver homogenates and bile (n =4)a
| Test | Sample | Added conc., mM | Calculated conc., mM | s% Error | ||
|---|---|---|---|---|---|---|
| GSH | GSSG | GSH | GSSG | |||
| GSH | Liver | 6 | 5.88 (1.29%) | NSb | −2.00 | – |
| GSSG | Liver | 0.1 | NSb | 0.0949 (11.3%) | – | −5.03 |
| GSH | Bile | 4 | 3.98 (1.88%) | NSb | −0.52 | – |
| GSSG | Bile | 0.833 | 1.53 (6.12%) | 0.795 (0.766%) | −7.93 | −4.61 |
CV values are presented in parentheses.
The original and spiked concentrations were not significantly different (unpaired t-test).
As for comparison of our M4VP-based assay with standard 2VP-based assays, Figure 5 clearly shows that the hepatic GSSG levels estimated using the 2VP assays is almost 3 fold higher than that estimated by our method.
Figure 5.
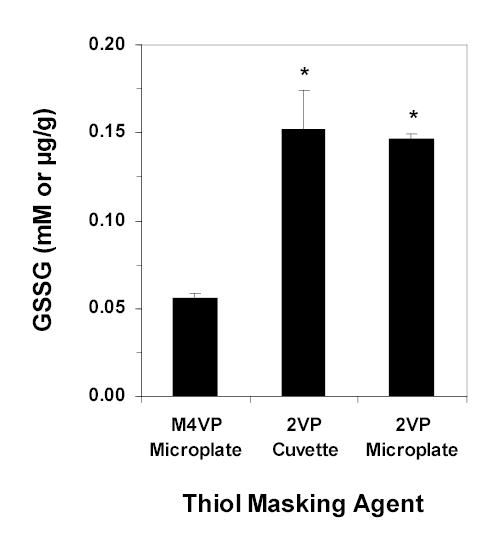
The mean (columns) and SD (bars) of liver GSSG levels analyzed using M4VP as explained in this article and also using 2VP as described in an established method using cuvette [10] or microtiter plate [11]. *, Significantly different from the M4VP method (ANOVA followed by post-hoc analysis using Scheffe F test).
Application of the assay
The averages of total (GSH + GSSG), reduced (GSH), and oxidized (GSSG) glutathione levels in liver tissues after 1 h of global ischemia or sham operation are reported in Table 3. Each value in the table is the average of measurements in the left, median, and right lobes of the liver. One h of global ischemia caused a significant (p < 0.05, t-test) decrease in the total (71%), reduced (72%), and oxidized (53%) glutathione in the liver tissue (Table 3). Additionally, the GSH:GSSG ratio decreased from 226 to 137 as a result of ischemia.
Table 3.
Mean ± SD values of total, reduced, and oxidized glutathione in liver tissues from sham-operated and ischemic ratsa
| Treatment | Total glutathione | GSH | GSSG |
|---|---|---|---|
| μmol/g Liver tissue (mM) | |||
| Sham operation | 6.43 ± 0.33 | 6.38 ± 0.32 | 0.0282 ± 0.0060 |
| Ischemia | 1.84 ± 0.06* | 1.81 ± 0.06* | 0.0132 ± 0.0036* |
Each mean is calculated from three measurements in the left, median, and right lobes of the liver.
Significantly different from the sham-operated value (p < 0.05 based on two-tailed unpaired t-test).
Bile flow rates, the biliary concentrations of reduced and oxidized glutathione, and the percentages of total biliary glutathione present as the oxidized form are depicted in Figure 6 for the sham-operated and ischemic livers. The bile flow rate in the sham-operated animal (Figure 6, top) was relatively large (2.16 ml/h) during the first 10-min collection interval. However, it gradually declined during the 60 min of study and reached 30% of the initial rate during the last collection interval (Figure 6, top). As expected, the initial bile flow rate in the ischemic liver was very low (10% of that of sham-operated liver), and no bile flow was observed after 20 min of collection (Figure 6, top). The biliary concentrations of reduced glutathione in the sham-operated liver (Figure 6, middle) were relatively close to its liver concentration (Table 3). However, the GSSG concentrations in the bile were 20–30 fold larger than the corresponding concentrations in the liver tissue, accounting for 20–30% of the total glutathione in the bile of the sham-operated animal (Figure 6, middle). As for the ischemic liver (Figure 6, bottom), the biliary GSH levels were lower than those in the sham-operated animal (Figure 6, middle). However, the GSSG levels in the ischemic liver were in the same range as those in the sham-operated liver, accounting for 40–57% of the total glutathione in the bile.
Figure 6.
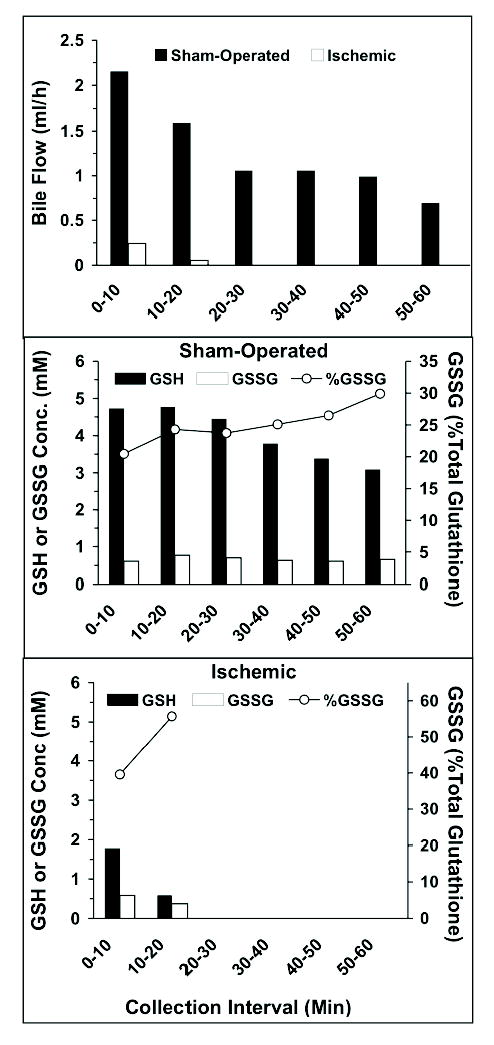
The bile flow rates (top) and biliary concentrations of GSH (solid bars) and GSSG (open bars) and %GSSG contents of total glutathione in bile (line, right y axes) in the sham-operated (middle) and ischemic (bottom) livers.
Discussion
The GSH:GSSG concentration ratio is considered an important index of cellular oxidative stress. However, because under normal conditions, the concentration of GSSG is substantially lower than that of GSH, the accurate and precise measurement of GSSG in the presence of relatively high concentrations of GSH becomes challenging. This is especially important because during sample processing, autooxidation of GSH to GSSG may result in a substantial overestimation of GSSG values. Indeed, high concentrations of GSSG in biological samples have been shown to be a sample preparation artifact [7, 14, 15]. Specifically for the liver tissue, Asensi et al. [14] reported that the application of an HPLC method, which used iodoacetic acid for masking GSH [5], to the liver tissue resulted in 3% oxidation of GSH to GSSG during sample preparation, thus substantially overestimating the GSSG levels. Additionally, available data for blood [15] and bile [16] suggest that the rate of autooxidation of GSH to GSSG is higher in neutral-alkaline pH, necessary for sample preparation. Therefore, efficient and rapid masking of GSH is necessary for prevention of autooxidation of GSH during sample preparation. Indeed, our method, which is based on a rapid (≤ 2 min) and efficient (100%) masking of GSH with M4VP, is clearly devoid of any measurable autooxidation during sample preparation as evidenced by the following data. First, Figure 2 (top panel) clearly shows that under the optimum conditions selected for our assay (M4VP: GSH ratio of 6 at pH 10), >99% of the GSH added to the sample is removed from participating in the recycling reaction, which also measures GSSG, if formed during the sample preparation. In fact, the negligible total GSH participating in the reaction at 2 min (0.529% ± 0.073%; Figure 2, top panel) is most likely due to the GSSG impurity in the GSH sample. Additionally, the % unreacted total glutathione, which is due to GSSG, in both the liver and bile samples (Figure 3) remained relatively constant between 2 to 10 min of incubation. Finally, Table 2 shows that after the addition of 6 or 4 mM of GSH to the liver or bile, respectively,, there was no significant increase in the measured GSSG levels. These data confirm that there is no measurable autooxidation of GSH to GSSG during our sample preparation for bile and liver samples.
The substantially higher levels of liver GSSG observed with the established [10, 11] 2VP methods (Figure 5), compared with our values using M4VP masking, suggest an autooxidation and/or less than quantitative masking of GSH by the 2VP methods. Indeed, some reports [10, 11] have shown that the thiol masking efficiency of 2VP is between 98 to 99%, as opposed to our almost quantitative masking of GSH by M4VP (Figure 2). Autooxidation of a small percentage (e.g., 1–2%) of GSH and/or a high but less than complete reaction of 2VP with GSH (e.g., 98–99%) could easily explain the significant difference between the GSSG levels estimated by our method and those based on 2VP (Figure 5).
Another advantage of our assay is the use of microtiter plate, which allows rapid analysis of a large number of samples simultaneously. Other investigators [11, 17] have also reported the use of microtiter plate assays for the analysis of GSH and GSSG. However, these assays were applied only to cultured/isolated cells [17] or only to the analysis of GSH in the liver tissue [11]. Our assay is the first microtiter plate procedure that has been developed and validated for measurement of both GSH and GSSG in the liver tissue, in addition to the bile samples.
The GSH content of the rat liver is expected to be ~6 μmol/g (mM) [9, 14], although levels in the range of 3.6 to 7.7 mM have been reported in different studies [9, 18]. Our reported value of 6.38 ± 0.32 mM in the sham-operated rat (Table 3) is in agreement with the literature data and almost identical to the value of 6.44 mM obtained as an average of two experiments by Tietze [9]. Compared with the GSH values, the variability in the reported [9, 14, 18] GSSG levels (0.0190–0.316 mM), however, is much larger, resulting in wildly variable GSH:GSSG ratios. Generally, situations where the autooxidation of GSH to GSSG is not effectively controlled during the sample processing, such as HPLC analysis of GSSG in the absence of thiol-masking agents, result in substantially higher GSSG levels and lower GSH:GSSG ratios [19]. It is also reasonable to assume that slow-reacting thiol-masking reagents, such as currently used NEM and 2-VP, may allow for some degree of autooxidation while the reaction is slowly progressing. Therefore, it is not surprising that our method, which uses the fast-reacting M4VP, resulted in control GSSG levels (Table 3) closer to the lower range of the reported GSSG levels. Indeed, our estimated GSH:GSSG ratio of 226 in the sham-operated liver is very close to the expected ratio of 250 under normal physiologic conditions [1]. As reported before [20], ischemia resulted in a substantial depletion of GSH (Table 3) and a decrease in the GSH:GSSG ratio (137 versus 226).
In addition to the liver tissue, the biliary levels of GSH and GSSG have also been used for determination of the redox status of the liver [1, 21–24]. In contrast to the liver data (Table 3), GSSG constituted a substantial portion (20–30%) of the total glutathione in the bile of the sham-operated rat (Figure 6, middle). This is in agreement with previous studies [1, 24], reporting that GSSG accounts for approximately one third of the biliary glutathione. It has been suggested [22] that while the biliary excretion of GSH is a passive phenomenon directly related to the intrahepatic concentrations of GSH, the excretion of GSSG into the bile is a carrier-mediated process against a steep concentration gradient. Our limited data in rat livers demonstrating similar GSH levels and substantially higher GSSG levels in the bile (Figure 6, middle and bottom), compared with their respective intrahepatic concentrations (Table 3), are in agreement with this suggestion. Furthermore, the higher percentage of GSSG in the bile of the ischemic liver relative to that in the sham-operated liver (40–57% versus 20–30%) indicates the applicability of our assay to determination of the redox status of the liver by analyzing the bile samples.
In addition to M4VP, used in our studies, another related reagent, 1-methyl-2-vinylpyridinium trifluoromethane sulfonate (M2VP), has been commercially available (OxisResearch, Portland, OR) only as part of a kit and has been advocated for measurement of GSSG in blood samples. However, the information about the composition and concentrations of various reagents used in the kit, including the concentration and composition and pH of the solvent of M2VP reagent in the kit are not disclosed. Therefore, we were not able to compare our data using M4VP powder, which is commercially available to researchers as a stand-alone reagent, to M2VP kit. A significant advantage of the use of M4VP powder over M2VP kit is a substantial difference in the cost of analysis of samples. Indeed, the price of one M2VP kit for the analysis of 200 samples covers the cost of analysis of >10,000 samples using our M4VP procedure. Another advantage of our method over M2VP kit is the fact that we have now validated the use of M4VP for the estimation of GSSG in the liver tissue and bile. However, no information is available regarding the application of M2VP kit to the liver or bile samples. Lastly, our microtiter plate-based method is more suitable for the analysis of large number of samples than the available kit, which is based on the traditional single sample analysis. Nevertheless, the availability of M4VP as a stand-alone reagent and the experiments described here should facilitate the accurate, precise, and rapid measurement of GSH and GSSG in these samples.
In conclusion, a sensitive, accurate, and precise assay for determination of GSH and GSSG in the rat liver tissue and bile was developed. The assay is based on a rapid and efficient masking of GSH with a new reagent and utilizes microtiter plate method for simultaneous analysis of several samples in a short period of time. The application of the assay to measurement of GSH, GSSG, and GSH:GSSG ratio in bile and liver tissue was also demonstrated using sham-operated and ischemic livers.
Acknowledgments
This study was partially funded by grant from the National Institute of General Medical Sciences of NIH (R01 GM069869-01A2).
References
- 1.Kaplowitz N, Aw TY, Ookhtens M. Annu Rev Pharmacol Toxicol. 1985;25:715–744. doi: 10.1146/annurev.pa.25.040185.003435. [DOI] [PubMed] [Google Scholar]
- 2.Fujikawa M, Kamiike W, Hatanaka N, Shimizu S, Akashi A, Miyata M, Kurosawa K, Yoshida Y, Tagawa K, Matsuda H. J Surg Res. 1994;57:569–573. doi: 10.1006/jsre.1994.1184. [DOI] [PubMed] [Google Scholar]
- 3.Sies H, Koch OR, Martino E, Boveris A. FEBS Lett. 1979;103:287–290. doi: 10.1016/0014-5793(79)81346-0. [DOI] [PubMed] [Google Scholar]
- 4.Richie JP, Jr, Lang CA. Anal Biochem. 1987;163:9–15. doi: 10.1016/0003-2697(87)90085-6. [DOI] [PubMed] [Google Scholar]
- 5.Reed DJ, Babson JR, Beatty PW, Brodie AE, Ellis WW, Potter DW. Anal Biochem. 1980;106:55–62. doi: 10.1016/0003-2697(80)90118-9. [DOI] [PubMed] [Google Scholar]
- 6.Lakritz J, Plopper CG, Buckpitt AR. Anal Biochem. 1997;247:63–68. doi: 10.1006/abio.1997.2032. [DOI] [PubMed] [Google Scholar]
- 7.Steghens JP, Flourie F, Arab K, Collombel C. J Chromatogr B Analyt Technol Biomed Life Sci. 2003;798:343–349. doi: 10.1016/j.jchromb.2003.10.007. [DOI] [PubMed] [Google Scholar]
- 8.Giustarini D, Dalle-Donne I, Colombo R, Milzani A, Rossi R. Free Radic Biol Med. 2003;35:1365–1372. doi: 10.1016/j.freeradbiomed.2003.08.013. [DOI] [PubMed] [Google Scholar]
- 9.Tietze F. Anal Biochem. 1969;27:502–522. doi: 10.1016/0003-2697(69)90064-5. [DOI] [PubMed] [Google Scholar]
- 10.Griffith OW. Anal Biochem. 1980;106:207–212. doi: 10.1016/0003-2697(80)90139-6. [DOI] [PubMed] [Google Scholar]
- 11.Baker MA, Cerniglia GJ, Zaman A. Anal Biochem. 1990;190:360–365. doi: 10.1016/0003-2697(90)90208-q. [DOI] [PubMed] [Google Scholar]
- 12.Mehvar R, Zhang XP. Pharm Res. 2002;19:47–53. doi: 10.1023/a:1013603331899. [DOI] [PubMed] [Google Scholar]
- 13.Shah VP, Midha KK, Findlay JW, Hill HM, Hulse JD, McGilveray IJ, McKay G, Miller KJ, Patnaik RN, Powell ML, Tonelli A, Viswanathan CT, Yacobi A. Pharm Res. 2000;17:1551–1557. doi: 10.1023/a:1007669411738. [DOI] [PubMed] [Google Scholar]
- 14.Asensi M, Sastre J, Pallardo FV, Garcia de la Asuncion J, Estrela JM, Vina J. Anal Biochem. 1994;217:323–328. doi: 10.1006/abio.1994.1126. [DOI] [PubMed] [Google Scholar]
- 15.Rossi R, Milzani A, Dalle-Donne I, Giustarini D, Lusini L, Colombo R, Di Simplicio P. Clin Chem. 2002;48:742–753. [PubMed] [Google Scholar]
- 16.Eberle D, Clarke R, Kaplowitz N. J Biol Chem. 1981;256:2115–2117. [PubMed] [Google Scholar]
- 17.Vandeputte C, Guizon I, Genestie-Denis I, Vannier B, Lorenzon G. Cell Biol Toxicol. 1994;10:415–421. doi: 10.1007/BF00755791. [DOI] [PubMed] [Google Scholar]
- 18.Jayatilleke E, Shaw S. Anal Biochem. 1993;214:452–457. doi: 10.1006/abio.1993.1522. [DOI] [PubMed] [Google Scholar]
- 19.Alpert AJ, Gilbert HF. Anal Biochem. 1985;144:553–562. doi: 10.1016/0003-2697(85)90153-8. [DOI] [PubMed] [Google Scholar]
- 20.De Tata V, Brizzi S, Saviozzi M, Lazzarotti A, Fierabracci V, Malvaldi G, Casini A. J Surg Res. 2005;123:215–221. doi: 10.1016/j.jss.2004.08.008. [DOI] [PubMed] [Google Scholar]
- 21.Jaeschke H, Wendel A. Toxicology. 1988;52:225–235. doi: 10.1016/0300-483x(88)90128-x. [DOI] [PubMed] [Google Scholar]
- 22.Lauterburg BH, Smith CV, Hughes H, Mitchell JR. J Clin Invest. 1984;73:124–133. doi: 10.1172/JCI111182. [DOI] [PMC free article] [PubMed] [Google Scholar]
- 23.Karwinski W, Garcia R, Helton WS. J Surg Res. 1996;64:150–155. doi: 10.1006/jsre.1996.0321. [DOI] [PubMed] [Google Scholar]
- 24.Ballatori N, Truong AT, Ma AK, Boyer JL. Am J Physiol. 1989;256:G482–490. doi: 10.1152/ajpgi.1989.256.3.G482. [DOI] [PubMed] [Google Scholar]