

SUMMARY
Transcriptional pausing by RNA polymerase (RNAP) plays an important role in the regulation of gene expression. Defined, sequence-specific pause sites have been identified biochemically. Single-molecule studies have also shown that bacterial RNAP pauses frequently during transcriptional elongation, but the relationship of these “ubiquitous” pauses to the underlying DNA sequence has been uncertain. We employed an ultrastable optical-trapping assay to follow the motion of individual molecules of RNAP transcribing templates engineered with repeated sequences carrying imbedded, sequence-specific pause sites of known regulatory function. Both the known and ubiquitous pauses appeared at reproducible locations, identified with base-pair accuracy. Ubiquitous pauses were associated with DNA sequences that show similarities to regulatory pause sequences. Data obtained for the lifetimes and efficiencies of pauses support a model where the transition to pausing branches off of the normal elongation pathway and is mediated by a common elemental state, which corresponds to the ubiquitous pause.
INTRODUCTION
Transcription by RNA polymerase (RNAP) is one of the most exquisitely controlled processes in the cell. Although much regulation occurs during the initiation phase of transcription, elongation in prokaryotes and eukaryotes is frequently interrupted by sequence-specific pauses that are thought to play important roles in this process, either in aggregate or at specific locations. Pauses at specific sites allow for the recruitment of regulatory factors that modify subsequent transcription (Artsimovitch and Landick, 2002; Bailey et al., 1997; Palangat et al., 1998; Ring et al., 1996; Tang et al., 2000) or serve as a precursor state for transcriptional arrest and termination (Kireeva et al., 2005; Richardson and Greenblatt, 1996). In aggregate, pausing allows coupling of transcription with translation in prokaryotes (Landick et al., 1996) and splicing and polyadenylation in eukaryotes (de la Mata et al., 2003; Yonaha and Proudfoot, 1999). Elongation regulators also modulate pausing to control rates of RNA chain synthesis in all organisms (Artsimovitch and Landick, 2000; Renner et al., 2001; Tang et al., 2000).
Pausing has been studied for more than two decades, but no unique consensus pause sequence has emerged. Instead, pause signals appear to be multipartite, with potential contributions from all DNA and RNA segments in contact with RNAP (Artsimovitch and Landick, 2000; Chan and Landick, 1993; Palangat and Landick, 2001). Two general classes of sequence-dependent pauses have been characterized biochemically, which we collectively term “defined” pauses (Artsimovitch and Landick, 2000). One class of defined pause is stabilized by a hairpin that forms in the nascent RNA transcript. These hairpin-stabilized pauses are found, for example, in leader regions of biosynthetic operons in bacteria, where they serve to synchronize the progress of RNAP with ribosomes during transcriptional attenuation (Henkin and Yanofsky, 2002). One example is the his pause element found near the beginning of the histidine operon in E. coli (Artsimovitch and Landick, 2000). Interactions between RNAP and the his pause hairpin are thought to stabilize RNAP in its pretranslocated state (Toulokhonov and Landick, 2003).
A second class of defined pause is stabilized by an upstream motion of RNAP, leading to extrusion of the RNA 3′ end from the nucleotide triphosphate (NTP) entry channel (Artsimovitch and Landick, 2000; Komissarova and Kashlev, 1997; Palangat and Landick, 2001). This motion, termed backtracking, is thought to be a consequence of a comparatively weak RNA:DNA hybrid, which favors rearward enzyme motion to a more energetically stable position. Backtracking prevents elongation by displacing the 3′ end of the RNA from the active site. It is resolved by reversal of the upstream motion or by endonucleolytic cleavage of the extruded RNA. Backtracking pauses occur in prokaryotes and eukaryotes, sometimes allowing for the recruitment of transcription factors (Adelman et al., 2005; Artsimovitch and Landick, 2000; Palangat and Landick, 2001). One example is the ops pause in E. coli, where RNAP backtracks by a few base pairs, allowing the binding of RfaH, a factor that suppresses early termination (Artsimovitch and Landick, 2000, 2002). The his and ops pauses represent well-characterized cases from a spectrum of possible pause signals.
Single-molecule studies of transcription by E. coli RNAP performed at physiological NTP concentrations have identified two classes of pauses, distinguished on the basis of their lifetimes, with an as yet uncertain relationship to the defined pauses just described (Neuman et al., 2003; Shaevitz et al., 2003). A small fraction of single-molecule pauses, representing 5% of the population, have lifetimes in excess of 20 s. These long-lived pauses are products of enzyme backtracking associated with nucleotide misincorporation: They appear to play a role in transcriptional proofreading, allowing RNAP to briefly reverse and then cleave misincorporated bases before resuming RNA synthesis (Shaevitz et al., 2003).
The remaining short-lifetime pauses, representing 95% of pauses in single-molecule data, occur at a roughly constant density of 1 pause per 100 bp; these have been termed ubiquitous pauses (Neuman et al., 2003). The relationship of ubiquitous to defined pauses has been difficult to establish for two reasons. First, single-molecule experiments have lacked the resolution to determine whether ubiquitous pauses are caused by specific DNA sequences (Neuman et al., 2003). Ubiquitous pausing could result from efficient pausing at a frequently occurring sequence or from a sequence-independent, stochastic behavior of RNAP. Frequent pausing may synchronize transcription with translation to prevent premature rho-dependent termination (Richardson and Greenblatt, 1996) and could, in principle, be achieved by either mechanism. Second, defined pauses have been studied under drastically different conditions from ubiquitous pauses, with subsaturating nucleotides at 37°C versus saturating nucleotides at 21.5°C, respectively (Artsimovitch and Landick, 2000; Neuman et al., 2003).
Single-molecule assays have recently achieved base-pair resolution for relative motions of RNAP molecules (Abbondanzieri et al., 2005), but larger uncertainties in the absolute position of the enzyme along DNA persist, making it difficult to assign individual translocation events to underlying sequence. To overcome this limitation, we produced a pair of periodic DNA templates, designed to supply signals that could serve as registration marks during elongation. Templates were constructed carrying repeats of a motif containing a defined pause signal (see Experimental Procedures). Two variants of the template were prepared: one with the his pause element (a “his repeat” template) and one with the ops pause element (an “ops repeat” template). The pausing behavior of RNAP on periodic templates, taken together with the release of DNA at a termination site shortly after the repeats, permitted us to bring multiple records of transcription into register. By collecting data using a low-drift “dumbbell” assay (Shaevitz et al., 2003) and performing an alignment procedure on an ensemble of records, we were able to localize pause positions with near base-pair accuracy over the ~2000 bp long repeat region of the template.
Aligned records not only supply sequences associated with pause events but also can be used to determine lifetime distributions and efficiencies for individual pause sites, facilitating direct comparisons among ubiquitous and defined pauses. In addition, the repetitive character of the templates allows us to address longstanding questions about enzyme “memory,” i.e., whether RNAP exists in stable states with different intrinsic probabilities for pausing and whether it can switch among such states, possibly in response to conditions or sequences previously encountered (de Mercoyrol et al., 1990; Foster et al., 2001; Harrington et al., 2001). Evidence for long-lived, heterogeneous velocity states in RNAP has been reported in previous single-molecule studies on nonrepeating templates (Neuman et al., 2003; Tolic-Norrelykke et al., 2004), although the basis of the heterogeneity is unknown and its magnitude varies. Some studies have reported that individual wild-type (Davenport et al., 2000) or mutant (Adelman et al., 2002) RNAPs can switch velocity states, but others have failed to detect switching (Adelman et al., 2002; Neuman et al., 2003; Tolic-Norrelykke et al., 2004). Regulator binding is known to switch RNAP into different persistent states (Artsimovitch and Landick, 2000; Yarnell and Roberts, 1999), but the existence of spontaneous switching behavior is disputed (Pasman and von Hippel, 2002).
RESULTS
Correlation-Based Alignments Give Base-Pair Accuracy
Stalled transcription elongation complexes (TECs) formed on the his and ops repeat templates (Figure 1A) were tethered between two polystyrene beads, creating bead: RNAP:DNA:bead “dumbbells.” After transcription reinitiation by the introduction of NTPs (1 mM ATP, CTP, UTP; 250 μM GTP), the two beads were each captured by one of a pair of optical traps (Figure 1B). Constant tension was maintained on the upstream portion of the template by feedback, supplying a moderate assisting load during transcription (Shaevitz et al., 2003). Seven representative records (of 114 collected) illustrate motion on the periodic templates (Figure 1C).
Figure 1. Single-Molecule Transcription on Engineered Templates.
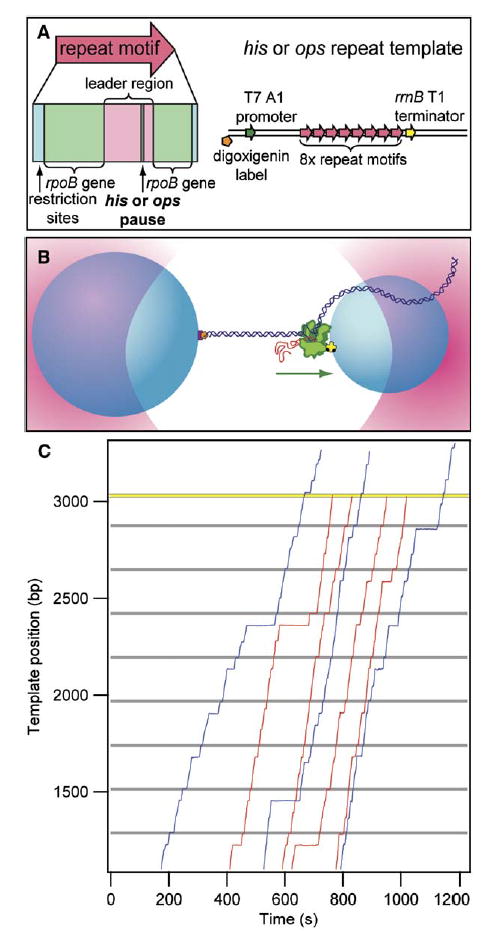
(A) Engineered transcription templates. Single ~230 bp repeat motifs (red arrow) consist of a leader sequence (pink) with an associated defined pause (consisting of a his or an ops element; gray), along with rpoB gene sequences (light green) and flanking DNA corresponding to restriction sites used in cloning (blue). Transcription templates consist of eight repeat motifs located ~1100 bp beyond a T7 A1 promoter (dark green), from which transcription was initiated, and ~80 bp in front of the rrnB T1 terminator (yellow). Templates were labeled on the transcriptionally upstream end with digoxigenin (orange).
(B) Cartoon of the experimental geometry (not to scale). Two polystyrene beads (light blue) are held in optical traps (pink) above the surface of a coverglass. A biotin label (black) on RNAP (green) is used to attach RNAP to the smaller bead by an avidin linkage (yellow). The 3′ upstream end of the DNA (dark blue), labeled with digoxigenin (orange), is bound to a slightly larger bead by an anti-digoxigenin linkage (purple). Transcription proceeds in the direction shown (green arrow), and polymerase experiences an assisting load.
(C) Seven (of n = 61) representative records of transcription along the ~3 kb ops repeat template versus time for single transcribing RNAP molecules. Records are shown after alignment, as described: Most records display distinct pauses at locations corresponding to ops sites (gray lines) and elsewhere. Four (of n = 25) records that dissociated at the location of the rrnB T1 terminator (yellow) are displayed (red traces); three (of n = 36) records that read through or dissociate prior to the terminator are shown (blue traces).
Although the position of RNAP on the template can be determined from the changing length of the DNA tether between the beads, several factors, such as minor variations in the diameter of a bead, generate uncertainties in calculations of absolute position. These factors lead to a rescaling of the ordinate for each record, so that the true transcriptional displacement, x, is linearly related to its measured value, x′, through x = αx′ + β, where α is a scale factor close to one and β is a small offset. In practice, these uncertainties are quite modest: Dispersion in bead size produces shifts of just ~30 nm, and the scale factor departs from unity by at most a few percent. However, even such small discrepancies can mask evidence of sequence-dependent pausing. A histogram of the logarithm of the dwell time compiled from multiple records illustrates the problem (Figure 2A). Pause locations fail to manifest themselves as peaks in the graph because favored dwell locations of individual traces fall slightly out of register and fail to add coherently at corresponding template positions.
Figure 2. Record Alignment and Pause Locations Identified.
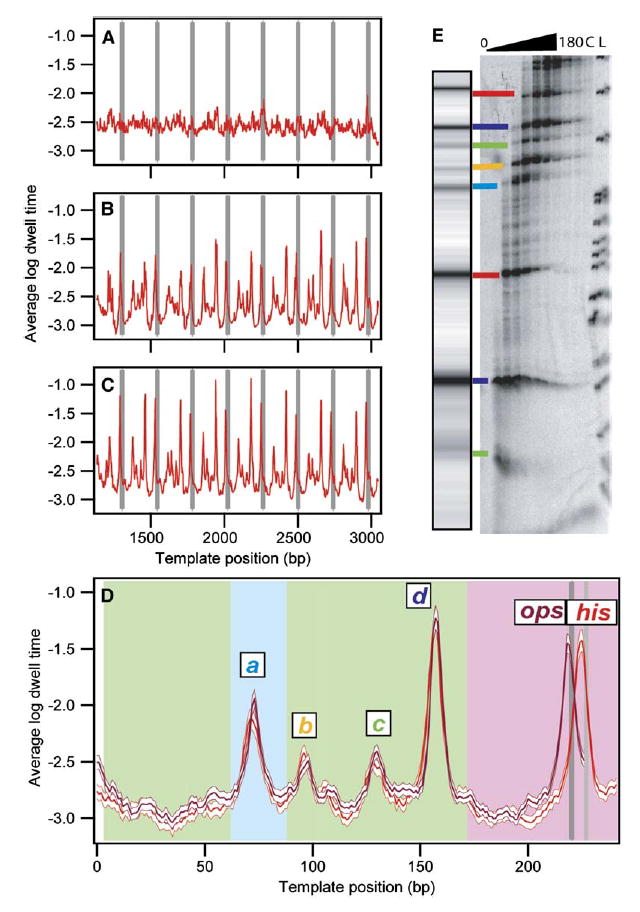
(A–C) Dwell-time histograms were compiled for each transcriptional record as a function of position. The logarithms of these histograms were then averaged for groups of records, as follows: (A) Average log dwell-time histogram for his records (n = 53) before any rescaling or offsets applied.
(B) Average log dwell-time histogram for terminating his traces (n = 27) after initial rescaling and alignment of records at the termination site. (C) Average log dwell-time histogram for all his traces (n = 53) after final alignment.
(D) Average log dwell-time histogram for aligned data computed from all eight repeats for the his repeat motif (red; n = 53 molecules, 310 records) and the ops repeat motif (magenta; n = 61 molecules, 419 records), shown with the bootstrapped standard deviations (white). Background color indicates origin of the underlying sequences: rpoB gene (green), restriction sites used for cloning (light blue), regulatory pause region (pink), ops pause site (dark gray), his pause site (light gray). Major pause sites are labeled.
(E) Comparison of single-molecule and bulk transcription data. A simulated transcription gel was created from the dataset in (D) using a grayscale proportional to the peak height and scaling the position logarithmically to approximate RNA gel mobility. [α-32P]GMP-labeled transcription complexes were incubated with 250 μM NTPs, quenched at times between 0 s and 180 s, and run on a denaturing polyacrylamide gel. Lane L shows the MspI pBR322 ladder; lane C is a chase. Lines are drawn between corresponding bands identified in single-molecule and gel data, color coded as in (D).
Proper alignment and scaling of the records (Figures 2B and 2C) were achieved using an algorithm consisting of two stages. First, an initial alignment was performed on the subset of records where the TEC dissociated within experimental uncertainty (±20 nm) of the nominal termination site. The scale factor, α, for each of these records was adjusted until the distances at which pauses were most likely to recur coincided with the known length of the repeat motif, and the offset, β, was adjusted to bring the dissociation position into coincidence with the terminator. After this stage, dwell-time histograms for terminating records exhibit excellent registration out to 500 bp in advance of the terminator (Figure 2B). In the second stage, these adjusted records were used to seed a crosscorrelation procedure. Here, the (α,β) parameters for all records, including those that failed to terminate, were varied in a narrow range (0.95 < α < 1.01; −35 nm < β < 35 nm) to maximize the crosscorrelation of each individual dwell-time histogram with the combined dataset from the terminating records. This procedure generates a globally optimized (α,β) for each record, exhibiting excellent overall alignment (Figure 2C). (A full description with sources of error is found in the Supplemental Data available with this article online.)
The dwell-time histogram derived from records of the his repeat template exhibits periodic narrow peaks, with half-maximal widths of just 2–3 bp, up to 2000 bp from the terminator (Figure 2C). Equivalent results were obtained for records derived from the ops repeat template (data not shown). These results represent a dramatic improvement in range and accuracy over a previous study employing a surface-based assay to align records within ~100 bp of a transcriptional runoff site (Shundrovsky et al., 2004). We attribute the improvement to the stability of the dumbbell assay and the use of periodic templates.
To identify pause sites, data from each of the eight repeat regions were combined to generate average dwell-time histograms for his and ops repeat motifs separately (Figure 2D). This 8-fold averaging procedure assumes that the behavior of an enzyme encountering each successive motif is statistically equivalent. Distinct peaks are evident not only at the locations of the imbedded his and ops sites, as anticipated, but also at four additional sites found in the flanking regions (labeled a through d). The similarity of the histograms throughout the common flanking regions of the two templates illustrates the reproducibility of this technique. In particular, the relative distances computed between distal pairs of pauses (a–d) on the two templates agreed to within 0.14 bp, indicative of the level of precision attained. To compare single-molecule pauses with traditional gel-based assays of transcription, a simulated gel image was computed for the his repeat region (Figure 2E, left). The simulated image displayed excellent agreement with an actual gel from a conventional transcription assay carried out on a corresponding sequence from the his repeat template (Figure 2E, right).
RNAP Pause Positions with Respect to DNA Translocation and RNA Elongation
These high-resolution data allowed us for the first time to correlate positions of paused RNAPs on DNA with the lengths and sequences of RNA transcripts. We determined the sequences of the RNA transcripts at pause sites using transcription gels and RNA sequencing ladders (Supplemental Data; Figure 3). The his and major ops pause positions were identical to those found previously (Artsimovitch and Landick, 2000). However, only one of the two previously observed minor ops pause sites was seen (ops2, 2 bp downstream of the major site); this discrepancy may be attributable to differences in reaction conditions. Direct comparisons of gel data (which determine lengths of the RNAs) and single-molecule data (which determine enzyme positions on DNA) can be used to compute a numerical value for the “translocation state” of RNAP, i.e., the difference, measured in base pairs, between where pauses map along DNA and where they map along RNA (Figure 3; Supplemental Data). Hypotranslocation (backtracking) corresponds to negative values of this quantity; translocation and hyper-translocation correspond to positive values.
Figure 3. Sequence Similarities for Identified Pauses.
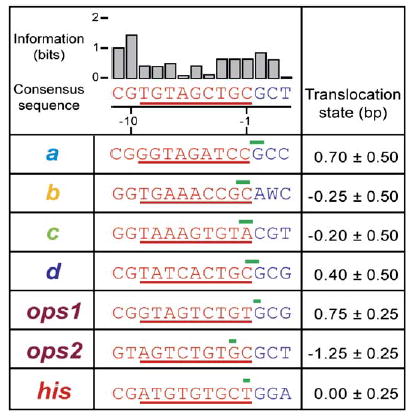
Table of DNA sequences underlying each pause, as mapped by transcription gels, along with the corresponding positions identified in single-molecule records. Top row: Consensus sequence generated from alignment of all pause regions: a–d sites, primary and secondary ops sites (ops1 and ops2, respectively), and his site. Also shown is the associated information, in bits, for each consensus base (Gorodkin et al., 1997). Lower rows: Downstream DNA sequences in advance of each pause are displayed (blue letters), along with the trailing sequence corresponding to the nascent RNA (red; with T substituted for U), with the region subtended by the RNA:DNA hybrid identified (red underline). The translocation state of RNAP at each pause site is indicated (green bars; the widths of these bars show estimated errors in localizing the position from single-molecule data).
To tabulate translocation states, his or ops pause positions were measured relative to the a–d positions; locations of the latter were assumed identical for both templates. Due to small uncertainties arising from (1) the exact positions of complexes dissociating at the terminator and (2) small, sequence-dependent variations in the pitch of DNA, we estimate that the entire set of green bars in Figure 3 could be moved as a group upstream or downstream by as much as 1.3 bp from their assigned values. This ambiguity may be resolved, however, since the his pause is known to trap RNAP in a pretranslocated state (Toulokhonov et al., 2001; Toulokhonov and Landick, 2003). Assigning the his pause to the pretranslocated state, we find that the absolute values of translocation states at the a–d pause positions were all below 1 bp, statistically consistent with zero. At the ops site, RNAP halted 0.75 ± 0.25 bp downstream of ops1, which is 1.25 ± 0.25 bp upstream of ops2. We cannot be certain, however, that both pauses occur in the single-molecule experiment even though they were evident in bulk experiments performed in the same solution conditions (Figure S6). The narrowness of the ops peak (Figure 2D) indicates that the enzyme resolves to a single position on the template after pausing at the ops sites. This could be achieved by pausing at ops1 followed by 0.75 bp forward translocation, pausing at ops2 followed by 1.25 bp backtracking, or a combination of the two. We are unable to distinguish among these possibilities. Pausing at ops2 seems less likely because the assisting force applied is expected to inhibit backtracking.
There are noteworthy similarities among the sequences triggering pauses (Figure 3). G or C is present at the −11 position of the RNA for all seven sequences. G is present at −10 for all but ops2. With the exception of the c pause site, pauses occurred at positions where a purine was being added to a 3′ pyrimidine.
Pause Densities and Lifetimes Vary in a Sequence-Dependent Manner
To study the kinetics of pause entry and escape, we used an automated algorithm to identify pauses, scoring these whenever velocity fell below half the average active elongation rate in records (Neuman et al., 2003; Shaevitz et al., 2003). Within the initial ~1000 bp segment encountered prior to the tandem repeats (consisting of sequences derived from the rpoB gene), we recorded the same density of pauses as previously (~0.9 pauses per 100 bp). The global distribution of pause lifetimes from the entire template was fit between 1 s and 25 s by a sum of two exponentials with time constants of 1.4 ± 0.1 and 6.3 ± 0.5 s (amplitudes 66% and 34%, respectively), in agreement with prior reports (Neuman et al., 2003; Shaevitz et al., 2003), despite a lower GTP level (250 μM versus 1 mM).
Our aligned data clearly indicate that ubiquitous pauses are sequence dependent. Within the tandem repeat motifs, roughly 65% of all pauses occurred within five narrow zones, subtending just 21% of the region (Figure 4). Moreover, the residual pause density scored in the remaining 79% of the same region deviated significantly from a binomial distribution, which is the form expected for a uniform background pause rate (Figure S8; p(χ2) < 0.004). This suggests that even in regions of low pause density where peaks are not evident, the pause probability continues to vary with underlying sequence, just as elsewhere. The pause lifetime distributions for all six high-efficiency, sequence-dependent pauses were well fit by single exponentials (Figure 5). Therefore, it seems likely that the apparently double-exponential character of the global lifetime distribution (above; see also Neuman et al., 2003; Shaevitz et al., 2003) results from a superposition of many single-exponential distributions arising from individual pauses, among which long and short characteristic time constants dominate. Consistent with this interpretation, the longest and shortest time constants scored for the four ubiquitous pauses (6.4 s and 1.3 s; Figure 5) match those obtained by the double-exponential fit.
Figure 4. Pause Efficiency Is Sequence Dependent.

(A) Histogram of the mean density of pauses (t > 1 s) versus template position for the ops repeat template motif (1 bp bins). White bars show the running density + SD based on bootstrapped error estimates. Events within ±5 bp of identified pause sites are color coded according to the scheme of Figure 2. The percentages of all events associated with each labeled pause are shown.
(B) Histogram of the mean density of pauses versus template position for the his repeat template motif.
Figure 5. Lifetimes and Efficiencies for Individual Pauses.

Histograms of identified pause dwell times, color coded according to the labeling scheme of Figure 2, with exponential fits. Measured apparent pause lifetimes (τ*) and corrected pause efficiencies (ɛ) are shown with estimated errors.
Pausing Is a Nonobligate State in the Elongation Pathway
The pause-finding algorithm reliably detects events lasting ≥1 s. The apparent pause efficiency (percentage of molecules pausing at a site) therefore underestimates the true value due to missing events. A corrected pause efficiency, ɛ, was determined by adding the estimated number of short undetected pauses to the detected number, assuming that the exponential distribution of pause durations can be extrapolated to 0 s. Even with correction, all identified pause sites exhibited efficiencies well below 100%. Biochemical states situated on the main reaction pathway for transcription are visited, by definition, in an obligatory fashion during each nucleotide addition cycle. Measurements of corrected efficiency less than 100%, therefore, imply that pauses represent “off-pathway” states that exit and return to the main pathway, consistent with prior ensemble and single-molecule experiments (Artsimovitch and Landick, 2000; Davenport et al., 2000; Erie et al., 1993; Kassavetis and Chamberlin, 1981; Wang et al., 1995).
In the simplest such branched scheme (Figure 6A), pause efficiency is a consequence of kinetic competition between the rate of nucleotide addition, kn, and the rate of entry into a pause, kp. This model makes testable predictions. All else being equal, enzymes with slower elongation rates stand a greater chance of falling into the pause state per cycle, resulting in a positive correlation between the reciprocal of kn and the pause density (pauses per bp). Furthermore, assuming a constant rate of entry into the pause state at each position, the pause frequency, kp (pauses per unit time), is predicted to be independent of the elongation rate, kn. (Conversely, on-pathway pausing predicts no correlation between the pause density and reciprocal elongation rate and positive correlation between pause frequency and kn.) The wide distribution of velocities for elongating polymerase molecules (equivalent to kn averaged over all template positions, Figure S9; consistent with Neuman et al., 2003) allows us to test these models. As predicted by the off-pathway scheme, a positive correlation was found between the pause density and the inverse elongation velocity (Figure 6B), and no correlation was found between the pause frequency and inverse elongation velocity (Figure 6C). We also computed the correlation between the reciprocal elongation rate and apparent pause efficiency for each of the six pauses in the repeat motif (Figure 6D). Interestingly, no significant correlation was found for pauses a, d, ops, and his, where the next nucleotide added is G, but a stronger correlation was found for pauses b and c, where the next nucleotide added is A or C. For these assays, NTP concentrations were saturating for A, C, and U but comparable to the apparent dissociation rate for G (Abbondanzieri et al., 2005). It is possible that a slower rate of nucleotide binding at G sites complicates the kinetics at these positions, so that the site-specific value of kn no longer reflects the average elongation rate.
Figure 6. Pause Pathway and Pause Correlations.
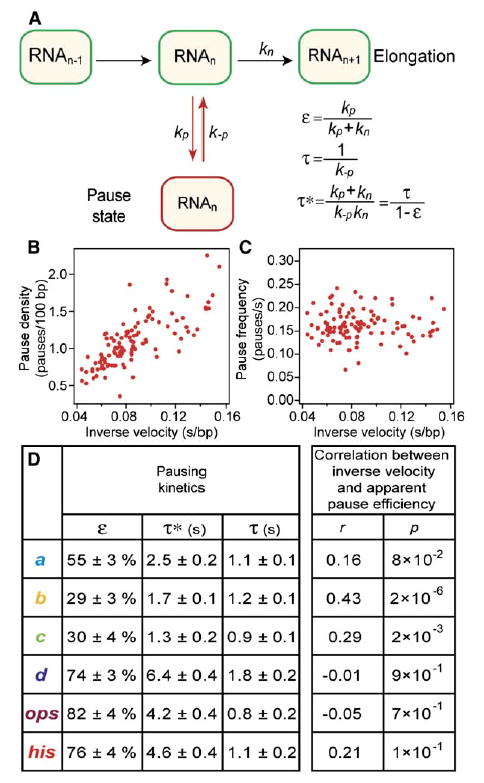
(A) Simple off-pathway model for transcriptional pausing where the pause state competes kinetically with elongation. Steps in the normal elongation cycle are represented by a single transition with rate kn. The rate of entering or exiting a pause is kp or k−p, respectively. Corrected pause efficiency (ɛ), pause lifetime (τ), and apparent pause lifetime (τ*) are shown in terms of individual rate constants.
(B) Pause density (pauses/100 bp) versus inverse elongation velocity. Each point corresponds to 1 of n = 114 individual molecules. The correlation coefficient is r = 0.71 (p = 6 × 10⁻¹⁹).
(C) Pause frequency (pauses/s) versus inverse elongation velocity. Each point corresponds to 1 of n = 114 individual molecules. The correlation coefficient is r = 0.16 (p = 0.1).
(D) Corrected pause efficiencies (ɛ), pause lifetimes (τ), and apparent pause lifetimes (τ*) for each of the identified pause sites. Correlations (and corresponding p values) between inverse velocity and apparent pause efficiency are shown.
The Intrinsic Lifetime of the Pause State Is Conserved
The pause lifetime, τ, is the reciprocal of the exit rate from the pause state, 1/k−p. However, molecules escaping this state immediately re-encounter a kinetic competition between further pausing (kp) and elongation (kn). For high-efficiency pauses, it is likely that the molecule drops back into the pause state. Single-molecule transcription assays do not monitor exit from and reentry into the pause state but instead detect the resumption of elongation. Assuming that the amount of time spent in the active state before entering a pause is small compared with the time spent in the pause state, then the apparent lifetime of a pause, τ*, will be nearly exponentially distributed. The measured lifetime, however, will be given by τ* = τ/(1 − ɛ), where τ is the intrinsic lifetime (Supplemental Data). This apparent lifetime is positively correlated with pause efficiency (r = 0.86; p = 0.03). After correction of apparent lifetimes at all six pause sites for this effect, which vary by a factor of 5, we found that all the intrinsic lifetimes fell within a narrow range, averaging 1.1 s ± 0.4 s (mean ± SD) (Figure 6D). This model also predicts that low-efficiency pause sites (those outside the six pause regions), where the molecule is unlikely to reenter a pause state after escaping, should exhibit the intrinsic lifetime (Figure S10).
Molecules Exist in Stable States with Different Pause Efficiencies
The fact that RNAP molecules transcribe the same motif up to eight times presents an opportunity to look for direct experimental evidence of molecular memory or long-range sequence effects. The apparent efficiency of molecules pausing at a given site was plotted as a function of the repeat number (Figure 7A and Figure S7). A statistically significant variation of apparent pause efficiency across the template was not seen, suggesting that the propensity to pause is not influenced by such factors as the growing size of the RNA or proximity to distal, nonrepeating sequences. This justified the pooling of pause statistics for all repeats (e.g., Figure 2D).
Figure 7. RNAP Heterogeneity.

(A) Apparent pause efficiency versus repeat number of the pause site (numbered from 1 to 8) for sites indicated.
(B) Correlation between pausing at a given site and during a subsequent visit to an equivalent site, plotted versus the distance between the pair of sites, measured in units of the motif repeat number (see Experimental Procedures). Probable errors (SD) were estimated from simulations.
Although the average amount of pausing doesn’t vary from one repeat to the next, this does not exclude the possibility that enzymes vary in their individual propensity to pause. We consider three possible cases: (1) individual molecules exist in long-lived states with different intrinsic pause propensities (a heterogeneous population of stable states); (2) individual molecules can switch among states with different intrinsic pause propensities (a homogeneous population of unstable states); or (3) pause propensity is constant (a homogeneous population with respect to pausing). However, even in the latter case, the probability of pausing at a given position will depend on the elongation velocity since entry to the paused state is in kinetic competition with elongation in a branched pathway (Figure 6A). Heterogeneity of the population with respect to elongation velocity therefore makes it difficult to distinguish case 1 from case 3. To minimize the influence of this inhomogeneity, we restricted our attention to the four pause sites where pausing was uncorrelated with velocity (a, d, his, and ops). We defined a function that indicates whether pausing observed at a site within a given repeat motif is correlated with pausing at the corresponding site on a subsequent repeat. This correlation is plotted for the case where the second pause site is separated from the first by 1–4 repeat motifs (Figure 7B). In all cases, there was positive correlation, indicating that molecules tend to repeat the same behavior at subsequent sites (e.g., if a molecule paused at the first site, it is more likely to pause again). Molecules therefore occupy states of varying pause propensity, eliminating case 3. We also found that the correlation did not diminish with the distance between sites (Δ repeat), indicating that individual pause rates are conserved over at least ~1000 bp. Constant correlations fail to support case 2 and lend support for case 1, where the elongation-competent state to which a molecule returns after pausing is always the same, although the kinetics of that state may differ from one molecule to the next. This is consistent with the conclusions of another study of transcription-complex inhomogeneity (Tolic-Norrelykke et al., 2004).
DISCUSSION
Ubiquitous Pauses Are Sequence Dependent
Previous single-molecule experiments established that transcriptional pausing is ubiquitous, occurring at an approximately constant rate (Neuman et al., 2003). By using periodic templates to localize ubiquitous pauses, we now show that they are explained by efficient, sequence-dependent pausing at a small fraction of available template locations. Ubiquitous pauses are therefore triggered by common sequence signals rather than random events. Furthermore, the kinetic properties of ubiquitous pauses were indistinguishable from those at the his and ops sites, whose multipartite sequence components are relatively well established. This suggested that sequence alignment of all six pauses could be informative.
Interestingly, this alignment revealed sequence similarities (Figure 3), consistent with the idea that certain sequence components may occur frequently in pause signals. The a priori probability that at least six of seven sequences match at one or more of the 14 base positions is ~7%, suggesting that the nearly conserved −10G is significant. The strong GC-bias at positions −10 and −11 has received little attention previously, and its mechanistic role remains unclear, although changes of −10G to U or C were found to weaken some pauses (Chan and Landick, 1993; Palangat and Landick, 2001). In principle, it could favor backtracking, induce transient overextension of the RNA: DNA hybrid to generate strain in the enzyme, or reflect some pause-favoring interactions of RNAP with nucleic acids at these positions. Although GC-rich sequences upstream of hybrids stabilize backtracking (Nudler et al., 1995; Reeder and Hawley, 1996), our results, together with others (Neuman et al., 2003; Toulokhonov and Landick, 2003), suggest that RNAP does not backtrack at these pause sites. Interestingly, inhibition of upstream hybrid melting is the first mechanism of transcriptional pausing to have been proposed (Gilbert, 1976), and it also has been suggested to influence abortive initiation (Kireeva et al., 2000). However, further work will be required to distinguish among possible mechanisms. All but one of the pauses occurred where a purine is added to a pyrimidine nucleotide, consistent with previous reports (Aivazashvili et al., 1981) and with the idea that this addition is either unusually slow and promotes pausing, or directly contributes to an elemental pause rearrangement.
Algorithms for predicting pausing and elongation kinetics have been devised based on calculations of the energetic stability of the TEC as a function of position along a given sequence (Bai et al., 2004; von Hippel, 1998). One of these models predicts a class of short-lived pauses, situated on the main elongation pathway, that results from an exploration of both forward- and back-tracked translocation states, leading to a sequence-dependent transcription rate (Bai et al., 2004). The authors argued that the nucleotide addition rate would decrease for sequences where the energy of the pretranslocated state was significantly more favorable than the posttranslocated state and thereby produce a new type of pause, termed a “pretranslocation pause,” which they proposed to explain ubiquitous pauses. In the present study, however, we found no evidence to support such an on-pathway pause, even after correction for missed events. In particular, all mapped pauses appear to be pretranslocated (Figure 3) yet ranged in efficiency from ~30% to 82%, implying that pretranslocated pauses occur off pathway, as nonobligate states (Figure 4).
Although pausing is determined by sequence, we present direct evidence that the tendency to pause at a given site exhibits molecule-to-molecule variation, as does the elongation velocity between pauses. This inhomogeneity is demonstrated by the positive correlation between pausing at a given site among different repeats (Figure 7). The fact that the correlation does not decay as the molecule traverses up to four repeats excludes internal state switching on the corresponding time scale as the source of any inhomogeneity and implies that the tendency to pause may be an inherent characteristic of each enzyme. The level of velocity inhomogeneity observed in our assay is consistent with that seen in previous studies of transcription (Neuman et al., 2003; Tolic-Norrelykke et al., 2004) but greater than in another assay (Adelman et al., 2002). We failed to detect any evidence for velocity-state switching, contrary to one report (Davenport et al., 2000). The basis of molecular variation in velocities and pause rates remains a subject for future study. We note, however, that our fundamental conclusions do not depend on the source of this inhomogeneity.
A Common, Elemental Pause State
It has been previously proposed that longer-lived transcriptional pauses (i.e., hairpin-stabilized and backtracking pauses) may arise from a common nonbacktracked precursor state (the elemental pause) (Artsimovitch and Landick, 2000; Neuman et al., 2003; Palangat and Landick, 2001) that is related to ubiquitous pausing (Neuman et al., 2003) and the “unactivated” state (Erie, 2002). Our results support this model and allow us to elaborate upon the original proposal. The fact that ubiquitous pauses are sequence dependent is consistent with the idea that this state represents a precursor to backtracked and hairpin-stabilized pauses, which are known to be sequence dependent. In support of this assignment, all pause lifetimes followed exponential distributions, consistent with a transition from a single state. The intrinsic rates for escaping the elemental pause state were similar for all sites, despite a 5-fold variation in apparent lifetime. Taken together, these observations suggest that the return to the main elongation pathway may represent the exit from an elemental pause state that forms under our experimental conditions. Interestingly, we observed no backtracking at the major ops regulatory site. Furthermore, in single-molecule assays performed in the presence of DNA oligomers complementary to the his hairpin sequence that disrupt hairpin formation and prevented pause stabilization in previous experiments (Artsimovitch and Landick, 2000), we observed no decrease in the dwell time at the his site (data not shown). Indeed, we found no clear evidence for the formation of alternative, stabilized pause states at either the ops or his pause sites, suggesting that the elemental pause may represent the only state populated under the conditions studied here—namely, high NTP levels, moderate assisting loads that tend to inhibit backtracking, and lower temperature (21.5°C), which is known to inhibit arrest or backtracking (Gu and Reines, 1995; Kulish and Struhl, 2001). This is consistent with the fact that backtracking at the ops site was suggested to occur in experiments conducted at 37°C (Artsimovitch and Landick, 2000). Thus, in our single-molecule assay conditions, we appear to observe only an elemental pause state that is able to equilibrate with the online state from which it formed.
A Two-Tiered Pause Mechanism
Taken together, our data support the view that a ubiquitous pause is generated by a sequence-dependent mechanism that induces RNAP to enter temporarily into an inactive state where elongation is inhibited. This leads to a brief transcriptional pause with little, if any, associated motion of the enzyme along the DNA template. Once RNAP pauses, secondary pause mechanisms, such as RNA hairpin formation or enzyme backtracking, compete with the slow rate of escape from the elemental pause (~1 s−1), which is more than 10-fold slower than the normal elongation rate. Such “two-tiered” mechanisms for the regulation of transcription have been previously suggested in studies of misincorporation, pausing, elongation, and termination (Artsimovitch and Landick, 2000; Erie et al., 1993; Foster et al., 2001; Palangat and Landick, 2001; von Hippel and Yager, 1991, 1992). In this two-tiered mechanism, a long-lived regulatory pause would be comprised of two components acting in succession: (1) a common sequence element that triggers a temporary (elemental) pause state, followed by (2) additional sequence elements that convert the elemental pause into a long-lived pause. The pause-inducing and pause-stabilizing sequence elements might be distinct, but more likely they overlap or share common motifs. It follows from this model that there are two potential points of regulation: formation of the elemental pause and subsequent steps that stabilize pauses. Future work will entail discovering how regulators such as NusA, Nus G, and Gre factors function in the context of the two-tiered pause mechanism.
EXPERIMENTAL PROCEDURES
Cloning of a Single Repeat Motif
his and ops-pheP pause sequences have been described (Artsimovitch and Landick, 2000). Flanking sequences in the tandem repeat regions, consisting of DNA derived from the rpoB gene, were from a region of pRL732 (1638–1800; Neuman et al., 2003; Shaevitz et al., 2003) with little propensity to form RNA secondary structure, based on mfold (Zuker, 2003). DNA templates were constructed from eight oligonucleotides of ~60 bp with complementary overhanging ends for ligation in a repetitive and directed fashion. Equimolar amounts of adjacent double-stranded segments were ligated. Overhanging ends were filled in with the large Klenow fragment of DNA polymerase I (NEB). Blunt-ended products were ligated into pCR-Blunt vector (Zero Blunt Cloning Kit, Invitrogen). The two templates were amplified using PCR primers designed to add flanking sequences and were ligated into pCR-Script (Stratagene) vector.
Cloning Concatenated Pause Sequences
A BgIII site was appended to the repeat motifs by PCR. PCR products were subsequently digested with BamHI and ligated into BamHI/SmaI-digested pUC19. The resulting repeat motifs were 227 bp and 239 bp for the ops and his motifs, respectively. Subsequent rounds of cloning to create 2-mers, 4-mers, and finally 8-mers in the pUC19-derived plasmid were done as described (Carrion-Vazquez et al., 1999).
Cloning Pauses behind the T7 A1 Promoter for Optical Trapping
The concatenated motifs were cloned into pKH1, an ~4800 bp long derivative of pRL732 previously used as a source of DNA templates (Neuman et al., 2003; Shaevitz et al., 2003). pKH1 was constructed by digesting pRL732 with SphI and ClaI to remove ~3000 bp. Short oligonucleotides containing BamHI sequence were annealed and ligated into the digested plasmid. The repeated his and ops pause sequences were released from their respective PUC19 plasmids by digestion with BamHI and BglII. These sequences were gel purified and ligated into pKH1 plasmids that had been linearized with BamHI and transformed into XL-1 Blue cells (Stratagene). These resulting plasmids, pKH2 (ops) and pBW1 (his), were used to produce DNA templates for optical trapping.
Transcription Templates for Optical-Trapping Assays
Linear labeled templates were constructed from pKH2 and pBW1 plasmids by digesting each plasmid at a unique AlwNI site. The resulting 3′ ends were labeled using DIG-ddUTP and terminal transferase (Roche DIG Oligonucleotide 3′-End Labeling Kit). Digestion at a unique SapI site removed the label at the transcriptionally downstream end, leaving a single label at the upstream end for tethering to anti-digoxigenin-coated polystyrene beads.
Optical-Trapping Assay
Biotin-labeled RNAP was stalled 29 bp after the T7A1 promoter (Neuman et al., 2003) on labeled templates (constructed as described above). Six hundred nanometer diameter avidin-labeled and seven hundred nanometer diameter anti-digoxigenin-labeled beads were prepared, and stalled TECs were bound to the beads to create bead: RNAP:DNA:bead dumbbells (Shaevitz et al., 2003). Experiments were performed as described previously (Shaevitz et al., 2003), but without heparin in the buffer and in the presence of 1 mM ATP, CTP, UTP and 250 μM GTP. The experimental room was maintained at 21.5 ± 0.1°C. The resting tension in the DNA was maintained by a force clamp at 7.3 ± 2.4 pN (mean ± SD) by moving the 700 nm bead in 50 nm increments whenever the tension on the DNA fell below 5 pN (Shaevitz et al., 2003).
Data Analysis
The contour length of DNA between beads was calculated as described (Shaevitz et al., 2003). Template position was determined from the measured DNA contour length during transcription by subtracting the fixed contour length of the segment of DNA template in advance of the transcription initiation site (2607 bp, based on a pitch of 0.338 nm/bp). After traces were aligned (Supplemental Experimental Procedures), pauses were identified by an algorithm similar to Shaevitz et al. (2003) except that, to avoid scoring a single pause multiple times (due to drift), extra pauses found within 1 bp downstream of a prior pause were concatenated. Pause correlations for a given site were calculated by scoring each visit to the site with 1 or 0, according to whether a pause of ≥1 s was observed. The correlation was evaluated for all pairs of visits separated by the prescribed number of repeats, after preprocessing to subtract the mean value and renormalize the variance to unity. Analysis was performed in Igor Pro (Wavemetrics) and C.
Supplemental Data
Supplemental Data include Supplemental Experimental Procedures, ten figures, and Supplemental References and can be found with this article online at http://www.cell.com/cgi/content/full/125/6/1083/DC1/.
Supplementary Material
Acknowledgments
We thank J. Gelles and past and present members of the Block lab, particularly E. Abbondanzieri, J. Shaevitz, R. Dalal, and W. Greenleaf, for discussions and technical assistance. We thank P. Fordyce and M. Woodside for comments on the manuscript. K.M.H. thanks M. Carrion-Vazquez for cloning advice. B.J.W. received support from a Stanford Undergraduate Research Grant and an HHMI Summer Fellowship. K.M.H. and R.A.M. acknowledge support from an HHMI Predoctoral Fellowship and an NIH Biotechnology Training Grant, respectively. This work was supported by grants from the NIH to S.M.B. and R.L.
Footnotes
Note Added in Proof
We have recently become aware of an improved model for transcriptional pausing that incorporates the energetics of RNA folding and long-lived kinetic barriers that depend upon the DNA sequence. The reference for this model is as follows:
Tadigotla, V.R., O’Maoileidigh, D., Sengupta, A.M., Epshtein, V., Ebright, R.H., Nudler, E., and Ruckenstein, A.E. (2006). Thermodynamic and kinetic modeling of transcriptional pausing. Proc. Natl. Acad. Sci. USA 103, 4439–4444.
This model predicts pauses that correlate with a high fraction of the locations reported here (A.E. Ruckenstein, personal communication).
References
- Abbondanzieri EA, Greenleaf WJ, Shaevitz JW, Landick R, Block SM. Direct observation of base-pair stepping by RNA polymerase. Nature. 2005;438:460–465. doi: 10.1038/nature04268. [DOI] [PMC free article] [PubMed] [Google Scholar]
- Adelman K, La Porta A, Santangelo TJ, Lis JT, Roberts JW, Wang MD. Single molecule analysis of RNA polymerase elongation reveals uniform kinetic behavior. Proc Natl Acad Sci USA. 2002;99:13538–13543. doi: 10.1073/pnas.212358999. [DOI] [PMC free article] [PubMed] [Google Scholar]
- Adelman K, Marr MT, Werner J, Saunders A, Ni Z, Andrulis ED, Lis JT. Efficient release from promoter-proximal stall sites requires transcript cleavage factor TFIIS. Mol Cell. 2005;17:103–112. doi: 10.1016/j.molcel.2004.11.028. [DOI] [PubMed] [Google Scholar]
- Aivazashvili VA, Bibilashvili R, Vartikian RM, Kutateladze TV. Factors influencing the pulse character of RNA elongation in vitro by E. coli RNA polymerase. Mol Biol (Mosk) 1981;15:653–667. [PubMed] [Google Scholar]
- Artsimovitch I, Landick R. Pausing by bacterial RNA polymerase is mediated by mechanistically distinct classes of signals. Proc Natl Acad Sci USA. 2000;97:7090–7095. doi: 10.1073/pnas.97.13.7090. [DOI] [PMC free article] [PubMed] [Google Scholar]
- Artsimovitch I, Landick R. The transcriptional regulator RfaH stimulates RNA chain synthesis after recruitment to elongation complexes by the exposed nontemplate DNA strand. Cell. 2002;109:193–203. doi: 10.1016/s0092-8674(02)00724-9. [DOI] [PubMed] [Google Scholar]
- Bai L, Shundrovsky A, Wang MD. Sequence-dependent kinetic model for transcription elongation by RNA polymerase. J Mol Biol. 2004;344:335–349. doi: 10.1016/j.jmb.2004.08.107. [DOI] [PubMed] [Google Scholar]
- Bailey MJ, Hughes C, Koronakis V. RfaH and the ops element, components of a novel system controlling bacterial transcription elongation. Mol Microbiol. 1997;26:845–851. doi: 10.1046/j.1365-2958.1997.6432014.x. [DOI] [PubMed] [Google Scholar]
- Carrion-Vazquez M, Oberhauser AF, Fowler SB, Marszalek PE, Broedel SE, Clarke J, Fernandez JM. Mechanical and chemical unfolding of a single protein: a comparison. Proc Natl Acad Sci USA. 1999;96:3694–3699. doi: 10.1073/pnas.96.7.3694. [DOI] [PMC free article] [PubMed] [Google Scholar]
- Chan CL, Landick R. Dissection of the his leader pause site by base substitution reveals a multipartite signal that includes a pause RNA hairpin. J Mol Biol. 1993;233:25–42. doi: 10.1006/jmbi.1993.1482. [DOI] [PubMed] [Google Scholar]
- Davenport RJ, Wuite GJ, Landick R, Bustamante C. Single-molecule study of transcriptional pausing and arrest by E. coli RNA polymerase. Science. 2000;287:2497–2500. doi: 10.1126/science.287.5462.2497. [DOI] [PubMed] [Google Scholar]
- de la Mata M, Alonso CR, Kadener S, Fededa JP, Blaustein M, Pelisch F, Cramer P, Bentley D, Kornblihtt AR. A slow RNA polymerase II affects alternative splicing in vivo. Mol Cell. 2003;12:525–532. doi: 10.1016/j.molcel.2003.08.001. [DOI] [PubMed] [Google Scholar]
- de Mercoyrol L, Soulie JM, Job C, Job D, Dussert C, Palmari J, Rasigni M, Rasigni G. Abortive intermediates in transcription by wheat-germ RNA polymerase II. Dynamic aspects of enzyme/template interactions in selection of the enzyme synthetic mode. Biochem J. 1990;269:651–658. doi: 10.1042/bj2690651. [DOI] [PMC free article] [PubMed] [Google Scholar]
- Erie DA. The many conformational states of RNA polymerase elongation complexes and their roles in the regulation of transcription. Biochim Biophys Acta. 2002;1577:224–239. doi: 10.1016/s0167-4781(02)00454-2. [DOI] [PubMed] [Google Scholar]
- Erie DA, Hajiseyedjavadi O, Young MC, von Hippel PH. Multiple RNA polymerase conformations and GreA: control of the fidelity of transcription. Science. 1993;262:867–873. doi: 10.1126/science.8235608. [DOI] [PubMed] [Google Scholar]
- Foster JE, Holmes SF, Erie DA. Allosteric binding of nucleoside triphosphates to RNA polymerase regulates transcription elongation. Cell. 2001;106:243–252. doi: 10.1016/s0092-8674(01)00420-2. [DOI] [PubMed] [Google Scholar]
- Gilbert, W.J. (1976). Starting and stopping sequences of the RNA polymerase. In RNA Polymerase, R Losick, and MJ Chamberlin, eds (Cold Spring Harbor, NY, USA: Cold Spring Harbor Laboratory), pp. 193–205.
- Gorodkin J, Heyer LJ, Brunak S, Stormo GD. Displaying the information contents of structural RNA alignments: the structure logos. Comput Appl Biosci. 1997;13:583–586. doi: 10.1093/bioinformatics/13.6.583. [DOI] [PubMed] [Google Scholar]
- Gu W, Reines D. Identification of a decay in transcription potential that results in elongation factor dependence of RNA polymerase II. J Biol Chem. 1995;270:11238–11244. doi: 10.1074/jbc.270.19.11238. [DOI] [PMC free article] [PubMed] [Google Scholar]
- Harrington KJ, Laughlin RB, Liang S. Balanced branching in transcription termination. Proc Natl Acad Sci USA. 2001;98:5019–5024. doi: 10.1073/pnas.240431598. [DOI] [PMC free article] [PubMed] [Google Scholar]
- Henkin TM, Yanofsky C. Regulation by transcription attenuation in bacteria: how RNA provides instructions for transcription termination/antitermination decisions. Bioessays. 2002;24:700–707. doi: 10.1002/bies.10125. [DOI] [PubMed] [Google Scholar]
- Kassavetis GA, Chamberlin MJ. Pausing and termination of transcription within the early region of bacteriophage T7 DNA in vitro. J Biol Chem. 1981;256:2777–2786. [PubMed] [Google Scholar]
- Kireeva ML, Komissarova N, Kashlev M. Overextended RNA:DNA hybrid as a negative regulator of RNA polymerase II processivity. J Mol Biol. 2000;299:325–335. doi: 10.1006/jmbi.2000.3755. [DOI] [PubMed] [Google Scholar]
- Kireeva ML, Hancock B, Cremona GH, Walter W, Studitsky VM, Kashlev M. Nature of the nucleosomal barrier to RNA polymerase II. Mol Cell. 2005;18:97–108. doi: 10.1016/j.molcel.2005.02.027. [DOI] [PubMed] [Google Scholar]
- Komissarova N, Kashlev M. Transcriptional arrest: Escherichia coli RNA polymerase translocates backward, leaving the 3′ end of the RNA intact and extruded. Proc Natl Acad Sci USA. 1997;94:1755–1760. doi: 10.1073/pnas.94.5.1755. [DOI] [PMC free article] [PubMed] [Google Scholar]
- Kulish D, Struhl K. TFIIS enhances transcriptional elongation through an artificial arrest site in vivo. Mol Cell Biol. 2001;21:4162–4168. doi: 10.1128/MCB.21.13.4162-4168.2001. [DOI] [PMC free article] [PubMed] [Google Scholar]
- Landick, R., Turnbough, C.J., and Yanofsky C. (1996). Transcription attenuation. In Escherichia coli and Salmonella: Cellular and Molecular Biology, F Neidhardt, R Curtiss, III, JL Ingraham, ECC Lin, KB Low, B Magasanik, WS Rfznikopp, M Riley, M Schaechter, and HE Umbarger, eds (Washington, DC: ASM Press), pp. 1263–1286.
- Neuman KC, Abbondanzieri EA, Landick R, Gelles J, Block SM. Ubiquitous transcriptional pausing is independent of RNA polymerase backtracking. Cell. 2003;115:437–447. doi: 10.1016/s0092-8674(03)00845-6. [DOI] [PubMed] [Google Scholar]
- Nudler E, Kashlev M, Nikiforov V, Goldfarb A. Coupling between transcription termination and RNA polymerase inchworming. Cell. 1995;81:351–357. doi: 10.1016/0092-8674(95)90388-7. [DOI] [PubMed] [Google Scholar]
- Palangat M, Landick R. Roles of RNA:DNA hybrid stability, RNA structure, and active site conformation in pausing by human RNA polymerase II. J Mol Biol. 2001;311:265–282. doi: 10.1006/jmbi.2001.4842. [DOI] [PubMed] [Google Scholar]
- Palangat M, Meier TI, Keene RG, Landick R. Transcriptional pausing at +62 of the HIV-1 nascent RNA modulates formation of the TAR RNA structure. Mol Cell. 1998;1:1033–1042. doi: 10.1016/s1097-2765(00)80103-3. [DOI] [PubMed] [Google Scholar]
- Pasman Z, von Hippel PH. Active Escherichia coli transcription elongation complexes are functionally homogeneous. J Mol Biol. 2002;322:505–519. doi: 10.1016/s0022-2836(02)00814-8. [DOI] [PubMed] [Google Scholar]
- Reeder TC, Hawley DK. Promoter proximal sequences modulate RNA polymerase II elongation by a novel mechanism. Cell. 1996;87:767–777. doi: 10.1016/s0092-8674(00)81395-1. [DOI] [PubMed] [Google Scholar]
- Renner DB, Yamaguchi Y, Wada T, Handa H, Price DH. A highly purified RNA polymerase II elongation control system. J Biol Chem. 2001;276:42601–42609. doi: 10.1074/jbc.M104967200. [DOI] [PubMed] [Google Scholar]
- Richardson, J.P., and Greenblatt, J. (1996). Control of RNA chain elongation and termination. In Escherichia coli and Salmonella: Cellular and Molecular Biology, F Neidhardt, R Curtiss, III, JL Ingraham, ECC Lin, KB Low, B Magasanik, WS Rfznikopp, M Riley, M Schaechter, and HE Umbarger, eds (Washington, DC: ASM Press), pp. 822–848.
- Ring BZ, Yarnell WS, Roberts JW. Function of E. coli RNA polymerase sigma factor sigma 70 in promoter-proximal pausing. Cell. 1996;86:485–493. doi: 10.1016/s0092-8674(00)80121-x. [DOI] [PubMed] [Google Scholar]
- Shaevitz JW, Abbondanzieri EA, Landick R, Block SM. Backtracking by single RNA polymerase molecules observed at near-base-pair resolution. Nature. 2003;426:684–687. doi: 10.1038/nature02191. [DOI] [PMC free article] [PubMed] [Google Scholar]
- Shundrovsky A, Santangelo TJ, Roberts JW, Wang MD. A single-molecule technique to study sequence-dependent transcription pausing. Biophys J. 2004;87:3945–3953. doi: 10.1529/biophysj.104.044081. [DOI] [PMC free article] [PubMed] [Google Scholar]
- Tang H, Liu Y, Madabusi L, Gilmour DS. Promoter-proximal pausing on the hsp70 promoter in Drosophila melanogaster depends on the upstream regulator. Mol Cell Biol. 2000;20:2569–2580. doi: 10.1128/mcb.20.7.2569-2580.2000. [DOI] [PMC free article] [PubMed] [Google Scholar]
- Tolic-Norrelykke SF, Engh AM, Landick R, Gelles J. Diversity in the rates of transcript elongation by single RNA polymerase molecules. J Biol Chem. 2004;279:3292–3299. doi: 10.1074/jbc.M310290200. [DOI] [PubMed] [Google Scholar]
- Toulokhonov I, Landick R. The flap domain is required for pause RNA hairpin inhibition of catalysis by RNA polymerase and can modulate intrinsic termination. Mol Cell. 2003;12:1125–1136. doi: 10.1016/s1097-2765(03)00439-8. [DOI] [PubMed] [Google Scholar]
- Toulokhonov I, Artsimovitch I, Landick R. Allosteric control of RNA polymerase by a site that contacts nascent RNA hairpins. Science. 2001;292:730–733. doi: 10.1126/science.1057738. [DOI] [PubMed] [Google Scholar]
- von Hippel PH. An integrated model of the transcription complex in elongation, termination, and editing. Science. 1998;281:660–665. doi: 10.1126/science.281.5377.660. [DOI] [PubMed] [Google Scholar]
- von Hippel PH, Yager TD. Transcript elongation and termination are competitive kinetic processes. Proc Natl Acad Sci USA. 1991;88:2307–2311. doi: 10.1073/pnas.88.6.2307. [DOI] [PMC free article] [PubMed] [Google Scholar]
- von Hippel PH, Yager TD. The elongation-termination decision in transcription. Science. 1992;255:809–812. doi: 10.1126/science.1536005. [DOI] [PubMed] [Google Scholar]
- Wang D, Meier TI, Chan CL, Feng G, Lee DN, Landick R. Discontinuous movements of DNA and RNA in RNA polymerase accompany formation of a paused transcription complex. Cell. 1995;81:341–350. doi: 10.1016/0092-8674(95)90387-9. [DOI] [PubMed] [Google Scholar]
- Yarnell WS, Roberts JW. Mechanism of intrinsic transcription termination and antitermination. Science. 1999;284:611–615. doi: 10.1126/science.284.5414.611. [DOI] [PubMed] [Google Scholar]
- Yonaha M, Proudfoot NJ. Specific transcriptional pausing activates polyadenylation in a coupled in vitro system. Mol Cell. 1999;3:593–600. doi: 10.1016/s1097-2765(00)80352-4. [DOI] [PubMed] [Google Scholar]
- Zuker M. Mfold web server for nucleic acid folding and hybridization prediction. Nucleic Acids Res. 2003;31:3406–3415. doi: 10.1093/nar/gkg595. [DOI] [PMC free article] [PubMed] [Google Scholar]
Associated Data
This section collects any data citations, data availability statements, or supplementary materials included in this article.