

Abstract
Escherichia coli RNA polymerase (RNAP) synthesizes RNA with remarkable fidelity in vivo1. Its low error rate may be achieved by means of a ‘proofreading’ mechanism comprised of two sequential events. The first event (backtracking) involves a transcriptionally upstream motion of RNAP through several base pairs, which carries the 3′ end of the nascent RNA transcript away from the enzyme active site. The second event (endonucleolytic cleavage) occurs after a variable delay and results in the scission and release of the most recently incorporated ribonucleotides, freeing up the active site. Here, by combining ultrastable optical trapping apparatus with a novel two-bead assay to monitor transcriptional elongation with near-base-pair precision, we observed backtracking and recovery by single molecules of RNAP. Backtracking events (~5 bp) occurred infrequently at locations throughout the DNA template and were associated with pauses lasting 20 s to >30 min. Inosine triphosphate increased the frequency of backtracking pauses, whereas the accessory proteins GreA and GreB, which stimulate the cleavage of nascent RNA, decreased the duration of such pauses.
Recent studies have implicated the nucleolytic activity of RNA polymerase as part of a proofreading mechanism2–4, similar to that found in DNA polymerases5. A key feature of this proofreading mechanism is a short backtracking motion of the enzyme along the DNA template (directed upstream, opposite to the normal direction of transcriptional elongation). Similar rearward movements are thought to accompany the processes of transcriptional pausing6–8, arrest9,10, and transcription-coupled DNA repair11. During backtracking, the transcription bubble shifts and the DNA–RNA hybrid duplex remains in register, while the 3′ end of the RNA transcript moves away from the active site, and may even protrude into the secondary channel (nucleotide entrance pore) of the enzyme6,7,9, blocking the arrival of ribonucleoside triphosphates (NTPs). In its backtracked state, RNAP is able to cleave off and discard the most recently added base(s) by endonucleolysis, generating a fresh 3′ end at the active site for subsequent polymerization onto the nascent RNA chain. In this fashion, short RNA segments carrying misincorporated bases can be replaced, leading to the correction of transcriptional errors (Fig. 1a). Accessory proteins have been identified that increase transcriptional fidelity by preferentially stimulating the cleavage of misincorporated nucleotides: GreA and GreB for E. coli RNA polymerase4 and SII/TFIIS for eukaryotic RNA polymerase II2,3.
Figure 1.
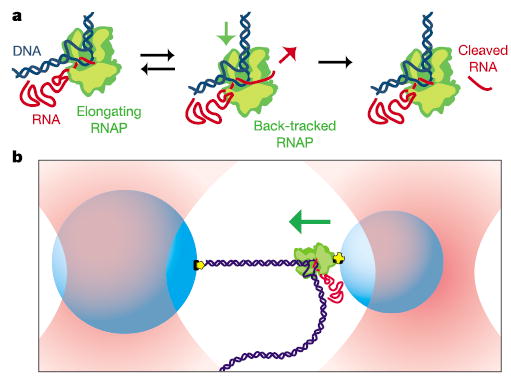
RNA polymerase transcription and proofreading studied by optical trapping. a, During normal elongation, RNAP (green) moves forward (downstream) on the DNA (blue) as it elongates the nascent RNA (red). At each position along the template, RNAP may slide backward along the template, causing transcription to cease temporarily. From the backtracked state, polymerase can either slide forward again, returning to its earlier state (left) or cleave the nascent RNA (right) and resume transcriptional elongation. b, Cartoon of the experimental geometry employed for opposing force experiments (not to scale). Two beads (blue) are held in separate optical traps (red) in a force-clamp arrangement. The smaller bead (right) is bound to a single molecule of RNAP, while the larger bead (left) is bound to the downstream end of the DNA by non-covalent linkages (yellow). During transcriptional elongation, the beads are pulled together. Nearly all the motion appears as a displacement of the right bead (green arrow), which is held in a comparatively weaker trap.
We studied transcription by RNAP at physiological nucleotide concentrations using a new single-molecule assay together with improved optical trapping instrumentation. In combination, these achieve subnanometre resolution along with extremely low positional drift. Our current system is capable of near-base-pair resolution in individual records of RNAP displacements, and achieves base-pair resolution (<0.3 nm) in averages of multiple records. During an experiment, two beads are optically trapped in buffer above a microscope coverglass by independently steered laser traps. A recombinant derivative of E. coli RNAP is bound specifically via a biotin–avidin linkage to the smaller of two polystyrene beads, while the transcriptionally downstream end of the DNA template (or the upstream end, in the case of assisting forces) is bound to the larger bead via a digoxygenin-antibody linkage, forming a bead–RNAP–DNA–bead ‘dumbbell’ (Fig. 1b).
The tension in the DNA was kept nearly constant (8.4 ± 0.8 pN), for loads both opposing and assisting transcription, by feedback control of the position of the optical trap holding the larger bead. A force of this magnitude has a negligible effect on transcription rates, and is well below the stall force for RNAP12. An opposing load was applied in all experiments, except where noted. Transcriptional elongation was observed by measuring the position of the smaller bead as the polymerase moved (Fig. 2a). We chose to make the trap holding the larger bead an order of magnitude stiffer than that holding the smaller bead so that all motion appeared in the latter (see Methods). None of the components of the assay were attached to the coverglass surface: this isolates the system from drift of the microscope stage relative to the objective and other optics, which represented a major source of low-frequency noise in previous single-molecule studies12–17. Measured drift rates during our experiments were typically below 5 nm h−1 (data not shown). We recorded the transcriptional motion of over 150 individual RNAP molecules at 1 mM NTPs moving on a DNA template derived from the E. coli rpoB gene sequence. As previously noted12,13,15,17, RNAP activity consists of periods of continuous motion interrupted by distinct pauses of variable duration (Fig. 2a). The velocity during the continuous-motion phase averaged ~15 bp s−1, but varied among molecules, consistent with earlier reports12,13,15.
Figure 2.
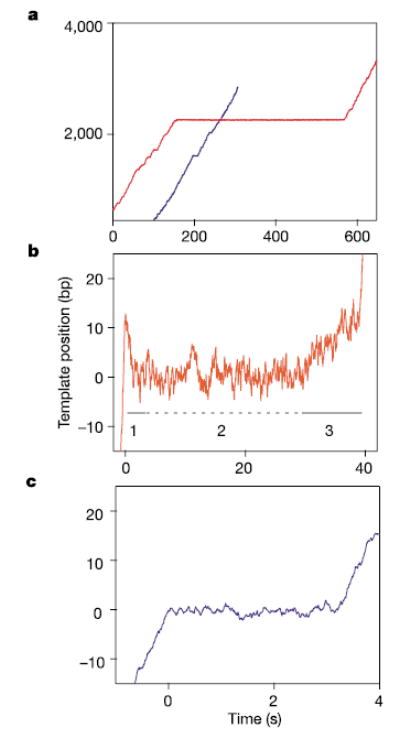
Backtracking occurs upon entry into long, but not short, pauses. a, Transcription records of two individual RNAP molecules are shown, each moving over the same template sequence. Both traces contain multiple short pauses (most are too short to be seen on this timescale); one includes a very long pause (410 s, red trace). b, In some records of long pauses, backtracking could be seen by eye: a representative record is shown. The three phases of motion are indicated below the trace: phase 1 (backtracking, solid line), phase 2 (pause, dotted line), and phase 3 (recovery, solid line). c, A representative record of a short pause (3 s); such pauses do not exhibit backtracking. Data were recorded at 2 kHz and boxcar-filtered at 100 ms for display.
Computer analysis of RNAP records identified transcriptional pauses ranging from 1 s (our detection threshold) to more than 30 min. Only intervals where transcriptional elongation ceased and subsequently recovered were scored as pauses. Pausing events could be broken up into two broad categories: 95% of events were ‘short,’ with lifetimes drawn from a double-exponential distribution with time constants of 1.5 s and 6.5 s, similar to our previous findings12. The remaining 5% of events were ‘long,’ with lifetimes >20 s and a broad, non-exponential temporal distribution. Long pauses occurred at positions randomly distributed along the DNA template, rather than at stereotyped locations, and appeared to be sequence-independent within the resolution of these experiments. On average, long pauses occurred with a frequency of 0.95 ± 0.21 kb−1, a value that corresponds closely to ribonucleotide misincorporation rates during RNA synthesis in vitro1, suggesting a possible role for such pauses in proofreading.
Operationally, we defined the duration of a ‘pause’ as the interval between the cessation of forward transcriptional motion and its subsequent recovery. At high spatial resolution, however, long pauses were found to consist of three distinct phases of motion that could be discerned in some individual records (Fig. 2b), as well as in averages of multiple records (see below). After abruptly stopping forward transcription, the enzyme underwent a slow rearward movement (phase 1, backtracking), typically lasting from 1–5 s, before stopping altogether for a variable interval (phase 2, pause). At the end of phase 2, rather than immediately resuming transcription at normal rates, RNAP moved forward gradually, typically for 3–10 s, transitioning to elongation mode only after a significant fraction of the initial backtracking distance had been retraced (phase 3, recovery). In contrast, neither the backtracking nor the recovery phases were evident in records of short pauses, where transitions both to and from normal elongation were abrupt (Fig. 2c).
To analyse the mean behaviour during phases 1 and 3, we averaged records of long pauses obtained under opposing loads after placing these in register along their rising edges, immediately before the cessation or the resumption of elongation, respectively (Fig. 3a). This procedure allows one to probe details of the motion that would otherwise be obscured by noise in individual records: similar trace-averaging techniques have been successfully employed to detect nanoscale steps in motor proteins such as myosin18 and NCD19, as well as to look for fast transients within the 8-nm step of kinesin20. The average backtracking displacement during phase 1 of long pauses was 4.7 ± 0.8 bp, and could be fitted by a decaying exponential with a time constant of 1.2 ± 0.1 s. Both the duration and frequency of backtracking pauses are expected to display a strong force dependence due to the underlying motions involved. We found that the frequency of long pauses decreased dramatically from 0.95 ± 0.21 kb−1 under an ~8 pN opposing load to below 0.03 kb−1 under an ~8 pN assisting load (Table 1). This finding is consistent with a previous report of force dependence in the duration of very long pauses (~90 s) using a low-resolution optical trapping assay13.
Figure 3.
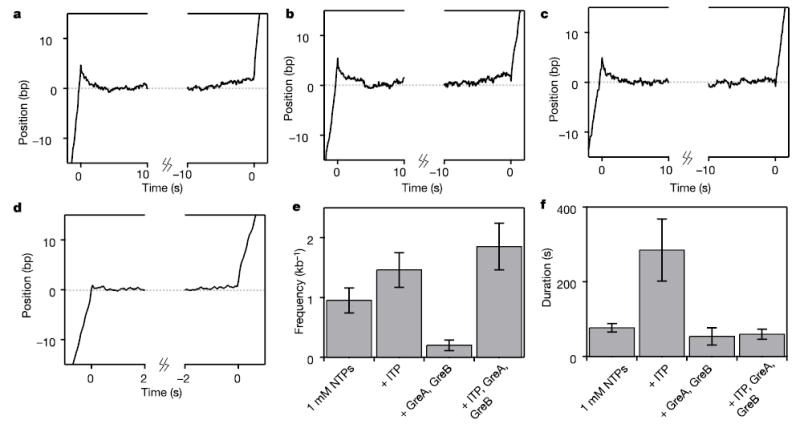
Averages of aligned long-pause records reveal details of backtracking and transcript cleavage events. a, Long-pause average of records at 1 mM NTPs (N = 56) displays a backtracking motion of ~5 bp (phase 1). Recovery (phase 3) is gradual, lasting ~5 s, before the resumption of normal elongation speed. b, Addition of ITP increases the frequency of long pauses that are indistinguishable from those in a (N = 26). c, Addition of GreA and GreB reduced the duration of long pauses. Recovery from these pauses (phase 3) was abrupt (N = 22), distinct from a and b. d, The short pause average (N = 56) displays no backtracking motion. Average records were smoothed with a 100-ms boxcar filter for display. ITP and the accessory proteins GreA and GreB affect both the frequency (e) and duration (f) of long pauses. See text.
Table 1.
Long pause statistics under different experimental conditions
| Condition* | Mean pause frequency (kb−1) | Mean pause duration (s) | Mean backtrack distance (bp) |
|---|---|---|---|
| 1 mM ATP, UTP, GTP, CTP | 0.95 ± 0.21 (N = 56) | 77 ± 11 | 4.7 ± 0.8 |
| 1 mM NTPs, assisting force | <0.03 (N = 1) | – | – |
| +200μM ITP | 1.46 ± 0.29 (N = 26) | 285 ± 83 | 5.5 ± 1.1 |
| +2μM GreA | 0.14 ± 0.08 (N = 3) | 56 ± 12 | 6.6 ± 0.7 |
| +1μM GreB | 0.24 ± 0.09 (N = 8) | 36 ± 7 | 0.5 ± 0.8 |
| +2μM GreA, 1μM GreB | 0.20 ± 0.09 (N = 5) | 54 ± 23 | 5.8 ± 0.8 |
| +200μM ITP, 2μM GreA, 1μM GreB | 1.85 ± 0.39 (N = 22) | 60 ± 13 | 5.0 ± 1.0 |
| +200μM ITP, assisting force | 0.15 ± 0.10 (N = 2) | – | – |
The applied force opposes transcription, unless otherwise noted.
Averages of records during phase 3 displayed a gradual forward motion, at an average velocity of 0.29 ± 0.01 bp s−1, before the resumption of normal elongation at 13.2 ± 0.1 bp s−1 (Fig. 3a). The average forward displacement during recovery was 2.5 ± 1.0 bp, that is, about half of the initial backtracking distance. This reduced distance may reflect a mixed population of records, some of which exited from the pause more abruptly than others. However, the difference might also reflect the trace-alignment procedure. The exit from phase 2 is far less distinct than the entry into phase 1, and is therefore harder to pinpoint: minor registration errors tend to alter the magnitude of motions in averaged traces.
For comparison, we aligned and averaged an identical number of short pause records (Fig. 3d). In contrast to the long pause average, the short pause average displayed sharp transitions both into and out of the pause (that is, no phase 1 or phase 3 motions), with no associated movement greater than a base pair. The average of a much larger population of short pauses (>250) showed the same behaviour (data not shown). The absence of backtracking in short pauses directly confirms and extends the conclusions of a recent study that examined the frequency and duration of short pauses, and found that these were independent of external load. This lack of force dependence implies an absence of backtracking motion, even as small as a single base pair12.
We performed parallel experiments in the presence of the ribonucleotide analogue inosine triphosphate (ITP). Inosine mimics guanosine, forming a weak Watson–Crick pair that is slightly more stable than some measured mispairings21,22. ITP incorporation inhibits next-nucleotide addition in human polymerase II by an amount similar to that of a mismatched base3. In elongating complexes, inosine incorporation decreases the stability of the RNA–DNA hybrid, changing the relative stability of the backtracked and non-backtracked states, and also decreases the stability of secondary structures in the nascent RNA formed behind the complex. The addition of 200μM ITP to the standard transcription buffer (containing 1 mM levels of GTP, CTP, ATP and UTP) increased both the frequency and duration of long pauses (Fig. 3e, f; Table 1; Supplementary Information). Both phase 1 and phase 3 of long pauses were quantitatively similar to those observed in the absence of ITP (Fig. 3b). However, ITP did not affect either the frequency or the duration of short pauses, nor the average transcriptional velocity between pauses.
To assay the effects of transcript cleavage on long pauses, we added the E. coli transcription factors GreA and GreB. Addition of either 2μM GreA or 1μM GreB decreased the frequency of long pauses. Moreover, GreB significantly decreased the duration of long pauses, whereas the effect of GreA on duration was negligible (Fig. 3e, f; Table 1). The average distance backtracked in the presence of GreA increased to 6.6 ± 0.7 bp, whereas GreB appeared to abolish backtracking pauses altogether, yielding a mean backtracking distance close to zero for the few remaining long pauses, 0.5 ± 0.8 bp (Supplementary Information). These findings are consistent with the known properties of the two factors. GreA stimulates the cleavage of short, dinucleotide segments of backtracked RNA, and so its addition should relieve only those pauses associated with short backtracking motions, leaving pauses involving larger displacements. Conversely, GreB accelerates the removal of larger fragments to such a degree that the duration of backtracking pauses falls below the discrimination threshold of 20 s23.
In the presence of both GreA and GreB, the duration (phase 2) of ITP-induced long pauses decreased dramatically, from 285 ± 83 s to 60 ± 13 s, while the average backtracking distance (phase 1) remained the same, 5.0 ± 1.0 bp (Table 1; Fig. 3f). Significantly, in the presence of both these transcription factors, the pause recovery (phase 3) became abrupt, and not gradual. We interpret this difference as being caused by Gre-stimulated cleavage of the RNA blocking the secondary channel after backtracking. Such cleavage would lead to the prompt removal of oligonucleotides containing a potential mismatch, thereby reducing the lifetime of the backtracked, paused state (phase 2), and restoring the new 3′ end of the nascent RNA to a position adjacent to the enzyme active site, ready for immediate polymerization.
In the absence of Gre-stimulated cleavage, RNAP must recover during phase 3 in a less direct fashion. In one mechanism, RNAP relies on its slow endogenous endonucleolytic activity to cleave the RNA at the enzyme active site, leading to long pause lifetimes but still allowing the possibility of error correction. In an alternative mechanism, thermal motions within the stalled complex may reverse the backtracking motion in a random walk process, carrying the original 3′ end of the RNA back to the enzyme active site, once again leading to longer lifetimes, but without concomitant error correction. The gradual recovery seen during phase 3 in the absence of Gre factors may reflect these processes. Random fluctuations of polymerase motion during phase 2 would not be apparent in averaged records, which only show ensemble behaviour.
Taken together, our high-resolution, single-molecule experiments are consistent with a proofreading mechanism in E. coli RNA polymerase involving entry into an initial backtracked state of the enzyme on the DNA template, followed by cleavage of the most recently polymerized RNA (1–10 bp) and enzymatic recovery. Under the conditions explored here (including an opposing load of ~8 pN), RNAP appeared to enter into long, backtracking pauses spontaneously at a rate of roughly once per kilobase: this rate was sensitive to transcription errors, and enhanced at least twofold by the addition of a nucleotide analogue. Incorporation of inosine leading to the backtracked state was relieved quantitatively by the action of transcription factors GreA and GreB, which are known to stimulate transcript cleavage. This simple editing mechanism may function, in principle, in many polymerase systems, including both prokaryotes and eukaryotes.
Methods
Transcription assays
A bead–RNAP–DNA–bead dumbbell was constructed by binding a small 0.5-μm diameter polystyrene bead to a biotin tag located on the β ′ subunit of a stalled E. coli RNAP transcription elongation complex, and a larger 0.7-μm-diameter bead to the downstream end of the DNA template using a digoxygenin antibody (Fig. 1b). Stalled complexes and avidin-coated 0.5-μm-diameter polystyrene beads were prepared as described previously12. Polyclonal anti-digoxigenin antibody was covalently attached to carboxylated 0.7-μm diameter polystyrene beads (Bangs Labs) via an EDC/Sulfo–NHS-coupled reaction. RNAP was stalled 29 base pairs after the T7A1 promoter on a template derived from the rpoB gene of E. coli16. Each of the two beads of the dumbbell was held in a separate optical trap ~1μm above the coverglass surface. Transcription along the DNA template was recorded by monitoring the position of the smaller bead (see below). All experiments were performed in transcription buffer (50 mM HEPES, pH 8.0, 130 mM KCl, 4 mM MgCl2, 0.1 mM EDTA, 0.1 mM DTT, 20 mg ml−1 heparin) in the presence of 1 mM NTPs and an oxygen scavenging system24 at 22 ± 5 °C. ITP was purchased from Sigma-Aldrich Company. GreA and GreB proteins were purified as described25.
Optical trapping
The salient aspects of the instrument used in these experiments have been described previously26. Briefly, the apparatus is based on an inverted microscope (Nikon) modified for exceptional mechanical stability and the incorporation of two lasers for trapping and position detection. To form two optical traps, the trapping laser was split into two orthogonally polarized beams that can be steered independently. Software written in LabView 6i (National Instruments) controlled the position of the trapped 0.7-μm-diameter bead via acousto-optical deflectors (IntraAction). The 0.5-μm-diameter bead was illuminated by the detection laser: scattered light was projected onto a position-sensitive detector (Pacific Silicon Sensors) placed in a plane conjugate to the back focal plane of the microscope condenser. Bead position signals were smoothed at 1 kHz by an eight-pole low-pass Bessel filter (Krohn-Hite) and digitized at 2 kHz.
During an experiment under opposing loads, transcriptional elongation by RNAP shortens the DNA tether and leads to an increase in tension between the two beads. The laser power in each trap was high to reduce brownian noise in position, which is inversely proportional to the trap stiffness27. The relative power in the two traps was fixed so that their ratio of stiffnesses was at least 1:10, which ensured that the majority of RNAP motion appeared as a change in the position of the smaller bead, held in the weaker trap. The resting tension in the DNA was maintained at 8.4 ± 0.8 pN (mean ± s.d.) by moving the 0.7-μm-diameter bead in discrete 50-nm increments whenever the tension on the DNA exceeded 10 pN.
In our measurements, zero-mean, brownian fluctuations of the smaller bead represent the dominant source of noise. Position records of pauses along short pieces of DNA, that is, from enzymes that have already transcribed a substantial portion of the template, exhibit reduced noise because the amplitude of the brownian fluctuations is inversely proportional to the compliance of the linkage holding the bead. Additional sources of noise include tiny departures from sphericity in the beads (slightly non-spherical beads generate low-frequency noise through brownian rotation) and submicroscopic particle contaminants in the buffer that may fall into the optical trap (modulating the level of scattered light and thereby altering the apparent position). The combined effect of such sources causes the root mean square (r.m.s.) noise level to vary slightly from trace to trace: typically, noise levels were ± 5 bp at a 1-kHz bandwidth.
Data analysis
The contour length of the downstream DNA was computed from the measured position of the 0.5-μm-diameter bead and the series elastic compliances of the optical traps and the DNA (using the nonlinear modified Marko–Siggia force–extension relation28). Template position was determined by subtracting the initial tether length (4,226 bp for experiments using forces opposed to transcriptional elongation, and 1,406 bp for experiments using forces assisting transcriptional elongation) from the computed DNA contour length. We estimate our absolute error in determining the template position at ±90 bp, due mainly to minor variations among individual bead diameters.
Transcriptional pauses in individual recordings were scored by eye and also by a custom computer algorithm (similar to ref. 12, but combining the numerical derivative and filtering operations into a single step). This algorithm recovers >99% of all pauses with lifetimes more than 1.5 s. Pauses occurred with a wide range of lifetimes, from seconds to many minutes. Broadly, events could be placed into two categories: 95% of all events belonged to a population that was satisfactorily fitted by a double-exponential relation with time constants of 1.5 s (65% of the normalized amplitude) and 6.5 s (35% of the normalized amplitude). The remaining 5% of all events could not be so represented, and belonged to a much longer-lived population with a broader, non-exponential distribution. To better separate these populations for statistical analysis, we operationally defined ‘short’ pauses as having durations shorter than 5 s and ‘long’ pauses as having durations longer than 20 s, thereby excluding from analysis all pauses with lifetimes 5 < t < 20. Individual pause records were aligned along their initial and final rising edges18–20 and averaged to reduce measurement noise. Analysis was performed using Igor Pro 4.0 (Wavemetrics). All errors are reported as (mean ± s.e.m), except for backtracking distances and durations, which were estimated using a bootstrap resampling analysis, and represent 68% confidence intervals.
Supplementary Material
High resolution transcriptional record taken with 200 μM ITP. Data were recorded at 2 kHz and boxcar-filtered at 100 ms for display.
Long (>20 s) pause traces taken under a variety of conditions were aligned along their rising and trailing edges and separately averaged. a, 2 μM GreA (N = 3) b, 1 μM GreB (N = 8) c, 2 μM GreB and 1 μM GreB (N = 5) d, 200 μM ITP under an assisting load (N = 2). All traces were taken with 1 mM NTPs. Average records were smoothed with a 100 ms boxcar filter for display.
Acknowledgments
We acknowledge intellectual contributions from J. Gelles, and we thank the entire Block Laboratory, especially K. Neuman, for support and discussions. We also thank A. Meyer for reading of the original manuscript. This work was supported by grants from the NIGMS.
Footnotes
Supplementary Information accompanies the paper on www.nature.com/nature.
Competing interests statement The authors declare that they have no competing financial interests.
References
- 1.Erie DA, Yager TD, von Hippel PH. The single-nucleotide addition cycle in transcription: a biophysical and biochemical perspective. Annu Rev Biophys Biomol Struct. 1992;21:379–415. doi: 10.1146/annurev.bb.21.060192.002115. [DOI] [PubMed] [Google Scholar]
- 2.Jeon C, Agarwal K. Fidelity of RNA polymerase II transcription controlled by elongation factor TFIIS. Proc Natl Acad Sci USA. 1996;93:13677–13682. doi: 10.1073/pnas.93.24.13677. [DOI] [PMC free article] [PubMed] [Google Scholar]
- 3.Thomas MJ, Platas AA, Hawley DK. Transcriptional fidelity and proofreading by RNA polymerase II. Cell. 1998;93:627–637. doi: 10.1016/s0092-8674(00)81191-5. [DOI] [PubMed] [Google Scholar]
- 4.Erie DA, Hajiseyedjavadi O, Young MC, von Hippel PH. Multiple RNA polymerase conformations and GreA: control of the fidelity of transcription. Science. 1993;262:867–873. doi: 10.1126/science.8235608. [DOI] [PubMed] [Google Scholar]
- 5.Kunkel TA, Bebenek K. DNA replication fidelity. Annu Rev Biochem. 2000;69:497–529. doi: 10.1146/annurev.biochem.69.1.497. [DOI] [PubMed] [Google Scholar]
- 6.Komissarova N, Kashlev M. RNA polymerase switches between inactivated and activated states by translocating back and forth along the DNA and the RNA. J Biol Chem. 1997;272:15329–15338. doi: 10.1074/jbc.272.24.15329. [DOI] [PubMed] [Google Scholar]
- 7.Nudler E, Mustaev A, Lukhtanov E, Goldfarb A. The RNA-DNA hybrid maintains the register of transcription by preventing backtracking of RNA polymerase. Cell. 1997;89:33–41. doi: 10.1016/s0092-8674(00)80180-4. [DOI] [PubMed] [Google Scholar]
- 8.Marr MT, Roberts JW. Function of transcription cleavage factors GreA and GreB at a regulatory pause site. Mol Cell. 2000;6:1275–1285. doi: 10.1016/s1097-2765(00)00126-x. [DOI] [PubMed] [Google Scholar]
- 9.Komissarova N, Kashlev M. Transcriptional arrest: Escherichia coli RNA polymerase translocates backward, leaving the 3′ end of the RNA intact and extruded. Proc Natl Acad Sci USA. 1997;94:1755–1760. doi: 10.1073/pnas.94.5.1755. [DOI] [PMC free article] [PubMed] [Google Scholar]
- 10.Reeder TC, Hawley DK. Promoter proximal sequences modulate RNA polymerase II elongation by a novel mechanism. Cell. 1996;87:767–777. doi: 10.1016/s0092-8674(00)81395-1. [DOI] [PubMed] [Google Scholar]
- 11.Tornaletti S, Reines D, Hanawalt PC. Structural characterization of RNA polymerase II complexes arrested by a cyclobutane pyrimidine dimer in the transcribed strand of template DNA. J Biol Chem. 1999;274:24124–24130. doi: 10.1074/jbc.274.34.24124. [DOI] [PMC free article] [PubMed] [Google Scholar]
- 12.Neuman KC, Abbondanzieri EA, Landick R, Gelles J, Block SM. Ubiquitous transcriptional pausing is independent of RNA polymerase backtracking. Cell. 2003;115:437–447. doi: 10.1016/s0092-8674(03)00845-6. [DOI] [PubMed] [Google Scholar]
- 13.Forde NR, Izhaky D, Woodcock GR, Wuite GJ, Bustamante C. Using mechanical force to probe the mechanism of pausing and arrest during continuous elongation by Escherichia coli RNA polymerase. Proc Natl Acad Sci USA. 2002;99:11682–11687. doi: 10.1073/pnas.142417799. [DOI] [PMC free article] [PubMed] [Google Scholar]
- 14.Schafer DA, Gelles J, Sheetz MP, Landick R. Transcription by single molecules of RNA polymerase observed by light microscopy. Nature. 1991;352:444–448. doi: 10.1038/352444a0. [DOI] [PubMed] [Google Scholar]
- 15.Wang MD, et al. Force and velocity measured for single molecules of RNA polymerase. Science. 1998;282:902–907. doi: 10.1126/science.282.5390.902. [DOI] [PubMed] [Google Scholar]
- 16.Yin H, Landick R, Gelles J. Tethered particle motion method for studying transcript elongation by a single RNA polymerase molecule. Biophys J. 1994;67:2468–2478. doi: 10.1016/S0006-3495(94)80735-0. [DOI] [PMC free article] [PubMed] [Google Scholar]
- 17.Adelman K, et al. Single molecule analysis of RNA polymerase elongation reveals uniform kinetic behavior. Proc Natl Acad Sci USA. 2002;99:13538–13543. doi: 10.1073/pnas.212358999. [DOI] [PMC free article] [PubMed] [Google Scholar]
- 18.Veigel C, et al. The motor protein myosin-I produces its working stroke in two steps. Nature. 1999;398:530–533. doi: 10.1038/19104. [DOI] [PubMed] [Google Scholar]
- 19.deCastro MJ, Fondecave RM, Clarke LA, Schmidt CF, Stewart RJ. Working strokes by single molecules of the kinesin-related microtubule motor ncd. Nature Cell Biol. 2000;2:724–729. doi: 10.1038/35036357. [DOI] [PubMed] [Google Scholar]
- 20.Nishiyama M, Muto E, Inoue Y, Yanagida T, Higuchi H. Substeps within the 8-nm step of the ATPase cycle of single kinesin molecules. Nature Cell Biol. 2001;3:425–428. doi: 10.1038/35070116. [DOI] [PubMed] [Google Scholar]
- 21.Aboul-ela F, Koh D, Tinoco I, Jr, Martin FH. Base-base mismatches Thermodynamics of double helix formation for dCA3XA3G+dCT3YT3G (X, Y=A,C,G,T) Nucleic Acids Res. 1985;13:4811–4824. doi: 10.1093/nar/13.13.4811. [DOI] [PMC free article] [PubMed] [Google Scholar]
- 22.Martin FH, Castro MM, Aboul-ela F, Tinoco I., Jr Base pairing involving deoxyinosine: implications for probe design. Nucleic Acids Res. 1985;13:8927–8938. doi: 10.1093/nar/13.24.8927. [DOI] [PMC free article] [PubMed] [Google Scholar]
- 23.Borukhov S, Sagitov V, Goldfarb A. Transcript cleavage factors from E. coli. Cell. 1993;72:459–466. doi: 10.1016/0092-8674(93)90121-6. [DOI] [PubMed] [Google Scholar]
- 24.Yildiz A, et al. Myosin V walks hand-over-hand: single fluorophore imaging with 1.5-nm localization. Science. 2003;300:2061–2065. doi: 10.1126/science.1084398. [DOI] [PubMed] [Google Scholar]
- 25.Feng GH, Lee DN, Wang D, Chan CL, Landick R. GreA-induced transcript cleavage in transcription complexes containing Escherichia coli RNA polymerase is controlled by multiple factors, including nascent transcript location and structure. J Biol Chem. 1994;269:22282–22294. [PubMed] [Google Scholar]
- 26.Lang MJ, Asbury CL, Shaevitz JW, Block SM. An automated two-dimensional optical force clamp for single molecule studies. Biophys J. 2002;83:491–501. doi: 10.1016/S0006-3495(02)75185-0. [DOI] [PMC free article] [PubMed] [Google Scholar]
- 27.Svoboda K, Block SM. Biological applications of optical forces. Annu Rev Biophys Biomol Struct. 1994;23:247–285. doi: 10.1146/annurev.bb.23.060194.001335. [DOI] [PubMed] [Google Scholar]
- 28.Wang MD, Yin H, Landick R, Gelles J, Block SM. Stretching DNA with optical tweezers. Biophys J. 1997;72:1335–1346. doi: 10.1016/S0006-3495(97)78780-0. [DOI] [PMC free article] [PubMed] [Google Scholar]
Associated Data
This section collects any data citations, data availability statements, or supplementary materials included in this article.
Supplementary Materials
High resolution transcriptional record taken with 200 μM ITP. Data were recorded at 2 kHz and boxcar-filtered at 100 ms for display.
Long (>20 s) pause traces taken under a variety of conditions were aligned along their rising and trailing edges and separately averaged. a, 2 μM GreA (N = 3) b, 1 μM GreB (N = 8) c, 2 μM GreB and 1 μM GreB (N = 5) d, 200 μM ITP under an assisting load (N = 2). All traces were taken with 1 mM NTPs. Average records were smoothed with a 100 ms boxcar filter for display.