

Abstract
Objectives. We examined the cessation of hormone replacement therapy (HRT) among British women, by educational level, social class, and cardiovascular risk factors, at the time of publicity about 2 clinical trials of HRT that were halted after adverse findings.
Methods. A total of 1387 women aged 57 years reported their monthly HRT use between January 2002 and February 2003. A succession of regression-based time-series models were fitted to detect changes in the proportion of HRT users stratified by education level, social class, hypertension, and obesity.
Results. The overall percentage of HRT users declined from 31% in January 2002 to less than 26% by February 2003. Changes in trends of HRT use were first detected in June 2002 (for women with advanced secondary educational qualification or higher) and in July 2002 (for all other groups). The rate of decline was greatest for women with no formal educational qualifications, from the manual social class, or who were hypertensive or obese.
Conclusions. These decreases coincided with the announced cessation of a large US clinical trial of HRT. This publicity may have had a differential influence on the immediate decline in HRT use by various groups of British women.
Previous articles have examined the problematic issue of reporting results from medical research in ways that do not provoke detrimental public health outcomes.1–3 For instance, controversy and confusion arose among the UK public after reports of a link between autism/bowel syndrome and the triple measles, mumps, and rubella vaccine.1,2 It led to a marked drop in vaccination rates among children and a consequent increased risk of these diseases.1 In July 2002, another debate, this one surrounding HRT for menopausal women, occurred. The National Institutes of Health issued a press release announcing that after 5.6 years they had prematurely stopped the American Women’s Health Initiative (WHI), a major clinical trial examining the risks and benefits of combined estrogen and progestin treatment. The press release reported the relative change in risk for a range of health outcomes among women on HRT compared with those of the placebo group, including a “41% increase in the risk of strokes,” “a doubling of the rates of venous thromboembolism,” and “a 26% increase in the rates of breast cancer.”3 Although they also reported the absolute change, for instance that among 10 000 postmenopausal women on the type of HRT studied, 8 more would have breast cancer, it was the relative percentage change that made the headlines.4 The press release omitted confidence intervals for the results, although these were reported in the supporting peer-reviewed paper a week later.5 At least 1 media commentator suggested that the percentage change in risk could easily be misinterpreted in absolute terms, so that women on HRT might conclude that they had a 24%, or nearly 1 in 4 chance of developing breast cancer.4
Unsurprisingly the reports not only caused alarm among women but also may have influenced the decision of those on HRT to discontinue treatment. For example, in Australia the sales of most commonly prescribed HRT preparations declined by 30% within 5 weeks of the initial press release.4 As a consequence of the results from the WHI study, in October 2002 the UK Medical Research Council (MRC) decided to stop the Women’s International Study of Long Duration Estrogen After Menopause (WISDOM) trial, for which recruitment had started in 1999.6
We examine the timing and magnitude of cessation trends for HRT use by social class and educational level among British women between January 1999 and February 2003 and estimate the immediate effect of publicity surrounding the early termination of these trials. Because reports of the WHI trial may have indicated an increased risk of cardiovascular disease (CVD) that was contrary to expectations,7 trends in HRT use were also investigated by level of CVD risk as characterized by blood pressure and body mass index.
METHODS
The MRC National Survey of Health and Development (NSHD), also known as the 1946 British Birth Cohort, is a longitudinal study of health based on a social class–stratified random sample of 5362 singleton births in England, Scotland, or Wales during the first week of March 1946. A total of 2547 women and 2815 men have been followed up regularly since their birth.8 The cohort is still generally representative of the population born in Britain at that time.9
At the time of their 57th birthday in March 2003, 1387 female study members completed a short postal questionnaire to determine menopausal status and HRT use. They had previously completed similar postal questionnaires annually between 1993 and 2000 providing monthly histories of HRT use.8 For the purpose of updating these histories, women were asked if they had taken HRT since January 1999. They indicated HRT use by ticking the corresponding boxes on a monthly calendar that covered the preceding 26 months, from January 1999 (aged 53 years) to February 2003 (aged 56 years). The sample represented 80% of eligible women still in contact with the study and 55% of the original cohort. Women not eligible for the study had already died (8% of original cohort), lived abroad (8%), were untraced (4%), or had previously refused to take part (16%).
Study members were grouped into the nonmanual or manual social classes on the basis of their current or last occupation when aged 53 years, using the British Registrar General’s social class classification. A second measure of social class was obtained on the basis of the occupation of the head of household when the women were aged 43 years. Educational qualifications of the women by the age of 26 years were grouped into no qualifications, up to ordinary secondary qualifications (“O”-levels, usually attained at the age of 16 years, and their training equivalents), advanced secondary qualifications (“A”-levels, usually attained at the age of 18 years, or degree level and their equivalents).10
The women were also grouped according to 2 indicators of CVD risk: body mass index and blood pressure. At a home visit when the women were aged 53 years, nurses measured height and weight according to a standardized protocol, and body mass index was calculated (weight/height2), with obesity defined by body mass index of 30 kg/m2 or greater. During the same home visit, blood pressure was measured twice, with the survey member seated and after 5 minutes of rest, with an Omron HEM-705 automated digital oscillometric sphygmomanometer (Omron, Tokyo, Japan); the second blood pressure reading was used for this analysis.11 Subjects were defined as hypertensive if their systolic blood pressure was greater than 140 mm Hg or their diastolic blood pressure was greater than 90 mm Hg, or if they reported taking medication for hypertension.12
Statistical Methods
The proportion of women using HRT per month, pt, was calculated for the whole sample and for each category of social class, educational level, hypertension, and obesity status, where the discrete variable t = 1 to 14 enumerated the months from January 2002 to February 2003. The outcome variable was the logit of pt defined as yt = log( pt/[1 − pt ]). A regression-based time series (first-order autoregressive) change point (2-phase) model was fitted with maximal likelihood estimation separately to each social class, education, hypertension, and obesity category.13 Because the model was fitted to the logit transformation of pt, the parameter estimates can be interpreted as odds ratios.14
To test for change in the monthly use of HRT from any specific month onward (step change), we created a binary dummy variable sm, corresponding to the month tm at which a change was hypothesized to have occurred, taking the value 0 when t < tm and 1 when t ≥ tm. In this model, for example, the discrete variable tm = 6 to 10 indexed the months from June 2002 to October 2002, the period during which a change in use would be expected if the publicity surrounding the trials had an effect. Another dummy variable um was created to test if a unique change had occurred in the month t; this variable took the value 0 when t ≠ tm and 1 when t = tm. Higher-order polynomial terms were created, for example, the quadratic term for the first section (which covered months before tm ) was tf2 = (t − tm)2, where t ranged over all 14 time points. All quadratic and cubic terms were standardized for ease of interpretation. The interaction of the higher-order terms with the dummy variable sm then represented the change in the higher-order term between the 2 sections of the data (months before tm and months including and after tm ). An odds ratio of less than 1 for any of these interactions represented a decrease in this term describing the period between the earlier (months before tm ) and later (months including and after tm ) periods. So that the change in the linear coefficient (the parameter of interest) could be correctly assessed in the presence of higher-order terms in the model, we included all significant (P < .05) higher-order terms as well as all interactions with the dummy variable. We fitted a separate model for every tm. The magnitude of change in HRT use between the subgroups was compared with the Student t test.
RESULTS
Compared with nonparticipants from the original cohort, respondents were more likely to be from the nonmanual social class (73.3% vs 63.7%) and were more likely to have advanced secondary or higher educational qualifications (31.6% vs 17.4%). Over the study period from January 1999 until May 2002 the overall percentage of HRT users was reasonably constant (between 30% and 32%), but declined thereafter to less than 26% by February 2003 (Figure 1 ▶).
FIGURE 1—
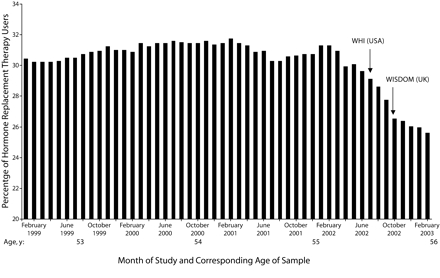
Monthly percentage of hormone replacement therapy users (women aged 53 to 56 years) in the Medical Research Council National Survey of Health and Development between January 1999 and February 2003.
Over the entire study period, the group of women with no formal educational qualifications consistently had the lowest percentage of HRT users (Figure 2 ▶). The proportion of women on HRT with ordinary secondary qualifications was higher than that of those with advanced secondary qualifications (with the exception of April to May 2000, not shown). In the last 14 months of the study period shown in Figure 2 ▶, the proportions on HRT in all 3 educational groups had declined by approximately 5% from January 2002 to February 2003; for instance, the proportion of women with no formal educational qualifications using HRT dropped from 28% to 23%.
FIGURE 2—
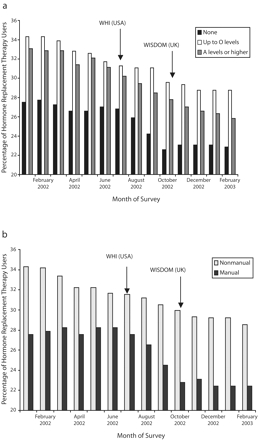
Monthly percentage of hormone replacement therapy users (women aged 55 to 56 years) in the Medical Research Council National Survey of Health and Development between January 1999 and February 2003, by educational level (a) and adult social class (b).
The proportion of women on HRT from the manual social class group (based on their current or last occupation at the age of 53 years) was consistently lower than that of the non-manual group (the difference ranging from 3% to 9%), and the greatest decline in HRT use occurred in the manual group, from more than 28% down to 22% after November 2002. In the last 14 months of data shown in Figure 2 ▶, the difference between these groups was more than 6% after August 2002.
For the period starting January 2002, the regression-based time-series change point models were fitted to the distribution of the proportions of HRT users stratified by educational qualification level and social class group (Table 1 ▶). There was evidence for differences in the timing and magnitude of trend changes for women with different levels of educational qualifications (Table 1 ▶). Among women with no formal qualifications, the largest decline in the linear coefficient occurred in July (odds ratio [OR]=0.64; 95% confidence interval [CI]=0.58, 0.71), compared with other months, as well as a significant unique change (OR=0.82; 95% C=0.77, 0.87). The odds ratio of less than 1 for the change in linear trend indicated a steeper decrease in HRT use after July than before. Both the unique change and the linear trend change were greater than those observed in other educational groups (P<.001). Among women with up to ordinary secondary qualifications, a unique change also occurred in July (OR=0.94; 95% CI=0.90, 0.98). By contrast, for women with advanced secondary or higher qualifications, significant changes in linear trend and a step change for the decline in HRT use occurred earlier, in June (OR=0.79; 95% CI=0.72, 0.87; and OR=0.86; 95% CI=0.79, 0.93, respectively), which is the earliest month that was tested in this analysis.
TABLE 1—
Odds Ratios (95% Confidence Intervals) Corresponding to Hormone Replacement Therapy by Educational Qualifications and Social Class of Head of Household, From Time Series Analysis: United Kingdom, June and July 2002a
| Educational Qualifications | Social Class of Head of Household | |||||||||
| No Formal Qualifications | Up to Ordinary Secondary Qualifications | Advanced Secondary or Higher Qualifications | Manual | Nonmanual | ||||||
| OR (95% CI) | P | OR (95% CI) | P | OR (95% CI) | P | OR (95% CI) | P | OR (95% CI) | P | |
| June | ||||||||||
| Trend over time | ||||||||||
| Linear | 1.12 (0.70, 1.79) | .6 | 1.10 (0.90, 1.35) | .3 | 1.21 (1.1, 1.34) | .009 | ||||
| Quadratic | 1.05 (0.88, 1.25) | .5 | 1.05 (0.97, 1.13) | .2 | 1.08 (1.04, 1.13) | .006 | ||||
| Cubic | 1.01 (0.99, 1.03) | .5 | 1.01 (1.00, 1.01) | .2 | 1.01 (1, 1.01) | .005 | ||||
| Step change | 0.97 (0.68, 1.40) | .9 | 0.90 (0.76, 1.06) | .2 | 0.86 (0.79, 0.93)* | .008* | ||||
| Unique change | 0.85 (0.71, 1.01) | .1 | 1.05 (0.98, 1.12) | .2 | 1.01 (0.97, 1.05) | .8 | ||||
| Change in | ||||||||||
| Linear term | 0.85 (0.53, 1.37) | .5 | 0.92 (0.75, 1.12) | .4 | 0.79 (0.72, 0.87)* | .003* | ||||
| Quadratic term | 0.95 (0.79, 1.13) | .5 | 0.94 (0.87, 1.02) | .1 | 0.92 (0.89, 0.96) | .006 | ||||
| Cubic term | 0.99 (0.98, 1.01) | .6 | 1 (0.99, 1) | .3 | 0.99 (0.99, 1) | .006 | ||||
| July | ||||||||||
| Trend over time | ||||||||||
| Linear | 1.18 (1.09, 1.28) | .01 | 1.05 (0.99, 1.11) | .2 | 1.04 (0.94, 1.16) | .4 | 1.21 (1.15, 1.28) | .002 | 1.07 (1.02, 1.12) | .04 |
| Quadratic | 1.05 (1.03, 1.08) | .01 | 1.03 (1.01, 1.04) | .04 | 1.02 (0.99, 1.05) | .2 | 1.07 (1.05, 1.09) | .001 | 1.02 (1.01, 1.04) | .03 |
| Cubic | 1.01 (1.00, 1.01) | .01 | 1.003 (1.001, 1.004) | .03 | 1.002 (0.998, 1.005) | .3 | 1.01 (1.01, 1.01) | .001 | 1 (1, 1) | .05 |
| Step change | 1.05 (0.97, 1.13) | .2 | 0.99 (0.93, 1.05) | .7 | 0.91 (0.83, 1.01) | .1 | 0.97 (0.91, 1.02) | .2 | 0.99 (0.95, 1.04) | .7 |
| Unique change | 0.82 (0.77, 0.87)* | .002* | 0.94 (0.9, 0.98)* | .04* | 0.95 (0.88, 1.02) | .2 | 0.86 (0.82, 0.89)* | .002* | 0.92 (0.89, 0.96)* | .009* |
| Change in | ||||||||||
| Linear term | 0.64 (0.58, 0.71)* | <.001* | 0.92 (0.86, 0.99) | .07 | 0.92 (0.84, 1.02) | .1 | 0.69 (0.65, 0.75)* | <.001* | 0.84 (0.79, 0.9)* | .004* |
| Quadratic term | 1.01 (0.98, 1.04) | .5 | 0.97 (0.95, 0.99) | .04 | 0.98 (0.94, 1.01) | .2 | 0.96 (0.94, 0.98) | .01 | 1 (0.98, 1.01) | .6 |
| Cubic term | 0.99 (0.99, 0.99) | .002 | 0.998 (0.996, 1.00) | .1 | 0.998(0.996, 1.002) | .4 | 0.99 (0.99, 0.99) | <.001 | 1 (1, 1) | .02 |
Note. OR = odds ratio; CI = confidence interval.
aFor clarity of presentation, results were presented only for months where significant changes in HRT use occurred.
*P ≤ .05 for parameters of interest only (step change, unique change, and change in linear term).
A decline in the linear trend in HRT use was detected in July for women from both social classes as defined by the head of household; however, the decline was greater (P < .001) for the manual group than for the nonmanual group (OR = 0.69; 95% CI = 0.65, 0.75; and OR = 0.84; 95% CI = 0.79, 0.90, respectively). Similar results (not shown) were obtained when we used social class as defined by the women’s own occupational class at the age of 53 years.
The proportion of women with hypertension on HRT ranged from 29.5% in January 2002 to 23.5% in February 2003. These proportions were consistently lower than those of the nonhypertensive group (the difference ranging from 2.6% to 5%). The proportion of obese women on HRT ranged from 24.7% in January 2002 to 20.1% in February 2003, whereas the proportion of nonobese women ranged from 34.9% to 28.6% during the same period (results not shown). For women with different levels of CVD risk, declines in the linear trend for HRT use were again only detected for July (Table 2 ▶). Significant differences (P < .05) were found in the magnitude of these changes for women with hypertension (OR = 0.75; 95% CI = 0.69, 0.82) compared with the nonhypertensive group (OR = 0.84; 95% CI = 0.78, 0.89). Similarly, the magnitude of linear trend decline was greater (P < .0001) for obese women than for the nonobese group (OR = 0.66; 95% CI = 0.61, 0.72 and OR = 0.82; 95% CI = 0.76, 0.89, respectively).
TABLE 2—
Odds Ratios (95% Confidence Intervals) Corresponding to Hormone Replacement Therapy by Cardiovascular Risk Factors, From Time Series Analysis: United Kingdom, July 2002a
| Blood Pressure Group | BMI Group | |||||||
| Hypertensiveb | Nonhypertensive | Obese (BMI ≥ 30 kg/m2) | Nonobese (BMI < 30kg/m2) | |||||
| OR (95% CI) | P | OR (95% CI) | P | OR (95% CI) | P | OR (95% CI) | P | |
| July | ||||||||
| Trend over time | ||||||||
| Linear | 1.07 (1, 1.15) | .09 | 1.12 (1.06, 1.18) | .01 | 1.28 (1.19, 1.37) | .002 | 1.08 (1.01, 1.14) | .05 |
| Quadratic | 1.02 (0.99, 1.04) | .1 | 1.05 (1.03, 1.07) | .004 | 1.08 (1.06, 1.11) | .001 | 1.03 (1.01, 1.05) | .03 |
| Cubic | 1.0001 (0.998, 1.004) | .2 | 1.01 (1.003, 1.004) | .004 | 1.007 (1.005, 1.009) | .002 | 1.003 (1.001, 1.005) | .03 |
| Step change | 1.09 (1.02, 1.16)* | .04* | 0.95 (0.9, 1) | .1 | 0.96 (0.89, 1.02) | .2 | 1 (0.94, 1.06) | .9 |
| Unique change | 0.83 (0.79, 0.88)* | .002* | 0.94 (0.9, 0.98)* | .03* | 0.86 (0.82, 0.91)* | .004* | 0.9 (0.86, 0.95)* | .01* |
| Change in | ||||||||
| Linear term | 0.75 (0.69, 0.82)* | .002* | 0.84 (0.78, 0.89)* | .005* | 0.66 (0.61, 0.72)* | < .001* | 0.82 (0.76, 0.89)* | .005* |
| Quadratic term | 1.02 (1, 1.05) | .09 | 0.96 (0.94, 0.98) | .01 | 0.95 (0.92, 0.97) | .007 | 0.99 (0.97, 1.01) | .5 |
| Cubic term | 0.995 (0.992, 0.997) | .01 | 0.9995 (0.994, 0.997) | .006 | 0.99 (0.99, 0.99) | .002 | 1 (0.99, 1) | .009 |
Note. OR = odds ratio; CI = confidence interval; BMI = body mass index.
aFor clarity of presentation, results were presented only for months where significant changes in HRT use occurred.
bSystolic blood pressure > 140 mm Hg or diastolic blood pressure > 90 mm Hg, or taking medication for hypertension.
*P ≤ .05 for parameters of interest only (step change, unique change, and change in linear term).
DISCUSSION
This study of women from a nationally representative cohort found that over the study period from January 1999 until March 2002, the overall percentage of HRT use was reasonably constant (between 30% and 32%) but declined thereafter to less than 26% by February 2003. Analysis for the last 14 months of the study from January 2002 to February 2003 detected differences in the timing of significant changes in the trend according to educational level. For women with no formal educational qualifications and those with no higher-than-secondary qualifications, a significant change in the trend, marking the onset of a steeper decline in HRT use, occurred in July 2002. The significant change in trend among women with advanced secondary or degree qualifications was detected 1 month earlier, in June 2002. In addition, among women with no formal educational qualifications and among those in the manual social class, the magnitude of decline in linear trend was larger than that among women in the other respective comparative groups.
These changes for July coincide with the cessation of the US-based WHI trial of HRT, in which reports highlighted the relative percentage increase in risk of disease, such as breast cancer. The disparity in the timing of changes by educational level may be caused by variation in measurement errors in the reporting of hormone use by women with different educational levels. It may also be possible that the differential across groups in the timing and magnitude of changes in HRT use reflects underlying differences in the influence and sources of information from the media and elsewhere. The general media in the United Kingdom did not report the cessation of the trial until July and August 2002, after a press release on July 9, 2002,3 but the decision to halt the WHI trial was made by the study’s Data and Safety Monitoring Board on May 30, 2002, and came into effect in June 2002.3,15
More generally, regarding HRT use across social classes, it was found that from the beginning of the study period (when women were 53 years of age) to the end of the period (when they were 56 years of age), the proportion of women on HRT in the NSHD study was significantly higher among those in the nonmanual social class group than among those in the manual group and was higher among those with formal educational qualifications than among those without. This agrees with a conjecture from earlier research16 on this cohort that greater relative HRT use would occur as a preventive measure in the nonmanual social class group as the cohort aged, despite higher use in order to relieve symptoms among the manual group before they were 50 years of age. However, for all social class and educational groups we found a significant decline in the overall proportion of women using HRT over the last 14 months of observations.
In terms of a differential impact of the reports from the WHI study on women at risk of CVD, we found that although the timing of changes in HRT coincided with the cessation of the WHI trial of HRT in July, differences existed in the magnitude of the linear trend change. Women from at-risk groups, as defined by having hypertension or being obese, reported a larger decline in the trend of HRT use than their respective comparative groups. The differential was greater between obese and nonobese women, possibly because obese women may be more aware of their clinical characteristics than those with hypertension. The results are consistent with at-risk women being more alarmed by the unexpected CVD results from the WHI trial and reinforces the need to address the potentially heightened concerns of at-risk groups.
In studies in New Zealand and the United States, far greater reductions in HRT use were reported in the 6 months following the cessation of the US WHI study than was evident in this study. The New Zealand sample consisted of women who were ineligible for, or withdrew their participation from, the New Zealand arm of the WISDOM study.17 Women from a large US health maintenance organization completed a survey about HRT use after receiving information on the results of the WHI shortly after its discontinuation.18 Data from US prescription databases showed a steep decline in the number of HRT prescriptions and tapering to lower doses after July 2002.19 Differences in study design complicate interpretation of the various results.
Although the results from the NSHD study also indicate evidence of a decline in HRT use that coincided with the cessation of the WHI trial and its coverage in the media, the impact of this news may have taken place during a more general period of decline in HRT use, and its effects may have simply hastened or sharpened what would have occurred in any case. No evidence was found regarding the effect of the announced cessation of the WISDOM trial in the United Kingdom in producing further declines in HRT use.
A potential limitation of this study is that all women were of the same age; therefore, it remains unclear whether the effect was different in other age groups. The influence on the pattern of use among younger women about to embark on HRT may have been greater than that among older women, who perhaps were more committed to long-term use. Alternatively, it may be that a drop in HRT use at approximately 56 years of age would be expected, even without negative publicity for HRT, as women complete the menopause transition and the risk of vasomotor symptoms is reduced. However, data on HRT use in UK women do not suggest a distinct drop in HRT use at approximately 56 years of age.20 Another limitation may be the use of self-reported data from the NSHD; however, a previous study has found high validity for self-reported HRT use when compared with population-based prescription databases as a reference.21 Women in our study were accustomed to providing monthly HRT histories on postal questionnaires completed annually when they were aged between 47 and 54 years, and this should be more sensitive in detecting immediate responses than other studies that have used routine prescribing data. Reports of HRT use on overlapping months from the questionnaires completed when participants were aged 53 or 54 years and the questionnaire completed when they were aged 57 years indicated fair to good level of agreement (κ statistics ranged from 0.45 to 0.6). A sensitivity analysis whereby information from the 2% of women (n=26 to 33) who provided inconsistent data on HRT use was excluded did not change the final results. However, it is possible that differential misreporting of HRT use occurred across the categories of educational level, social class, and CVD risk. It was not possible to report on any decline in dose of HRT among users, because this data was not available from January 1999 to February 2003.
These results highlight the need for health professionals to pay heed to the potential public health implications of reporting results from clinical trials to the media. Furthermore, they should be aware that such reports can have differential effects across educational, socioeconomic, and clinically at-risk groups. These may reflect underlying differences in attitudes toward the treatment under investigation, its associated risks, and the varied influence of media coverage and sources of information.
Acknowledgments
The Medical Research Council provided funding for the National Survey of Health and Development.
We also thank the reviewers for their comments and suggestions.
Human Participant Protection This study was approved by the North Thames Multi-center research ethics committee.
Peer Reviewed
Contributors G. Mishra participated in the development of the study hypothesis, reviewed the literature, performed statistical analysis, provided interpretation of results, and re-drafted and edited the article. H. Kok participated in the study design, performed preliminary statistical analyses, and drafted the original version of the article. R. Ecob participated in designing the statistical analyses of the study. R. Cooper and R. Hardy participated in the data preparation. D. Kuh originated the study and the initial study hypothesis, managed the data collection, and revised the article. All authors helped to interpret the findings and review drafts of the article.
References
- 1.Lewis J, Speers T. Misleading media reporting? The MMR story. Natl Rev. 2003;3:913–918. [DOI] [PubMed] [Google Scholar]
- 2.Clements C, Ratzan S. Mislead and confused? Telling the public about MMR vaccine safety. J Med Ethics. 2003;29:22–26. [DOI] [PMC free article] [PubMed] [Google Scholar]
- 3.NIH News release. NHLBI Stops Trial of Estrogen Plus Progestin Due to Increased Breast Cancer Risk, Lack of Overall Benefit. Available at: http://www.nih.gov/news/pr/jul2002/nhlbi-09.htm. Accessed March 18, 2006. [PubMed]
- 4.Patel A, Norton R, MacMahon S. The HRT furor: getting the message right. Med J Aust. 2002;177: 345–356. [DOI] [PubMed] [Google Scholar]
- 5.Writing group for the Women’s Health Initiative. Risks and benefits of estrogen plus progestin in healthy postmenopausal women. Principal results from the Women’s Health Initiative randomized controlled trial. JAMA. 2002;288:321–333. [DOI] [PubMed] [Google Scholar]
- 6.Vickers M, Meade T, Darbyshire J. WISDOM: history and early demise—was it inevitable? Climacteric. 2002;5:317–325. [PubMed] [Google Scholar]
- 7.Krieger N, Lowy I, Aronowitz R, et al. Hormone replacement therapy, cancer, controversies, and women’s health: historical, epidemiological, biological, clinical, and advocacy perspectives. J Epidemiol Community Health. 2005;59:740–748. [DOI] [PMC free article] [PubMed] [Google Scholar]
- 8.Kuh D, Hardy R. Women’s health in midlife: findings from a British birth cohort study. J Br Menopause Soc. 2003;9:55–60. [DOI] [PubMed] [Google Scholar]
- 9.Wadsworth ME, Butterworth SL, Hardy RJ, et al. The life course prospective design: an example of benefits and problems associated with study longevity. Soc Sci Med. 2003;57:2193–2205. [DOI] [PubMed] [Google Scholar]
- 10.Mishra G, Kuh D. Perceived change in quality of life during the menopause. Soc Sci Med. 2006;62: 93–103. [DOI] [PubMed] [Google Scholar]
- 11.Hardy R, Kuh D, Langenberg C, Wadsworth ME. Birthweight, childhood social class, and change in adult blood pressure in the 1946 British birth cohort. Lancet. 2003;362:1178–1183. [DOI] [PubMed] [Google Scholar]
- 12.Joint British recommendations on prevention of coronary heart disease in clinical practice: summary. British Cardiac Society, British Hyperlipidaemia Association, British Hypertension Society, British Diabetic Association. BMJ. 2000;320:705–708. [DOI] [PMC free article] [PubMed] [Google Scholar]
- 13.Lombard F, Hart J. The analysis of change-point data with dependent errors. In: Carlstein E, Muller H, Siegmund D, eds: Change Point Problems. Hayward, Calif: Institute of Mathematical Statistics; 1994: 194–209.
- 14.Armitage P, Berry G, Mathews J. Statistical Methods in Medical Research. Oxford, England: Blackwell Science; 2002.
- 15.WHI Participants Website. Study updates. Available at: http://www.whi.org/updates/update_hrt2002.php. Accessed March 9, 2006.
- 16.Kuh D, Hardy R, Wadsworth M. Social and behavioural influences on the uptake of hormone replacement therapy among younger women. Br J Obstet Gynaecol. 2000;107:731–739. [DOI] [PubMed] [Google Scholar]
- 17.Lawton B, Rose S, McLeod D, Dowell A. Changes in use of hormone replacement therapy after the report from the Women’s Health Initiative: cross sectional survey of users. BMJ. 2003;327:845–846. [DOI] [PMC free article] [PubMed] [Google Scholar]
- 18.Ettinger B, Grady D, Tosteson A, Pressman A, Macer J. Effect of the Women’s Health Initiative on women’s decisions to discontinue postmenopausal hormone therapy. Obstet Gynaecol. 2003;102:1225–1232. [DOI] [PubMed] [Google Scholar]
- 19.Hersh A, Stefanick M, Stafford R. National use of postmenopausal hormone therapy: annual trends and response to recent evidence. JAMA. 2004;291:47–53. [DOI] [PubMed] [Google Scholar]
- 20.Million Women Study Collaborators. Patterns of use of hormone replacement therapy in one million women in Britain, 1996–2000. Br J Obstet Gynaecol. 2002;109:1319–1330. [DOI] [PubMed] [Google Scholar]
- 21.Løkkegaard E, Johnsen S, Heitmann B, et al. The validity of self-reported use of hormone replacement therapy among Danish nurses. Acta Obstet Gynecol Scand. 2004;83:476–481. [DOI] [PubMed] [Google Scholar]