

Abstract
Objectives. We investigated whether vasomotor symptom reporting or patterns of change in symptom reporting over the perimenopausal transition among women enrolled in a national study differed according to race/ethnicity. We also sought to determine whether racial/ethnic differences were explained by sociodemographic, health, or lifestyle factors.
Methods. We followed 3198 women enrolled in the Study of Women’s Health Across the Nation during 1996 through 2002. We analyzed frequency of vasomotor symptom reporting using longitudinal multiple logistic regressions.
Results. Rates of vasomotor symptom reporting were highest among African Americans (adjusted odds ratio [OR]=1.63; 95% confidence interval [CI]=1.21, 2.20). The transition to late perimenopause exhibited the strongest association with vasomotor symptoms (adjusted OR = 6.64; 95% CI = 4.80, 9.20). Other risk factors were age (adjusted OR=1.17; 95% CI=1.13, 1.21), having less than a college education (adjusted OR = 1.91; 95% CI = 1.40, 2.61), increasing body mass index (adjusted OR=1.03 per unit of increase; 95% CI=1.01, 1.04), smoking (adjusted OR=1.63; 95% CI=1.25, 2.12), and anxiety symptoms at baseline (adjusted OR=3.10; 95% CI=2.33, 4.12).
Conclusions. Among the risk factors assessed, vasomotor symptoms were most strongly associated with menopausal status. After adjustment for covariates, symptoms were reported most often in all racial/ethnic groups in late perimenopause and nearly as often in postmenopause.
Hot flashes, night sweats, or cold sweats affect most women during the menopausal transition.1,2 However, data are sparse on changes in rates of vasomotor symptom reporting over the menopausal transition, particularly among non-White women. Two studies have shown higher symptom rates among African American women,3–6 whereas another has not.7 Several studies have reported reduced frequencies of symptoms among Asian women.3,8–13 Because Asian women tend to weigh less than African American women, these findings are contrary to the expectation that fewer heavier women will experience vasomotor symptoms owing to the greater estrone production in peripheral fat that stems from aromatization of androstenedione.14–16 Thus, differences in other factors are likely to account for ethnic differences in vasomotor symptoms.
In addition to differences in body size, hypotheses regarding racial/ethnic differences in reports of vasomotor symptoms include differences in hormone levels,17,18 socioeconomic status,3,7,19–24 active or passive exposure to tobacco smoke,4,7,19,21,24–27 diet,28–38 physical activity,3,39 and psychosocial factors.4,5 Determining whether race/ ethnicity-specific differences in rates of vasomotor symptoms are independent of these factors will help clarify the physiology of such symptoms and provide valuable information for women and clinicians about high-risk groups and potential behavioral interventions.
Most previous studies of non-White women have not been longitudinal or community based, nor have their analyses adjusted for confounding factors. The longitudinal data and diverse ethnic groups included in the Study of Women’s Health Across the Nation (SWAN) provided an opportunity to examine whether racial/ethnic differences in vasomotor symptoms persist as women undergo the perimenopausal transition, whether changes in symptom rates over the transition vary according to race/ethnicity, and whether racial/ ethnic differences can be explained by differences in the factors just described. Our hypotheses were as follows:
Within each menopausal transition category, more African American and Hispanic and fewer Chinese and Japanese women than White women will report vasomotor symptoms, but the relative amount of change in vasomotor symptoms as women progress from one perimenopausal transition stage to the next will not differ according to race/ethnicity.
Racial/ethnic differences in the occurrence of vasomotor symptoms will be independent of differences in socioeconomic status, menopausal status, body mass index (BMI), active or passive tobacco smoke exposure, dietary phytoestrogen intake, caffeine or alcohol consumption, physical activity level, premenstrual symptoms, symptom sensitivity, depression, anxiety, perceived stress, and social support.
Racial/ethnic differences in the occurrence of vasomotor symptoms will not vary according to educational attainment, BMI, or menopausal status.
METHODS
Study Population
In SWAN, 16 065 women at 7 sites underwent a screening interview during 1995 to 1997 to assess their eligibility for a longitudinal cohort.40 Each site screened one minority population (African American women in Pittsburgh, Boston, the Detroit area, and Chicago; Japanese women in Los Angeles; Chinese women in the Oakland, Calif, area; and Hispanic women in New Jersey) and one White population taken from a community-based sample of women aged 40 to 55 years residing near the site. Women who spoke English or Spanish (New Jersey), Cantonese (Oakland), or Japanese (Los Angeles) were eligible.
Baseline eligibility criteria included the following: age 42 to 52 years, intact uterus and at least one ovary, not currently using exogenous hormones affecting ovarian function, menstrual period in the previous 3 months, and self-identification as a member of a site’s designated racial/ethnic group. Each site recruited approximately 450 eligible participants (a total of 3302), and annual clinical examinations were conducted. We excluded women who had missing baseline data on vasomotor symptoms (n = 104) or missing covariate data (n = 414) from the present longitudinal analyses, which included data through the fifth annual visit (2001–2002). Thus, the sample size for our final multivariate longitudinal models (including baseline through the fifth annual visit) was 2784. Each woman could contribute up to 6 observations; the average number of observations was 4.3. The overall SWAN retention rate was 79.3% through the fifth visit.
Data Collection
The 3-hour baseline and 2-hour annual clinic visits included an in-person interview, self-administered questionnaires, and measurement of weight, height (with calibrated scales and a stadiometer), and waist and hip circumferences. Common protocols were used at all sites, and all study staff were trained and certified in administering the protocols. All data collection instruments were translated into Cantonese, Japanese, and Spanish and back-translated; discrepancies in translation were resolved by a pair of translators.
Outcomes
At each annual visit, participants reported the number of days in the preceding 2 weeks they had experienced each of 3 vasomotor symptoms (hot flashes, cold sweats, and night sweats).17,41,42 Factor analyses showed similarly high single-factor loadings for these symptoms (cold sweats, 0.73; night sweats, 0.75; hot flashes, 0.68), indicating that they were substantially correlated. Thus, all 3 were considered vasomotor symptoms, and these symptoms were evaluated in 2 different ways. First, we compared characteristics of women reporting any versus no vasomotor symptoms in the previous 2 weeks. Second, we compared women reporting 6 or more days of any vasomotor symptoms (as an indicator of severity and a more clinically meaningful outcome) with women reporting no or fewer than 6 days of symptoms.
Independent Variables
Primary race/ethnicity was self-reported as Black or African American, non-Hispanic White, Chinese or Chinese American, Japanese or Japanese American, or Hispanic (Central American, Cuban or Cuban American, Dominican, Mexican or Mexican American, Puerto Rican, South American, Spanish or other Hispanic). Menopausal status was classified as premenopausal, indicating a menstrual period in the previous 3 months and no change in menstrual regularity in the preceding year; early perimenopausal, indicating menses in the previous 3 months and changes in regularity in the past year; late perimenopausal, indicating no menses in the previous 3 months but menses in the preceding 11 months; or postmenopausal, indicating 12 or more months of amenorrhea. Women who had undergone a hysterectomy or bilateral oophorectomy (or both) or who had begun using menopausal hormone therapy during follow-up were censored in the analyses at the time of surgery or hormone therapy initiation (n=807 as the fifth visit).
Covariates
Demographic variables assessed for confounding (the presence of an association at P<.15 with race/ethnicity and vasomotor symptom reporting) included age, income, education, employment, difficulty paying for basic necessities (food, shelter, and heat), marital status, parity, and site. Psychosocial variables included symptom sensitivity at the first follow-up visit (1997–1998) (summed score of degree of awareness of loud noise, hot or cold, hunger, pain, and things happening in one’s body; sensitivity ratings ranged from not at all true [1] to extremely true [5]),43 social support (summed scale assessing how often 4 types of needed emotional and instrumental support were available; responses ranged from none of the time [0] to all of the time [4]),44 perceived stress (summed scale assessing how often over the preceding 2 weeks 4 aspects of stress were experienced; responses ranged from never [1] to very often [5]),45 depressive symptoms (score of 16 or above on a 20-item scale assessing the extent to which each item had been experienced in the previous week),46 anxiety (summed score of numbers of days in the past 2 weeks in which 4 symptoms [irritability or grouchiness, feeling tense or nervous, pounding or racing heart, fearful for no reason] were experienced; responses ranged from no days [0] to every day [4]), and preferred language for reading and speaking (as a measure of acculturation).47
BMI was measured as weight in kilograms divided by height in meters squared. Women were classified as having a history of premenstrual symptoms if, at baseline, they reported that they had experienced abdominal cramps, breast tenderness, bloating, or mood changes in the previous year during at least half of their menstrual periods or in the week before them. Validated questions were used to obtain information on current smoking status48 and total person-hours per week of environmental tobacco smoke exposure.49 Nineteen questions were adapted50,51 to provide a summary physical activity score encompassing occupational activities, household and care-giving activities, sports and exercise activities, and daily routine activities.
Finally, we obtained baseline dietary data using a modified version of the 1995 Block Food Frequency Questionnaire52,53 that included 103 core items based on the responses of African American and White respondents in the Second National Health and Nutrition Examination Survey (NHANES).52,54 We used responses from Hispanic HANES55 respondents and focus groups to add foods for the Hispanic, Chinese, and Japanese versions of the questionnaire. Frequently consumed sources of dietary phytoestrogens were included as well56 (tofu, soymilk, soy sauce, and meat substitutes made from soy). Because genistein and daidzein are the largest components of phytoestrogen intake, and their intakes were highly correlated, our final analyses included only genistein.
Data Analyses
We used χ2 tests and analyses of variance to compute summary statistics for the study population and the frequency of vasomotor symptoms according to race/ ethnicity, menopausal transition stage, and covariates. To identify characteristics that were independently associated with vasomotor symptoms, we estimated multivariate longitudinal random (mixed) effects logistic regression models57 using the Stata (Stata Corp, College Station, Tex) xtlogit procedure. This strategy permitted women to contribute different numbers of observations and to remain in the models even if they missed visits.
By including random intercepts in the regression models, this approach also accounted for correlations between repeated observations for each woman resulting from the longitudinal design. These random intercepts were woman-specific terms indicating that each woman had a different starting value and that the correlation matrix varied from one woman to another. The parameter estimates thus involved a woman-specific interpretation; that is, as an example, odds ratios could be interpreted as the odds of vasomotor symptoms for an early or late perimenopausal woman relative to when she was premenopausal.
Multivariate models were constructed for 2 binary outcomes: any versus no vasomotor symptoms and any symptoms for 6 or more days versus no or fewer than 6 days of symptoms in the previous 2 weeks. Factors associated with vasomotor symptoms in the bivariate analyses (at P < .15) or identified from the literature as potential covariates were included in these models. Age, menopausal status, marital status, social support, employment status, smoking status, and BMI were time-dependent variables. Race/ ethnicity and menopausal status were forced into the final multivariate models, which included variables associated with both vasomotor symptoms and race/ethnicity at the P < .15 level. We used backward elimination (retaining variables significant at P < .05) to obtain a final parsimonious multivariate model. Interactions of race/ethnicity with menopausal status, BMI, and education were tested to evaluate whether observed racial/ethnic differences in vasomotor symptoms varied according to physiology (menopausal status or BMI) or to reporting tendencies that might be reflected by educational level.
RESULTS
Sample Characteristics
At baseline, all covariates other than age differed significantly according to race/ethnicity (Table 1 ▶). In comparison with the other racial/ethnic groups at baseline, higher percentages of Chinese and Japanese women were premenopausal, reported low levels of environmental tobacco smoke exposure, and reported fewer premenstrual, depressive, or anxiety symptoms. Relative to other racial/ ethnic groups, significantly greater proportions of Hispanic women had less than a high school education, reported an annual income below $20 000, read or spoke no English, reported having difficulty paying for basic necessities, and were unemployed. His-panic women also had the lowest physical activity scores and the highest perceived stress scores. White women were least likely to be parous and had the highest daily intake of alcohol and the highest physical activity scores. African American women were the group most likely to be current smokers, and they were least likely to be married or have a partner; also, their BMIs and rates of environmental tobacco smoke exposure were highest.
TABLE 1—
Baseline Characteristics, by Race/Ethnicity: Study of Women’s Health Across the Nation, 1996–1997
| Whites (n = 1543) | African Americans (n = 930) | Hispanics (n = 284) | Chinese (n = 250) | Japanese (n = 281) | |
| Categorical variable,a no. (%) | |||||
| Premenopausal | 790 (52.3) | 457 (49.5) | 154 (57.9) | 153 (61.9) | 173 (62.2) |
| Education | |||||
| Less than high school | 24 (1.6) | 52 (5.6) | 128 (46.2) | 32 (12.8) | 2 (0.7) |
| High school | 225 (14.6) | 197 (21.3) | 70 (25.3) | 40 (16.0) | 49 (17.4) |
| Some college | 472 (30.7) | 377 (40.8) | 51 (18.4) | 54 (21.6) | 97 (34.5) |
| College | 337 (21.9) | 145 (15.7) | 21 (7.6) | 72 (28.8) | 86 (30.6) |
| More than college | 481 (31.2) | 153 (16.6) | 7 (2.5) | 51 (20.8) | 47 (16.7) |
| Annual household income, $ | |||||
| < 20 000 | 114 (7.5) | 198 (22.1) | 159 (57.4) | 12 (4.9) | 7 (2.6) |
| 20 000–34 999 | 208 (13.6) | 178 (19.9) | 66 (23.8) | 39 (15.9) | 23 (8.7) |
| 35 000–49 999 | 276 (18.0) | 189 (21.1) | 27 (9.8) | 45 (18.4) | 37 (14.0) |
| 50 000–74 999 | 403 (26.4) | 182 (20.3) | 14 (5.0) | 61 (24.9) | 74 (27.9) |
| ≥ 75 000 | 528 (34.5) | 149 (16.6) | 11 (4.0) | 88 (35.9) | 124 (46.8) |
| Difficulty paying for basics | |||||
| Very difficult | 90 (5.8) | 120 (12.9) | 73 (26.4) | 13 (5.2) | 10 (3.6) |
| Somewhat difficult | 407 (26.4) | 312 (33.6) | 156 (56.3) | 57 (22.8) | 74 (26.4) |
| Not very difficult | 1046 (67.8) | 498 (53.5) | 48 (17.3) | 180 (72.0) | 196 (70.0) |
| Employed | 1311 (84.7) | 739 (79.3) | 162 (57.5) | 223 (89.2) | 208 (74.0) |
| Marital status | |||||
| Single | 183 (12.0) | 200 (21.6) | 15 (5.5) | 22 (8.9) | 20 (7.1) |
| Married/partnered | 1085 (71.3) | 439 (47.3) | 198 (73.1) | 199 (80.2) | 227 (81.1) |
| Separated | 46 (3.0) | 67 (7.2) | 30 (11.1) | 3 (1.2) | 11 (3.9) |
| Widowed | 16 (1.1) | 39 (4.2) | 5 (1.8) | 4 (1.6) | 2 (0.7) |
| Divorced | 191 (12.6) | 183 (19.7) | 23 (8.5) | 20 (8.1) | 20 (7.1) |
| Parous | 1169 (75.8) | 851 (91.1) | 258 (93.5) | 216 (86.4) | 234 (83.3) |
| Current smoker | 257 (16.6) | 225 (24.6) | 47 (16.7) | 4 (1.6) | 36 (12.9) |
| Environmental tobacco smoke exposure, no. of person-hours/wk | |||||
| None | 606 (39.3) | 321 (34.7) | 179 (62.8) | 195 (78.0) | 172 (61.9) |
| 1–4 | 488 (31.6) | 238 (25.8) | 32 (11.2) | 39 (15.6) | 62 (22.3) |
| ≥5 | 448 (29.1) | 365 (39.5) | 74 (26.0) | 16 (6.4) | 44 (15.8) |
| Language used in reading/speaking | |||||
| Other than English | 0 (0.0) | 1 (0.1) | 201 (70.8) | 44 (17.8) | 86 (30.6) |
| Bilingual | 11 (0.7) | 1 (0.1) | 73 (25.7) | 110 (44.5) | 46 (16.4) |
| English only | 1526 (99.3) | 922 (99.8) | 10 (3.5) | 93 (37.7) | 149 (53.0) |
| Baseline anxiety (summed score ≥ 4) | 354 (22.9) | 223 (24.1) | 102 (35.7) | 34 (13.6) | 37 (13.2) |
| Depressive symptoms (score ≥ 16) | 351 (22.7) | 254 (27.2) | 123 (43.3) | 35 (14.0) | 41 (14.6) |
| No. of previous premenstrual symptomsb | |||||
| None | 71 (4.6) | 39 (4.2) | 9 (3.2) | 36 (14.8) | 33 (11.9) |
| 1 | 129 (8.3) | 87 (9.3) | 22 (7.7) | 59 (24.2) | 46 (16.5) |
| 2 | 266 (17.2) | 175 (18.8) | 56 (19.7) | 63 (25.8) | 84 (30.2) |
| 3 | 477 (30.8) | 295 (31.6) | 84 (29.6) | 46 (18.8) | 67 (24.1) |
| 4 | 605 (39.1) | 337 (36.1) | 113 (39.8) | 40 (16.4) | 48 (17.3) |
| Continuous variable,c mean (median) | |||||
| Age, y | 46.3 (46.1) | 46.2 (46.1) | 46.3 (46.1) | 46.5 (46.6) | 46.7 (46.7) |
| Body mass index, kg/m2 | 27.8 (26.1) | 31.5 (30.2) | 29.2 (28.3) | 23.3 (22.4) | 22.9 (22.1) |
| Physical activity score (range: 3–14) | 8.0 (8.1) | 7.3 (7.3) | 6.8 (6.6) | 7.3 (7.3) | 7.9 (7.8) |
| Alcohol consumption per day, kcal | 57.4 (13.3) | 33.6 (0.0) | 24.1 (0.0) | 9.5 (0.0) | 36.2 (0.0) |
| Daily genistein intake, μg | 833.6 (3.6) | 270.9 (1.7) | 310.3 (0.0) | 6398 (3661) | 11 165 (7091) |
| Daily caffeine consumption, mg | 278.9 (220.1) | 204.7 (142.0) | 207.3 (161.8) | 164.2 (117.3) | 258.4 (217.3) |
| Symptom sensitivity score at first follow-up visit (range: 0–20) | 10.0 (10.0) | 10.8 (11.0) | 10.3 (11.0) | 9.8 (10.0) | 9.6 (10.0) |
| Social support score (range: 0–16) | 12.6 (13.0) | 12.1 (13.0) | 11.0 (12.0) | 11.8 (12.0) | 13.2 (14.0) |
| Perceived stress score (range: 4–20) | 8.4 (8.0) | 8.5 (8.0) | 10.0 (11.0) | 8.2 (8.0) | 8.8 (9.0) |
aAll Ps < .0001.
bAbdominal cramps, breast tenderness, bloating, and mood changes.
cAll Ps < .0001 except for age (P = .1).
Unadjusted Analyses
At baseline, 11.4% of women reported 6 or more days of vasomotor symptoms in the previous 2 weeks, whereas 28.8% reported 1 to 5 days of symptoms and 59.8% reported no vasomotor symptoms. As of the fifth visit, 21.2% reported 6 or more days of vasomotor symptoms in the preceding 2 weeks, 34.3% reported 1 to 5 days of symptoms, and 44.5% reported no vasomotor symptoms. Compared with women reporting fewer than 6 days of symptoms within the previous 2 weeks, women reporting 6 or more days of symptoms at baseline were significantly less educated, less likely to be employed, and more likely to smoke or to have been exposed to environmental tobacco smoke. In addition, they were more likely to report premenstrual symptoms, to be depressed or anxious, and to be older, heavier, and less physically active (Table 2 ▶). Finally, they had significantly lower annual household incomes and more difficulty in paying for basic necessities, reported less alcohol consumption, had higher symptom sensitivity and perceived stress scores, and reported lower genistein intakes.
TABLE 2—
Unadjusted Associations of Vasomotor Symptoms (VMS) With Demographic, Lifestyle, and Psychosocial Characteristics at Baseline: Study of Women’s Health Across the Nation, 1996–1997
| No VMS or VMS for < 6 Days at Baseline (n=2835) | VMS for ≥6 Days at Baseline (n=363) | P | |
| Categorical variable, % | |||
| Ethnicity | <.0001 | ||
| White | 48.7 | 43.5 | |
| African American | 27.0 | 38.0 | |
| Hispanic | 8.8 | 10.5 | |
| Chinese | 8.1 | 4.7 | |
| Japanese | 7.4 | 3.3 | |
| Education | <.0001 | ||
| Less than high school | 6.9 | 10.8 | |
| High school | 17.3 | 20.8 | |
| Some college | 31.1 | 38.3 | |
| College | 20.8 | 13.1 | |
| More than college | 23.9 | 16.9 | |
| Annual household income, $ | <.0001 | ||
| < 20 000 | 14.1 | 25.6 | |
| 20 000–34 999 | 16.1 | 16.0 | |
| 35 000–49 999 | 18.2 | 13.4 | |
| 50 000–74 999 | 22.7 | 25.1 | |
| ≥75 000 | 28.9 | 19.9 | |
| Difficulty paying for basics | <.0001 | ||
| Very difficult | 8.5 | 16.6 | |
| Somewhat difficult | 30.0 | 33.4 | |
| Not very difficult | 61.5 | 50.0 | |
| Employed | 81.3 | 75.2 | <.01 |
| Marital status | .2 | ||
| Single | 13.5 | 14.5 | |
| Married/partnered | 66.4 | 60.9 | |
| Separated | 4.7 | 7.0 | |
| Widowed | 2.0 | 2.2 | |
| Divorced | 13.4 | 15.4 | |
| Parous | 82.3 | 86.4 | .05 |
| Current smoker | 16.3 | 26.7 | <.0001 |
| Environmental tobacco smoke exposure, no. of person-hours/wk | <.01 | ||
| None | 45.4 | 39.6 | |
| 1–4 | 26.6 | 23.4 | |
| ≥5 | 28.0 | 37.0 | |
| Language used in reading/speaking | .6 | ||
| Other than English | 9.2 | 8.9 | |
| Bilingual | 7.2 | 5.8 | |
| English only | 83.6 | 85.3 | |
| No. of previous premenstrual symptomsa | <.0001 | ||
| None | 5.8 | 3.0 | |
| 1 | 10.9 | 5.2 | |
| 2 | 20.1 | 14.9 | |
| 3 | 29.4 | 30.9 | |
| 4 | 33.8 | 46.0 | |
| Depressive symptoms (score ≥16) | 21.7 | 46.3 | <.0001 |
| Baseline anxiety (summed score ≥4) | 19.1 | 53.6 | <.0001 |
| Continuous variable, mean (median) | |||
| Age, y | 46.2 (46.0) | 47.1 (47.1) | <.0001 |
| Body mass index, kg/m2 | 28.1 (26.5) | 30.9 (29.6) | <.0001 |
| Physical activity score (range: 3–14) | 7.7 (7.6) | 7.3 (7.3) | <.001 |
| Alcohol consumption per day, kcal | 42.7 (6.6) | 41.6 (0.0) | <.01 |
| Daily genistein intake, μg | 1671.8 (3.9) | 1282.9 (1.7) | .03 |
| Daily caffeine consumption, mg | 237.9 (172.6) | 255.3 (190.2) | .19 |
| Symptom sensitivity score at first follow-up visit (range: 0–20) | 10.1 (10.0) | 11.0 (11.0) | <.0001 |
| Social support score (range: 0–16) | 12.4 (13.0) | 11.7 (12.0) | <.01 |
| Perceived stress score (range: 4–20) | 8.5 (8.0) | 9.5 (10.0) | <.0001 |
Note. In the case of continuous variables, P values are for medians.
aAbdominal cramps, breast tenderness, bloating, or mood changes.
We computed unadjusted, race-specific rates of vasomotor symptoms for the first visit at which a change in menopausal status was observed for each woman. A woman could thus contribute more than one observation to the data presented in the 2 panels of Figure 1 ▶. Rates of reports of any vasomotor symptoms (Figure 1a ▶) and any symptoms for 6 or more days (Figure 1b ▶) in the previous 2 weeks showed similar patterns according to race/ ethnicity and change in menopausal status, although rates for the former were generally higher. The highest rates were observed among African American women across all stages of the perimenopausal transition. Asian women had the lowest rates in most stages of the transition. In the case of all women, rates were highest in the early perimenopausal to late perimenopausal transition. Changes in rates in the late perimenopausal to postmenopausal transition, compared with the early to late perimenopausal transition, varied among the racial/ethnic groups.
FIGURE 1—
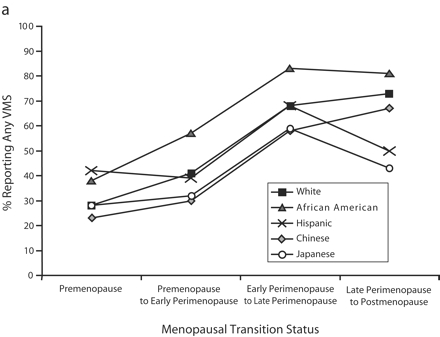

Prevalence of any vasomotor symptoms (a) and vasomotor symptoms reported for 6 or more days (b) in the preceding 2 weeks, by participants’ menopausal transition status and race/ethnicity: Study of Women’s Health Across the Nation, 1996–2002. Note. VMS = vasomotor symptoms. Prevalence was computed at the first visit at which a change in menopausal status was observed; women could thus contribute only one observation to each menopausal transition status category but could contribute more than one observation by progressing to different categories over the 5-year follow-up. Thus, observations in the 4 menopausal transition status categories were not mutually exclusive.
Multivariate Models
Four final random effects models were estimated: a full model and a backward stepwise regression model for each of the 2 outcomes (any vs no vasomotor symptoms and any symptoms for 6 or more days vs no symptoms or vasomotor symptoms for fewer than 6 days in the previous 2 weeks). Because the results of all 4 models were similar for significant variables and more frequent reports of symptoms may be more clinically meaningful, we describe, for the entire cohort and for each racial/ethnic group, only the full models focusing on 6 or more days of vasomotor symptoms.
In the case of all racial/ethnic groups other than Hispanics, the transition to late perimenopause was associated with the highest odds ratio for vasomotor symptoms (Table 3 ▶). African American women had a significantly elevated symptom odds ratio compared with White women. For the cohort overall, age, increasing BMI, less than a college education, current smoking, history of premenstrual symptoms, higher symptom sensitivity at the first follow-up visit, and more baseline anxiety and depressive symptoms were significantly, independently, and positively associated with reports of 6 or more days of vasomotor symptoms. These factors were also associated with symptoms in most of the racial/ethnic subgroups assessed; however, they were not always statistically significant owing to the small numbers of women in some of these groups who reported experiencing symptoms for 6 or more days.
TABLE 3—
Adjusted Odds Ratios for Reports of Frequent Vasomotor Symptoms Associated With Menopausal Status and Demographic, Lifestyle, and Psychosocial Factors: Study of Women’s Health Across the Nation, 1996–2002
| Odds Ratio (95% Confidence Interval) | ||||||
| Total Cohort (n = 2784) | Whites (n = 1371) | African Americans (n = 718) | Hispanics (n = 205) | Chinese (n = 227) | Japanese (n = 263) | |
| Menopausal transition status | ||||||
| Premenopause | Reference | Reference | Reference | Reference | Reference | Reference |
| Early perimenopause | 1.86 (1.47, 2.34)*** | 2.00 (1.42, 2.81)*** | 2.19 (1.43, 3.37)*** | 0.79 (0.40, 1.53) | 1.37 (0.54, 3.48) | 2.64 (0.94, 7.41) |
| Late perimenopause | 6.64 (4.80, 9.20)*** | 7.46 (4.61, 12.07)*** | 8.34 (4.61, 15.09)*** | 1.73 (0.64, 4.66) | 2.94 (0.79, 10.95) | 15.86 (4.11, 61.3)*** |
| Postmenopause | 4.96 (3.51, 7.01)*** | 6.33 (3.73, 10.72)*** | 5.27 (2.84, 9.79)*** | 1.73 (0.66, 4.54) | 2.23 (0.57, 8.72) | 9.36 (2.22, 39.44)** |
| Ethnicity | ||||||
| White | Reference | |||||
| African American | 1.63 (1.21, 2.20)** | |||||
| Hispanic | 0.57 (0.28, 1.18) | |||||
| Chinese | 0.58 (0.33, 1.02) | |||||
| Japanese | 0.80 (0.46, 1.39) | |||||
| Age (per year) | 1.17 (1.13, 1.21)*** | 1.16 (1.10, 1.22)*** | 1.18 (1.11, 1.26)*** | 1.04 (0.94, 1.15) | 1.29 (1.09, 1.52)** | 1.30 (1.11, 1.53)** |
| Body mass index (per unit) | 1.03 (1.01, 1.04)** | 1.03 (1.01, 1.05)* | 1.02 (0.99, 1.05) | 1.03 (0.98, 1.08) | 1.03 (0.93, 1.15) | 1.05 (0.97, 1.14) |
| Education | ||||||
| High school or less | 1.91 (1.40, 2.61)*** | 2.01 (1.24, 3.28)** | 2.22 (1.23, 4.00)** | 0.75 (0.27, 2.08) | 1.82 (0.59, 5.62) | 1.96 (0.54, 7.07) |
| Some college | 2.29 (1.76, 2.97)*** | 2.05 (1.42, 2.97)*** | 2.41 (1.45, 4.02)** | 0.50 (0.15, 1.63) | 6.51 (2.17, 19.52)** | 3.76 (1.48, 9.55)** |
| College or more | Reference | Reference | Reference | Reference | Reference | Reference |
| Current smoker | 1.63 (1.25, 2.12)*** | 1.14 (0.75, 1.73) | 1.98 (1.29, 3.03)** | 3.09 (1.53, 6.25)** | 2.97 (0.11, 81.55) | 1.49 (0.47, 4.66) |
| No. of previous premenstrual symptomsa | ||||||
| None | Reference | Reference | Reference | Reference | Reference | Reference |
| 1–2 | 2.34 (1.34, 4.06)** | 1.79 (0.74, 4.29) | 1.97 (0.65, 6.00) | 4.87 (0.45, 52.84) | 3.00 (0.73, 12.42) | 4.59 (0.86, 24.46) |
| 3–4 | 3.21 (1.87, 5.51)*** | 2.66 (1.14, 6.18)* | 2.83 (0.96, 8.35) | 7.84 (0.74, 83.16) | 2.83 (0.60, 13.27) | 6.35 (1.11, 36.38)* |
| Symptom sensitivity score at first follow-up visit (per unit) | 1.06 (1.03, 1.09)*** | 1.03 (0.98, 1.09) | 1.12 (1.06, 1.18)*** | 1.02 (0.94, 1.09) | 0.97 (0.85, 1.10) | 1.14 (1.01, 1.30)* |
| Baseline anxiety (summed score ≥4) | 3.10 (2.33, 4.12)*** | 2.59 (1.71, 3.91)*** | 3.65 (2.17, 6.13)*** | 1.64 (0.81, 3.33) | 17.3 (4.48, 66.95)*** | 3.36 (1.02, 11.08)* |
| Baseline depressive symptom score ≥16 | 1.62 (1.22, 2.15)** | 1.80 (1.18, 2.75)** | 1.25 (0.76, 2.06) | 2.25 (1.13, 4.48)* | 1.60 (0.40, 6.49) | 2.23 (0.66, 7.55) |
Note. All models were full models that included variables associated with vasomotor symptoms at the P < .15 level; all odds ratios were adjusted for all of the variables listed and were adjusted for study site. Data shown are for baseline through the fifth visit. Frequent symptoms were defined as reports of 6 or more days of symptoms (vs reports of no or fewer than 6 days of symptoms) in the previous 2 weeks.
aAbdominal cramps, breast tenderness, bloating, or mood changes.
* P < .05; **P < .01; ***P < .001.
Symptom sensitivity was significantly related to vasomotor symptoms only among African American and Japanese women. Baseline anxiety was significantly, strongly related to symptoms in all ethnic groups with the exception of Hispanics. Baseline depressive symptoms were positively associated with symptoms in all of the racial/ethnic groups, but the association was significant only among White and Hispanic women. The other covariates assessed were not significantly related to vasomotor symptoms in the multivariate models.
None of the interactions of race/ethnicity with education, BMI, or menopausal status were statistically significant, and thus they were not included in the final adjusted models. Two additional multivariate analyses were conducted: one in which observations among hormone therapy users (8% of all observations) were not censored, because these data were likely to reflect more severely symptomatic women, and one that included only women who reported no vasomotor symptoms at baseline, to reflect better the factors related to vasomotor symptom incidence. The same variables shown in Table 3 ▶ remained significant in these 2 models (data not shown), and, although ethnic group sample sizes were small, point estimates were similar in magnitude to those in Table 3 ▶.
DISCUSSION
This study is among the first, to our knowledge, to examine vasomotor symptoms longitudinally in a multiethnic sample of women undergoing the perimenopausal transition. We found that, of the factors assessed, menopausal status was most strongly related to vasomotor symptoms. In all racial/ethnic groups, vasomotor symptom reports increased dramatically as women progressed from premenopause to early perimenopause and even more dramatically as they made the transition to late perimenopause. Absolute rates differed according to race/ethnicity, indicating innate physiological or cultural differences in reporting. Compared with White women, significantly more African American women and fewer (although not significantly fewer) women from the other 3 racial/ethnic groups reported vasomotor symptoms.
As women became postmenopausal, their vasomotor symptom reporting remained nearly as high as in late perimenopause, except in the case of Japanese and Hispanic women. However, the numbers of these women (along with Chinese women) who made the transition to postmenopause were small, and most had been postmenopausal for less than 3 years; thus, the effect estimates for this category might not have been stable. Additional follow-up of the SWAN cohort is necessary to determine whether symptom reporting declines or remains high with increased passing of time after women’s final menstrual periods. In addition, those who made the transition earlier (i.e., stopped menstruating by the fifth visit) might not have been representative of all of those making the transition to postmenopause (e.g., the former were more likely to smoke and to have completed fewer years of education).58
Many factors were related to vasomotor symptoms independent of race/ethnicity and menopausal transition status. Older age, lower education level, and higher baseline anxiety score were significant risk factors in all racial/ ethnic subgroups with the exception of Hispanics. Current smoking and symptom reports were significantly related only among African American and Hispanic women, but positive associations were observed in all of the racial/ ethnic groups. Premenstrual symptoms were significantly related to vasomotor symptom reports among White and Japanese women, and again we observed positive associations in all racial/groups. Symptom sensitivity was a significant factor among African American and Japanese women. Baseline depressive symptoms were a significant factor only among White and Hispanic women, although we observed positive associations between depressive symptoms and reports of vasomotor symptoms in all racial/ethnic groups.
Consistency With Previous Findings
Ethnic differences in vasomotor symptom reporting similar to those found here have been reported previously,3,5,7,8,10,59 although no studies, to our knowledge, have examined longitudinal changes in vasomotor symptoms and changes in menopausal status according to race/ethnicity. We have shown previously that differences in symptom reporting are not due to speaking a language other than English.3 Increased vasomotor symptom reporting among African American women might be due to differences in perception and tolerance of temperatures. Several experimental studies have shown that African Americans have lower levels of tolerance to cold60 and heat61,62 than Whites and that more African Americans than Whites rate heat as being unpleasant.61 Thus, ethnic differences in perceptions and tolerance of thermal discomfort may extend to perceptions and reporting of vasomotor symptoms.
In contrast to the expectation that higher BMIs will have a protective effect owing to higher estrone production,14–16 the positive relation of BMI to vasomotor symptoms observed in our previous cross-sectional baseline examination4 was found again in this study and has been reported by others.6,18,19,63 We observed a statistically significant positive association between BMI and vasomotor symptoms among White women, but this association was not quite statistically significant in the other racial/ethnic groups. Many studies have reported associations between vasomotor symptoms and lower levels of educational attainment7,19–24 and current cigarette smoking,7,19,21,24–27 but none of these investigations have involved race/ethnic-specific analyses. Our analyses showed that these 2 variables were risk factors in all of the ethnic groups assessed, the only exception being low educational levels among Hispanic women (possibly as a result of the homogeneity of the Hispanic sample in terms of educational level).
Baseline genistein intake was not related longitudinally to vasomotor symptoms and did not account for reduced symptom reporting among Asian women after adjustment for covariates. Phytoestrogens, of which genistein is one type, have chemical structures similar to estradiol and selective estrogen receptor modulators,64 bind to estrogen receptors,65 and have weak estrogenic or antiestrogenic effects depending on their concentration and concentrations of endogenous estrogens and other dietary factors.66,67 Some randomized, controlled, masked trials focusing on soy supplementation have shown reductions in hot flashes,28–38 whereas others have not.68–71
Finally, our results indicate no effects of physical activity or caffeine or alcohol intake on reports of vasomotor symptoms, suggesting that changes in these behaviors are not likely to significantly influence vasomotor symptom reporting. The lack of an association with physical activity was consistent with some4,39,72 but not all23,73–77 previous studies; studies of the relationship between alcohol consumption and vasomotor symptoms have shown no4,7 or modest effects.6
Limitations and Strengths
In this longitudinal study, we assessed several factors in terms of their relationship to vasomotor symptoms, and thus any results that are significant at a borderline level must be interpreted cautiously. Also, measurement error was possible as a result of the data collection methods used in SWAN, and the possibility of such error was heightened in that some measures were self-reported and attempts were made to obtain data on comparable measures in 4 languages. Finally, the prevalence odds ratios presented here were overestimates of relative risks because the outcome (vasomotor symptoms) was not rare, with symptom reports ranging up to 80% in some subgroups.
A strength of the present study is that it was among the first to examine longitudinal changes in symptom reporting in a large, racially and ethnically diverse sample of midlife women experiencing the transition to perimenopause. This feature of the study, combined with the community-based sampling used in SWAN, allowed greater representativeness and thus enhanced the generalizability of the results. In addition, our careful control of a comprehensive set of demographic, reproductive, and medical variables in our multivariate models reduced the likelihood that the results were due to uncontrolled confounding.
Conclusions
We have produced new evidence that vasomotor symptoms are more strongly associated with changes in menopausal status than with other factors, particularly in the transition to late perimenopause. The strength of the association of symptom reporting with changes in menopausal status varied somewhat according to race/ethnicity, and racial/ ethnic differences in symptoms persisted after adjustment for other factors.
Older age, lower levels of educational attainment, and anxiety at baseline were independently associated with increased reports of vasomotor symptoms in all of the racial/ ethnic groups assessed with the exception of Hispanics. Increased BMI was associated with vasomotor symptom reports in all racial/ethnic groups, although significantly so only among Whites. Smoking, baseline depression, and premenstrual symptoms were positively associated with symptoms in the overall cohort. No significant associations were found with physical activity, dietary genistein, or alcohol or caffeine consumption. In summary, our findings suggest that vasomotor symptoms are frequently reported by midlife women, vary according to race/ethnicity over the menopausal transition, and are influenced by potentially modifiable factors such as smoking and body mass.
Acknowledgments
The Study of Women’s Health Across the Nation is supported by the National Institutes of Health (NIH), the Department of Health and Human Services through the National Institute on Aging, the National Institute of Nursing Research, and the NIH Office of Research on Women’s Health (grants NR004061, AG012505, AG012535, AG012531, AG012539, AG012546, AG012553, AG012554, and AG012495).
Human Participant Protection The study protocol was approved by the institutional review boards at all participating sites. All participants provided written informed consent.
Peer Reviewed
Contributors All of the authors contributed to the study design, the analysis of the data, and the writing of the article.
References
- 1.McKinlay SM, Brambilla DJ, Posner JG. The normal menopause transition. Maturitas. 1992;14:103–115. [DOI] [PubMed] [Google Scholar]
- 2.Kronenberg F. Hot flashes: epidemiology and physiology. Ann N Y Acad Sci. 1990;592:52–86. [DOI] [PubMed] [Google Scholar]
- 3.Gold EB, Sternfeld B, Kelsey JL, et al. The relation of demographic and lifestyle factors to symptoms in a multi-racial/ethnic population of women 40–55 years of age. Am J Epidemiol. 2000;152:463–473. [DOI] [PubMed] [Google Scholar]
- 4.Gold EB, Block G, Crawford S, et al. Lifestyle and demographic factors in relation to vasomotor symptoms in midlife women: baseline results from the Study of Women’s Health Across the Nation (SWAN). Am J Epidemiol. 2004;159:1189–1199. [DOI] [PubMed] [Google Scholar]
- 5.Avis N, Stellato R, Crawford S, Johannes C, Longcope C. Is there a menopausal syndrome? Menopausal status and symptoms across ethnic groups. Soc Sci Med. 2000;52:345–356. [DOI] [PubMed] [Google Scholar]
- 6.Freeman EW, Sammel MD, Grisso JA, Battistini M, Garcia-Espagna B, Hollander L. Hot flashes in the late reproductive years: risk factors for African American and Caucasian women. J Womens Health Gender Based Med. 2001;10:67–76. [DOI] [PubMed] [Google Scholar]
- 7.Schwingl PJ, Hulka BS, Harlow SD. Risk factors for menopausal hot flashes. Obstet Gynecol. 1994;84: 29–34. [PubMed] [Google Scholar]
- 8.Lock M. Contested meanings of the menopause. Lancet. 1991;337:1270–1272. [DOI] [PubMed] [Google Scholar]
- 9.Boulet MJ, Oddens BJ, Lehert P, et al. Climacteric and menopause in seven South-east Asian countries. Maturitas. 1994;19:157–176. [DOI] [PubMed] [Google Scholar]
- 10.Avis NE, Kaufert PA, Lock M, McKinlay S, Vass K. The evolution of menopausal symptoms. Baillieres Clin Endocrinol Metab. 1993;7:17–32. [DOI] [PubMed] [Google Scholar]
- 11.Chompootweep S, Tankeyoon M, Yamarat K, Poomsuwan P, Dusitsin N. The menopausal age and climacteric complaints in Thai women in Bangkok. Maturitas. 1993;17:63–71. [DOI] [PubMed] [Google Scholar]
- 12.Goodman MJ, Stewart CJ, Gilbert F. Patterns of menopause: a study of certain medical and physiological variables among Caucasian and Japanese women living in Hawaii. J Gerontol. 1977;32:291–298. [DOI] [PubMed] [Google Scholar]
- 13.Haines CJ, Chung TKH, Leung DHY. A prospective study of the frequency of acute menopausal symptoms in Hong Kong Chinese women. Maturitas. 1994; 18:175–181. [DOI] [PubMed] [Google Scholar]
- 14.Soule MR, Bremner WJ. The menopause and climacteric: endocrinologic basis and associated symptomatology. J Am Geriatr Soc. 1982;3:547. [DOI] [PubMed] [Google Scholar]
- 15.Grodin JM, Siiteri PK, MacDonald PC. Extraglandular estrogen in the postmenopause. In: Ryan KJ, Gibson DC, eds. The Menopause and Aging. Washington, DC: US Government Printing Office; 1973:15.
- 16.Nimrod A, Ryan KJ. Aromatization of androgens by human abdominal and breast fat tissue. J Clin Endocrinol Metab. 1975;40:367–372. [DOI] [PubMed] [Google Scholar]
- 17.Matthews KA, Wing RR, Kuller LH, Meilahn EN, Plantinga P. Influence of the perimenopause on cardiovascular risk factors and symptoms of middle-aged healthy women. Arch Intern Med. 1994;154: 2349–2355. [PubMed] [Google Scholar]
- 18.Wilbur J, Miller AM, Montgomery A, Chandler P. Sociodemographic characteristics, biological factors, and symptom reporting in midlife women. Menopause. 1998;5:43–51. [PubMed] [Google Scholar]
- 19.Li C, Samsioe G, Borgfeldt C, Lidfeldt J, Agardh CD, Nerbrand C. Menopause-related symptoms: what are the background factors? A prospective population-based cohort study of Swedish women (The Women’s Health in Lund Area study). Am J Obstet Gynecol. 2003;189:1646–1653. [DOI] [PubMed] [Google Scholar]
- 20.Kuh DL, Wadworth M, Hardy R. Women’s health in midlife: the influence of the menopause, social factors and health in earlier life. Br J Obstet Gynaecol. 1997;104:923–933. [DOI] [PubMed] [Google Scholar]
- 21.Avis N, Crawford S, McKinlay S. Psychosocial, behavioral, and health factors related to menopause symptomatology. J Womens Health. 1997;3:103–120. [PubMed] [Google Scholar]
- 22.Leidy LE. Menopausal symptoms and everyday complaints. Menopause. 1997;4:154–160. [Google Scholar]
- 23.Collins A, Landgren B-M. Reproductive health, use of estrogen and experience of symptoms in peri-menopausal women, a population-based study. Maturitas. 1995;20:101–111. [DOI] [PubMed] [Google Scholar]
- 24.Dennerstein L, Smith AMA, Morse CA, et al. Menopausal symptoms in Australian women. Med J Aust. 1993;159:232–236. [DOI] [PubMed] [Google Scholar]
- 25.Hunter MS. Predictors of menopausal symptoms: psychosocial aspects. Baillieres Clin Endocrinol Metab. 1993;7:33–45. [DOI] [PubMed] [Google Scholar]
- 26.Starpoli CA, Flaws JA, Bush TL, Mouton AW. Predictors of menopausal hot flashes. J Womens Health. 1998;7:1149–1155. [DOI] [PubMed] [Google Scholar]
- 27.Leidy L. Comparison of body size and age of menopause between Mexican-American and white American women. Ann N Y Acad Sci. 1990;592: 443–444. [Google Scholar]
- 28.Baird DD, Umbach DM, Lansdell L, et al. Dietary intervention study to assess estrogenicity of dietary soy among postmenopausal women. J Clin Endocrinol Metab. 1995;80:1685–1690. [DOI] [PubMed] [Google Scholar]
- 29.Shultz TD, Bonorden WR, Seaman WR. Effect of short-term flaxseed consumption on lignan and sex hormone metabolism in men. Nutr Res. 1991;11: 1089–1100. [Google Scholar]
- 30.Phipps WR, Martini MC, Lampe JW, Slavin JL, Kurzer MS. Effect of flax seed ingestion on the menstrual cycle. J Clin Endocrinol Metab. 1993;77: 1215–1219. [DOI] [PubMed] [Google Scholar]
- 31.Murkies AL, Lombard C, Strauss BJG, Wilcox G, Burger HG, Morton MS. Dietary flour supplementation decreases post-menopausal hot flushes: effect of soy and wheat. Maturitas. 1985;21:189–195. [DOI] [PubMed] [Google Scholar]
- 32.Albertazzi P, Pansini F, Bonaccorsi G, Zanotti L, Forni E, deAloysio D. The effect of dietary soy supplementation on hot flushes. Obstet Gynecol. 1998;91: 6–11. [DOI] [PubMed] [Google Scholar]
- 33.Harding C, Morton M, Gould V, et al. Dietary soy supplementation is estrogenic in menopausal women. Am J Clin Nutr. 1998;68(suppl):1532S. [Google Scholar]
- 34.Washburn S, Burke GL, Morgan T, Anthony M. Effect of soy protein supplementation on serum lipoproteins, blood pressure and menopausal symptoms in perimenopausal women. Menopause. 1999;6:7–13. [PubMed] [Google Scholar]
- 35.Scambia G, Mango D, Signorile PG, et al. Clinical effects of a standardized soy extract in postmenopausal women: a pilot study. Menopause. 2000;7:105–111. [DOI] [PubMed] [Google Scholar]
- 36.Brzezinski A, Adlercreutz H, Shaoul R, Schmueli A, Reosler A, Schenker JG. Short-term effects of phytoestrogen-rich diet on postmenopausal women. Menopause. 1997; 4:89–94. [Google Scholar]
- 37.Upmalis DH, Lobo R, Bradley L, Warren M, Cone FL, Lamia CA. Vasomotor symptom relief by soy isoflavone extract tablets in postmenopausal women: a multicenter, double-blind, randomized placebo controlled study. Menopause. 2000;7:236–242. [DOI] [PubMed] [Google Scholar]
- 38.Faure ED, Chantre P, Mares P. Effects of a standardized soy extract on hot flushes: a multicenter, double-blind, randomized placebo-controlled study. Menopause. 2002;9:329–334. [DOI] [PubMed] [Google Scholar]
- 39.Ivarsson T, Spetz AC, Hammar M. Physical exercise and vasomotor symptoms in postmenopausal women. Maturitas. 1998;29:139–146. [DOI] [PubMed] [Google Scholar]
- 40.Sowers MF, Crawford S, Morgenstein D, et al. Design, survey sampling and recruitment methods of SWAN: a multi-center, multi-ethnic, community-based cohort study of women and the menopausal transition. In: Lobos R, Marcus R, Kelsey JL, eds. Menopause. New York, NY: Academic Press Inc; 2000:175–188.
- 41.Neurgarten BL, Kraines RJ. Menopausal symptoms in women of various ages. Psychosom Med. 1965; 27:266–273. [DOI] [PubMed] [Google Scholar]
- 42.Avis NE, McKinlay SM. A longitudinal analysis of women’s attitudes toward the menopause: results from the Massachusetts Women’s Health Study. Maturitas. 1991;13:65–79. [DOI] [PubMed] [Google Scholar]
- 43.Barsky AJ, Goodson JD, Lane RS, Cleary PD. The amplification of somatic symptoms. Psychosom Med. 1988;50:510–519. [DOI] [PubMed] [Google Scholar]
- 44.Sherbourne CD, Stewart AL. The MOS social support survey. Soc Sci Med. 1991;32:705–714. [DOI] [PubMed] [Google Scholar]
- 45.Sheldon C, Williamson G. Perceived stress in a probability sample of the United States. In: Spacan S, Oskam S, eds. The Social Psychology of Health. New-bury Park, Calif: Sage Publications; 1988:31–67.
- 46.Radloff LS. The CES-D scale: a self-report depression scale for research in the general population. Appl Psychol Meas. 1977;1:385–401. [Google Scholar]
- 47.Marin G, Sabogal F, Marin BV, et al. Development of a short acculturation scale for Hispanics. Hispanic J Behav Sci. 1987;9:183–205. [Google Scholar]
- 48.Ferris BG. Epidemiology Standardization Project (American Thoracic Society). Am Rev Respir Dis. 1978; 118:1–120. [PubMed] [Google Scholar]
- 49.Coghlin J, Hammond SK, Gann PH. Development of epidemiologic tools for measuring environmental tobacco smoke exposure. Am J Epidemiol. 1989;130: 696–704. [DOI] [PubMed] [Google Scholar]
- 50.Sternfeld B, Ainsworth BA, Quesenberry CP Jr. Physical activity patterns in a diverse population of women. Prev Med. 1999;28:313–323. [DOI] [PubMed] [Google Scholar]
- 51.Baecke JAH, Burema J, Fritjers JER. A short questionnaire for the measurement of habitual physical activity in epidemiological studies. Am J Clin Nutr. 1982; 36:936–942. [DOI] [PubMed] [Google Scholar]
- 52.Block G, Hartman AM, Dresser CM, Carroll MD, Gannono J, Gardner L. A data-based approach to diet questionnaire design and testing. Am J Epidemiol. 1986;124:453–469. [DOI] [PubMed] [Google Scholar]
- 53.Subar AF, Thompson FE, Kipnis V, et al. Comparative validation of the Block, Willett, and National Cancer Institute food frequency questionnaires: the Eating at America’s Table Study. Am J Epidemiol. 2001;154: 1089–1099. [DOI] [PubMed] [Google Scholar]
- 54.Block G, Thompson F, Hartman AM, Larkin FA, Guire KE. Comparison of two dietary questionnaires validated against multiple dietary records collected during a 1-year period. J Am Diet Assoc. 1992;92: 686–693. [PubMed] [Google Scholar]
- 55.Block G, Norris JC, Mandel RM, DiSogra C. Sources of energy and six nutrients in diets of low-income Hispanic-American women and children: quantitative data from the HHANES survey, 1982–1984. J Am Diet Assoc. 1995;95:195–208. [DOI] [PubMed] [Google Scholar]
- 56.Reinli K, Block G. Phytoestrogen content of foods—a compendium of literature values. Nutr Cancer. 1996; 26:123–148. [DOI] [PubMed] [Google Scholar]
- 57.Diggle PJ, Heagerty PJ, Liang K-Y, Zeger S. Analysis of Longitudinal Data. 2nd ed. New York, NY: Oxford University Press Inc; 2002.
- 58.Gold EB, Bromberger J, Crawford S, et al. Factors associated with age at menopause in a multi-ethnic population of women. Am J Epidemiol. 2001;153: 865–874. [DOI] [PubMed] [Google Scholar]
- 59.Haines CJ, Chung TKH, Leung DHY. A prospective study of the frequency of acute menopausal symptoms in Hong Kong Chinese women. Maturitas. 1994; 18:175–181. [DOI] [PubMed] [Google Scholar]
- 60.Walsh NE, Schoefeld L, Ramamruty S, Hoffman J. Normative model for the cold pressor test. Am J Phys Med Rehabil. 1989;68:6–11. [DOI] [PubMed] [Google Scholar]
- 61.Edwards RR, Fillingim RB. Ethnic differences in thermal pain responses. Psychosom Med. 1999;61: 346–354. [DOI] [PubMed] [Google Scholar]
- 62.Chapman W, Jones C. Variations in cutaneous and visceral pain sensitivity in normal subjects. J Clin Invest. 1994;23:81–91. [DOI] [PMC free article] [PubMed] [Google Scholar]
- 63.Chiechi LM, Ferreri R, Granieri M, Bianco G, Berardesca C, Loizzi P. Climacteric syndrome and bodyweight. Clin Exp Obstet Gynecol. 1997;24:163–166. [PubMed] [Google Scholar]
- 64.Vincent A, Fitzpatrick LA. Soy isoflavones: are they useful in menopause? Mayo Clin Proc. 2000;75: 1174–1184. [DOI] [PubMed] [Google Scholar]
- 65.Zava DT, Duwe G. Estrogenic and antiproliferative properties and other flavonoids in human breast cancer cells in vivo. Nutr Cancer. 1997;27:31–40. [DOI] [PubMed] [Google Scholar]
- 66.Adlercreutz H, Mazur W. Phtyo-oestrogens and Western diseases. Ann Med. 1997;29:95–120. [DOI] [PubMed] [Google Scholar]
- 67.Knight DC, Eden JA. A review of the clinical effects of phytoestrogens. Obstet Gynecol. 1996;87: 897–904. [PubMed] [Google Scholar]
- 68.Quella SK, Loprinzi CL, Barton DL, et al. Evaluation of soy phytoestrogens for the treatment of hot flashes in breast cancer survivors: a North Central Cancer Treatment Group trial. J Clin Oncol. 2000;18: 1068–1074. [DOI] [PubMed] [Google Scholar]
- 69.St. Germain A, Peterson CT, Robinson JG, Alekel DL. Isoflavone-rich or isoflavone-poor soy protein does not reduce menopausal symptoms during 24 weeks of treatment. Menopause. 2001;8:17–26. [DOI] [PubMed] [Google Scholar]
- 70.Woods MN, Swine R, Kronenberg G. Effects of a dietary soy bar on menopausal symptoms. Am J Clin Nutr. 1999;68(suppl):1533S. [Google Scholar]
- 71.Burke GL, Legault C, Anthony M, et al. Soy protein and isoflavone effects on vasomotor symptoms in peri- and post-menopausal women: the Soy Estrogen Alternative Study. Menopause. 2003;10:147–153. [DOI] [PubMed] [Google Scholar]
- 72.Hammar M, Berg G, Lindgren R. Does physical exercise influence the frequency of postmenopausal hot flushes? Acta Obstet Gynecol Scand. 1990;69:409–412. [DOI] [PubMed] [Google Scholar]
- 73.Aiello EJ, Yswi Y, Tworoger SS, et al. Effect of a year-long moderate intensity exercise intervention on the occurrence and severity of menopause symptoms in postmenopausal women. Menopause. 2004;11: 382–388. [DOI] [PubMed] [Google Scholar]
- 74.Sternfeld B, Quesenberry CP Jr, Husson G. Habitual physical activity and menopausal symptoms: a case-control study. J Womens Health. 1999;8:115–123. [DOI] [PubMed] [Google Scholar]
- 75.Slaven L, Lee C. Mood and symptom reporting among middle-aged women: the relationship between menopausal status, hormone replacement therapy and exercise participation. Health Psychol. 1997;16: 203–208. [DOI] [PubMed] [Google Scholar]
- 76.Guthrie JR, Smith AMA, Dennerstein L, Morse C. Physical activity and the menopause experience: a cross-sectional study. Maturitas. 1995;20:71–80. [DOI] [PubMed] [Google Scholar]
- 77.Wilbur J, Dan A, Hedricks C, Holm K. The relationship among menopausal status, menopausal symptoms and physical activity in midlife women. Fam Community Health. 1990;13:67–78. [Google Scholar]