Abstract
The interaction between the GTPase-associated center (GAC) and the aminoacyl-tRNA·EF-Tu·GTP ternary complex is of crucial importance in the dynamic process of decoding and tRNA accommodation. The GAC includes protein L11 and helices 43–44 of 23S rRNA (referred to as L11–rRNA complex). In this study, a method of fitting based on a systematic comparison between cryo-electron microscopy (cryo-EM) density maps and structures obtained by molecular dynamics simulations has been developed. This method has led to the finding of atomic models of the GAC that fit the EM maps with much improved cross-correlation coefficients compared with the fitting of the X-ray structure. Two types of conformations of the L11–rRNA complex, produced by the simulations, match the cryo-EM maps representing the states either bound or unbound to the aa-tRNA·EF-Tu·GTP ternary complex. In the bound state, the N-terminal domain of L11 is extended from its position in the crystal structure, and the base of nucleotide A1067 in the 23S ribosomal RNA is flipped out. This position of the base allows the RNA to reach the elbow region of the aminoacyl-tRNA when the latter is bound in the A/T site. In the unbound state, the N-terminal domain of L11 is rotated only slightly, and A1067 of the RNA is flipped back into the less-solvent-exposed position, as in the crystal structure. By matching our experimental cryo-EM maps with much improved cross-correlation coefficients compared to the crystal structure, these two conformations prove to be strong candidates of the two functional states.
Keywords: base flipping, decoding, GTP-associated center, ribosome, tRNA
INTRODUCTION
During the process of decoding, the aminoacyl-tRNA (aa-tRNA) is brought to the ribosome as part of a complex with EF-Tu and GTP, the ternary complex. Two canonical sites of the tRNA are distinguished, A/T and A. In the former, the anticodon of aa-tRNA interacts with the decoding site while its CCA end is still retained with EF-Tu. In the latter, Watson–Crick base pairing has been established in a cognate codon–anticodon interaction, EF-Tu has been dissociated from the aa-tRNA and the ribosome, and the aa-tRNA has been fully accommodated, such that its CCA end is in contact with the peptidyl transferase center (PTC). In efforts to follow the dynamics of the process of decoding and tRNA accommodation into the A site, the technique of cryo-electron microscopy (cryo-EM) and single-particle reconstruction were employed (Stark et al. 2002; Valle et al. 2002, 2003a). In these experiments, functional ribosome complexes are trapped in defined states by the use of antibiotics or GTP nonhydrolyzable analogs, plunge-frozen, and imaged to obtain three-dimensional maps.
Specifically, in the A/T state, stabilized by kirromycin, the binding position of the ternary complex on the ribosome was inferred from a 9 Å cryo-EM density map (Valle et al. 2003a). Docking of X-ray structures into this map indicates that the D-loop of the aminoacyl-tRNA is located near the GTPase-associated center (GAC) formed, in major part, by 58 nt (helices 43 and 44 of 23S rRNA, including nucleotides 1051–1108 in Escherichia coli) and protein L11. This binding interaction is apparently of crucial importance in the decoding process (Valle et al. 2003a). In the present study, we have employed molecular dynamics (MD) simulations to explore conformations of the GAC that lead to plausible contacts with aa-tRNA in the region pinpointed by cryo-EM. The GAC is known to stimulate the GTPase activities of several factors that are of pivotal importance in initiation (IF2), decoding (EF-Tu), translocation (EF-G), and termination (RF3). Cryo-EM studies have established that the GAC forms direct contacts with all these factors except for EF-Tu (EF-G: Agrawal et al. 1999, 2000; Frank and Agrawal, 2000; Valle et al. 2003b; RF3: Klaholz et al. 2004; H. Gao, U. Rawat, A. Zavialov, R. Gursky, Z. Zhou, H. Song, M. Ehrenberg, and J. Frank, in prep.; IF2: Allen et al. 2005). It is likely that these binding contacts all involve components in the region similar to those with aa-tRNA, with a particular structural domain acting as an aa-tRNA mimic. Thus, the study of the dynamic behavior of the GAC, beyond providing information on contacts with aa-tRNA, has the potential to shed light on mechanisms in a broad range of functional interactions during translation.
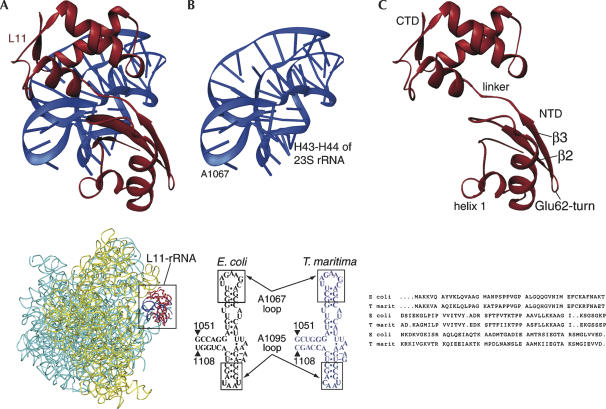
The crystal structure of the L11–rRNA complex shows that the protein L11 consists of N- and C-terminal domains (NTD and CTD) with a short linker between them (Fig. 1f; Conn et al. 1999; Wimberly et al. 1999). The compact CTD tightly binds to the rRNA, whereas the NTD is loosely folded and has been demonstrated to possess a higher degree of thermal motion than the CTD (Wimberly et al. 1999). The rRNA folds as a four-helical junction, consisting of two loops around the moderately conserved nucleotides A1067 and A1095. A cleft is formed between the NTD and the rest of the complex, which is thought to be a functionally important characteristic (Wimberly et al. 1999). Footprinting and other biochemical experiments demonstrated a direct interaction of A1067 with the antibiotics micrococcin and thiostrepton (Rosendahl and Douthwaite 1994), and a strong involvement of A1067 in the interaction with EF-G (Moazed et al. 1988). However, the details of this interaction are thus far unknown.
FIGURE 1.
Overview of the L11–rRNA complex. (A, top) Ribbon representation of the crystal structure of L11–rRNA complex (Wimberly et al. 1999; L11 is shown in red, and rRNA in dark blue). (Bottom) Thumbnail version of the 70S ribosome (Schuwirth et al. 2005; 23S and 5S: blue, and 16S: yellow), with L11–rRNA part boxed. (B, top) RNA part of the crystal structure. (Bottom) Comparison of rRNA (helices 43 and 44 of 23S rRNA) secondary structure from E. coli and T. maritima. (C, top) L11 part of the crystal structure. (Bottom) Aligned L11 sequences from E. coli and T. maritima.
In this study, we infer the atomic structures of the GAC in three states of the ribosome during the decoding process. These states are: (1) before the aa-tRNA·EF-Tu·GTP ternary complex is bound to the ribosome (initial factor-unbound state); (2) when the ternary complex is bound to the ribosome (factor-bound state); and (3) after release of the ternary complex from the ribosome upon accommodation of a cognate tRNA (factor-released state). (Since our study has revealed the importance of the factor binding as a determinant of the L11–rRNA conformation, we will henceforth use the factor binding state as designation.) The inferences were drawn on the basis of the best correlation between the MD structures and cryo-EM maps showing the trapped functional states.
Briefly, two types of conformations of the L11–rRNA complex, designated as MDI and MDII, emerged from the dynamics simulations. MDI matches the state bound with the ternary complex, while MDII matches the unbound states. In MDI, the structure of the complex is in an expanded conformation when the NTD is rotated around the linker with the CTD from the position in the crystal structure, and the base A1067 is flipped out and thus extensively exposed to solvent. MDII, in contrast, shows a moderate rotation of NTD and a flipped-in position of the base A1067, making it less exposed to solvent. The simulation trajectory clearly shows that within a time frame of 15 ns, two alterations between MDI and MDII are observed. Our study provides insights into how the L11–rRNA structure might bind to the aa-tRNA in the course of tRNA selection.
RESULTS
Dynamics of the L11–rRNA complex
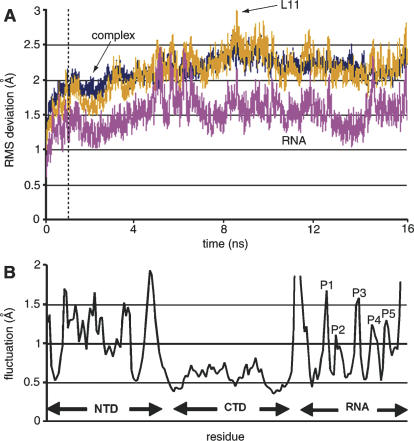
The dynamic behavior of the L11–rRNA complex was investigated by performing MD simulations that evolved the molecular system for 16 nsec, starting with X-ray structure. The MD simulation trajectory was used to analyze the dynamic features of the complex. The average RMS deviation of all snapshots, recorded at 2-psec intervals, in the trajectory relative to the crystal structure, was 2.1 Å for the total of 3939 atoms in the complex (Fig. 2A). This result implies that the global-scale structural organization of the L11–rRNA complex is retained during the simulation. However, the fluctuations are far from even among the residues. The Cα atoms in the NTD fluctuate significantly more compared with other components of the complex, indicating its large instability (Fig. 2B). In contrast, the CTD is relatively static. In the RNA, the fluctuations of the phosphate atoms are peaked at five positions: the first peak (1.7 Å) occurs at nucleotides A1067–G1068; the second peak (1.1 Å) occurs around A1073, which is at the ending position of the A1067 loop; the third peak (1.6 Å) is around nucleotides A1084–A1085, which are located at the center of the RNA junction; the fourth peak (1.2 Å) is at the A1095 loop; and the fifth peak (1.3 Å) is at C1100, which is located at the transition of the RNA junction.
FIGURE 2.
(A) RMSD relative to the crystal structure for L11–rRNA complex, ribosomal RNA, and L11. The dashed line separates the first nanosecond, in which equilibration occurs, from the last 15 nsec of the simulation. (B) Average fluctuations of Cα and phosphate atoms throughout the trajectory. Five peaks occur in the RNA, which are labeled from P1 to P5.
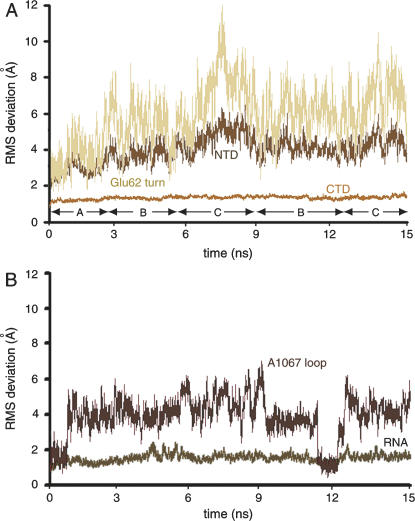
The CTD had an overall small average root mean square deviation (RMSD) (1.3 Å) relative to its conformation in the crystal structure (Fig. 3A). In contrast, the NTD exhibits a large RMSD, reaching 7 Å when the crystal structure of the two less-mobile portions, CTD and the rRNA, were used as a reference (Fig. 3A). The Glu62 turn, connecting strands β2 and β3 in L11 (nomenclature of Wimberly et al. 1999), displayed a movement highly correlated to that of the entire NTD. The rotation of the NTD and the displacement of Glu62 turn are maximized concurrently (Fig. 3A).
FIGURE 3.
RMSD of components of the L11–rRNA complex relative to the crystal structure (1MMS). (A) CTD and NTD of L11 and the Glu62 turn. (B) The rRNA and the A1067 loop. The snapshots are clustered into conformations A, B, and C.
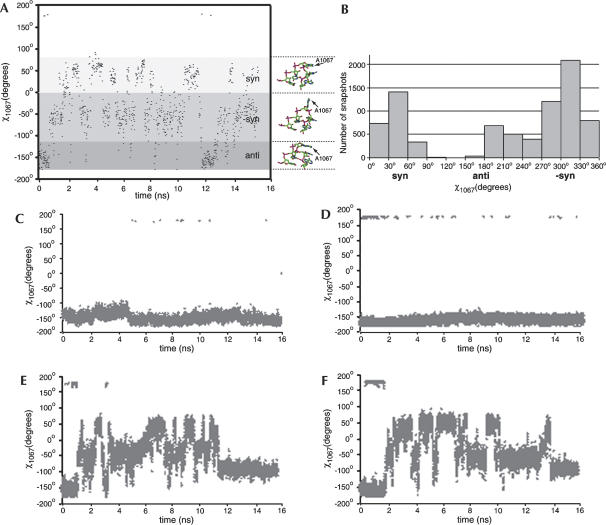
Overall, the rRNA closely follows the crystal structure (average RMSD of 1.5 Å relative to the crystal structure). However, the torsion angle χ (O4′-C1′-N9-C4) of A1067, describing the orientation of the base relative to the sugar, varies substantially. In the crystal structure, the base A1067 is in its anti conformation (−165°), the most favorable conformation for adenine, in which the base stacks with G1068. This conformation was reproduced in some snapshots; however, base A1067 mostly appeared in both the syn conformation in which, like in the anti conformation, the base is less exposed to solvent, and the −syn conformation (with a χ angle of about −50°), in which the base is extensively exposed to solvent (Fig. 4). The solvent-exposed −syn conformation is not an energetically favorable state, so that the base must be stabilized by interactions with its surroundings. It will be pointed out later on that the base is biased toward this orientation when the L11–rRNA complex is in the bound state. This dynamic behavior of A1067 can be compared with the following data: (1) a plot of the same torsion angle as the plot in Figure 4A, but for U1066, which is the immediate neighbor of A1067 (Fig. 4C). Instead of the fluctuations from syn to −syn, this angle stays close to −150° throughout the trajectory; (2) a plot of the torsion angle of A1054, another adenine but within a double helix (Fig. 4D); as for U1066, this angle stays in the vicinity of −150°, showing that the large fluctuation in the χ angle of A1067 is not a common feature of base A; (3) a plot of the χ angle of A1067 over the second MD simulation trajectory (Fig. 4E); and (4) a plot of the χ angle of A1067 over the third MD simulation trajectory (Fig. 4F). Over all three trajectories, the torsion angle is seen to alternate repeatedly from the syn to the −syn conformation.
FIGURE 4.
(A) Distribution of angles χ of A1067 along the first trajectory. (B) Histogram showing the distribution of angles χA1067 in all snapshots of the trajectory. (C) Distribution of angles χ of U1066. (D) Distribution of angles χ of A1054. (E,F) Distribution of angles χ of A1067 along the second and the third trajectories.
In order to show the major features in the conformations, the snapshots in the MD trajectory were subjected to clustering using Moil-View (Simmerling et al. 1995). In Moil-View, only the positions of Cα and P atoms are used to be compared with the reference. We used the X-ray structure as reference, with an RMSD cutoff of 1.5 Å for clustering.
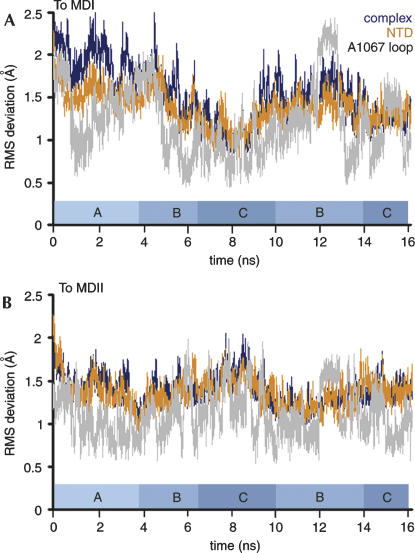
The clustered conformations correspond approximately to the following time frames (Fig. 5): (1) 0–3.8 nsec, representing a conformation (group A) in the initial phase, as the structure changes away from the crystal structure; particularly during the first nanosecond, the snapshots basically stay around the crystal structure; (2) 3.8–6.4 nsec, representing a conformation (group B) that is deviated further away from the crystal structure than group A; (3) 6.4–10 nsec, representing a conformation (group C) with extended rotation of the NTD and, therefore, the largest deviation from the crystal structure; (4) 10–16 nsec, a group separated from groups B and C. However, when a smaller cutoff of 1.35 Å was applied for a regrouping, these snapshots were separated at time frames of 10–14 nsec (close to group B) and 14–16 nsec (close to group C).
FIGURE 5.
Illustration of conformational transitions of the L11–rRNA complex. RMSD of the complex (dark blue) and the NTD (orange) relative to the average structure of MDI (A) and MDII (B). The transitions go from the crystal structure to MDII, to MDI, then to MDII, and finally back to MDI. When the structures are close to MDI, they are distant from MDII, and vice versa.
Thus, groups B and C stand for two major types of conformations. Several structurally similar snapshots with the largest and smallest RMSDs in both groups C and B were averaged, respectively, resulting in two structures we termed MDI and MDII. A plot of the RMSD of the trajectory with MDI and MDII as references (Fig. 5) clearly shows that the conformations are grouped.
The characteristic structures MDI and MDII were also used as references to analyze the conformational changes in the individual structural elements, such as the NTD and the A1067 loop (Fig. 5). The results show that the conformational differences between the groups are primarily caused by the large instability of the NTD. The snapshots represented by group B deviate only moderately from the crystal structure, with an average deviation of about 4 Å for the NTD. The conformation represented by group C is the one most different from the crystal structure, with an average deviation of about 5 Å for the NTD. In essence, the transitions between the alternative local structures of NTD and alternative orientations of the A1067 loop constitute the dynamics of the L11–rRNA complex.
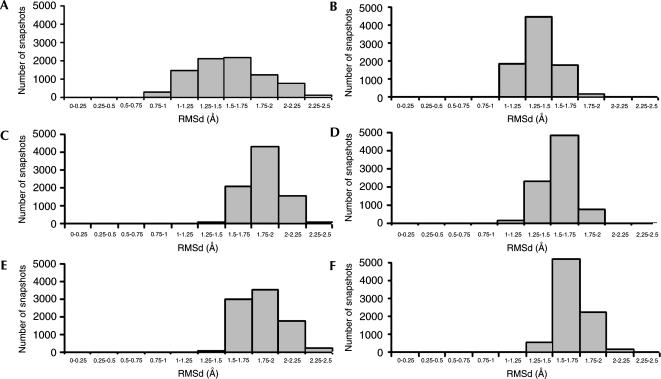
The grouping of conformations is evident from a plot of the RMSD between the snapshots and the two reference conformations over three MD simulation trajectories (Figs. 6A–F). The histograms show three groups of the populations: The first group (10%–30%) has smaller RMSD against MDI (Fig. 6C,E) and MDII (Fig. 6B,D,F). The central peak (30%–50%) corresponds to the conformational transitions between MDI and MDII. The last group (10%–30%) includes the snapshots that are further away from the references, either MDI (Fig. 6C,E) or MDII (Fig. 6B,D,F). The RMSD group shown in Figure 6A has a wider distribution than in all other cases, but overall the trajectories show the grouped conformations.
FIGURE 6.
Histograms displaying distribution of RMSDs of snapshots against reference structures MDI and MDII, respectively. (A) First trajectory relative to MDI. (B) First trajectory relative to MDII. (C,D) Same histograms as in A and B, respectively, but from the second trajectory. (E,F) Same histograms as in A and B, respectively, but from the third trajectory.
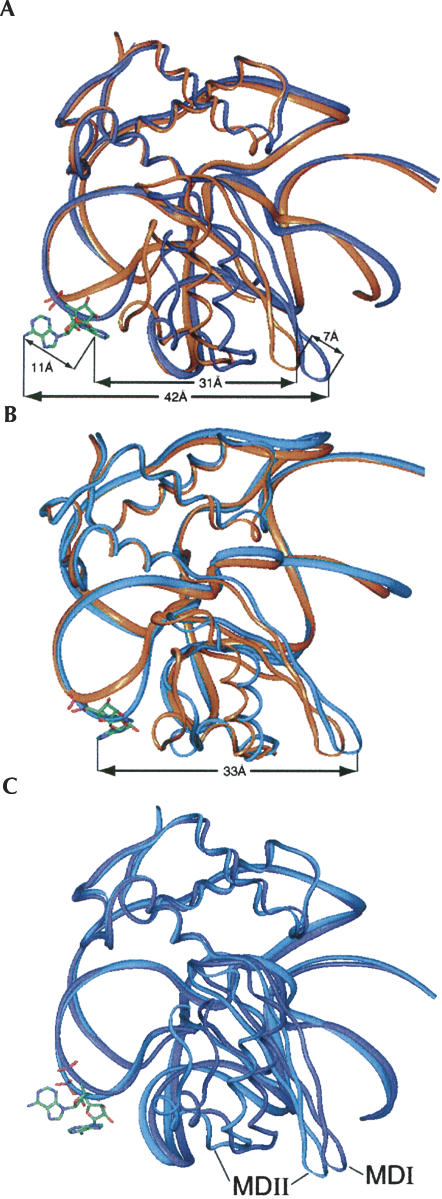
The important differences between the conformations of groups B and C are illustrated (Fig. 7). In the extended conformation, the NTD is clearly rotated around the linker with the CTD, which results in an extension of the Glu62 turn. The cleft provides the necessary separation that allows the domain to rotate. It was inferred from our previous fitting of the crystal structure of L11 into the 70S ribosome (unbound state) that, upon rotation of the NTD, the Glu62 turn stretches from its position in the crystal structure (Agrawal et al. 2001). With the present MD simulation result, we now find that throughout the trajectory, the Cα atom of Glu62 moves by a maximum of 12 Å. MDI has an increased separation of 42 Å from the atom A1067:N6 to the Cα atom of Glu62, compared with 31 Å in the crystal structure. The atom A1067:N6 moves by 11 Å in the extended conformation from its position in the crystal structure, and the atom Glu62:Cα by 7 Å. In contrast, this A1067:N6–Glu62:Cα distance is only increased to 33 Å in MDII, where the NTD is rotated only moderately. In MDI, the base A1067 is biased toward the extensively solvent-exposed position, while it is in a less-exposed position in MDII.
FIGURE 7.
Two types of dynamic structures of the L11–rRNA complex generated by molecular dynamics simulations. (A) MDI (blue), superimposed on the crystal structure (orange). (B) MDII (blue), superimposed on the crystal structure (orange). (C) MDI and MDII superimposed on each other.
MDI represents the factor-bound state of the L11–rRNA complex
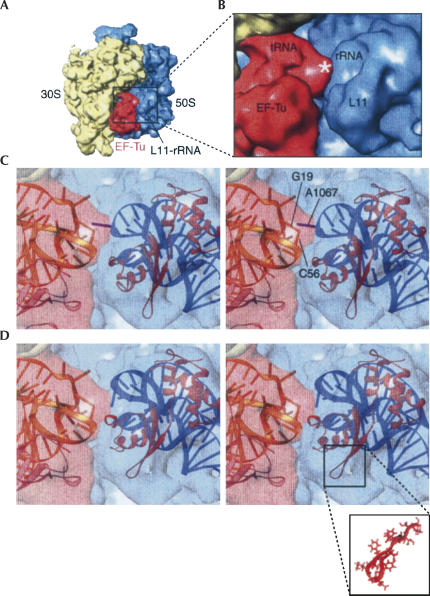
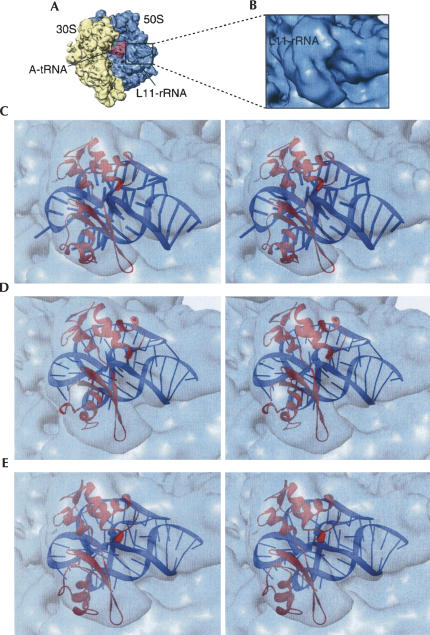
The functional meanings of the two types of MD conformations were identified by correlative analysis with cryo-EM density maps. The first examination concerned the degree of consistency of either MDI or MDII with the cryo-EM map of the 70S ribosome bound with the ternary complex Phe-tRNAPhe·EF-Tu·GDP in the presence of the antibiotic kirromycin (Fig. 8A,B; Valle et al. 2003a). The presence of kirromycin effectively prevents dissociation of EF-Tu from the ribosome after GTP hydrolysis on EF-Tu. Therefore Phe-tRNAPhe remains at the A/T site. This high-resolution (9 Å) cryo-EM map allowed the segmentation of the density due to the ternary complex from those due to the 70S ribosome. Accordingly, the anticodon stem–loop (ASL) of aa-tRNA is positioned in the decoding center, and its elbow region contacts the L11–rRNA complex. The resolution was not sufficient to reveal the details of the intermolecular contact at the atomic level, and a previous fitting of the crystal structure of the L11–rRNA complex into the map failed to explain this connection in atomic terms (Valle et al. 2003a). However, there is unexplained excess density in this region of the map, which was attributed to the tRNA part of the ternary complex (see asterisk in Fig. 8B).
FIGURE 8.
Close-up view of the interacting site between A1067 and the D-loop of the tRNA. (A) Cryo-EM map of the 70S ribosome (30S: yellow, 50S: blue) bound with the EF-Tu·aa-tRNA·GDP·kirromycin ternary complex (red). The binding region is indicated by a box. (B) Enlarged view of the cryo-EM map in the binding region. The asterisk indicates a density region previously unexplained. (C) Stereo-view showing the fitting of MDI into the map. In this conformation, A1067 has a close contact with the D-loop of the aa-tRNA. (D) Stereo-view showing MDII fitted into the cryo-EM map. In C and D, the cryo-EM map is rendered semitransparent for a better view of the fitting positions. The atomic structure of the Glu62-loop is detailed in the lower panel.
Using a motif search procedure (Rath et al. 2003), both MDI and MDII were docked into the cryo-EM map. This procedure placed the L11–rRNA complex in either conformation at the base of the L7/L12 stalk (Fig. 8C,D). Along with the MD structures, a portion of the crystal structure for the Phe-tRNAPhe·EF-Tu·GDP (Song et al. 1999; PDB code: 1B23) was also docked, excluding the ASL of aa-tRNA and domain I of EF-Tu because their orientations differ from those assumed in the cryo-EM map of the ternary complex bound to the ribosome (Valle et al. 2003a).
Docking of MDI into the map results in a much improved cross-correlation coefficient compared with the results of docking the crystal structure: 0.83 versus 0.73. Unlike previous fitting using the rigid crystal structure, the extended NTD in MDI fills the density map without leaving any unmatched space. Docking of MDI and the portions of the crystal complex of EF-Tu·aa-tRNA results in a direct contact between A1067 and base G19 in the D loop of the aa-tRNA (Fig. 8C). In addition, the nucleotide at position 56 of the aa-tRNA is placed in very close vicinity of the binding site between A1067 and G19 of the aa-tRNA, making it seem likely that C56 is also involved in direct binding with A1067. This fitting result thus explains the continuous density in this region linking the two components (Fig. 8). In this docked structure, the center of fragment Gly25–Leu28 around helix 1 of L11 is about 10 Å away from the TψC loop of aa-tRNA, and >15 Å away from G19. Based on this geometry, helix 1 is unlikely to be the site for binding with aa-tRNA, even though this helix is shown to be dynamically active (Wimberly et al. 1999).
In contrast, docking of MDII generates a slightly lower cross-correlation coefficient (0.8). This, to some degree, fits better than the crystal structure due to the adjusted position of the NTD, but it results in a density gap of about 10 Å between A1067 in the L11–rRNA complex and the elbow region of the aa-tRNA, and a mismatched density in the region of the Glu62 turn (Fig. 8D). Thus, even though the decrease in the cross-correlation is small, the visible mismatch in two important regions must be taken into consideration as well in discounting MDII. In particular, the fitting of MDII cannot explain the interaction between the two molecules that was observed from the cryo-EM study (Valle et al. 2003a).
MDII represents the factor-unbound states of the L11–rRNA complex
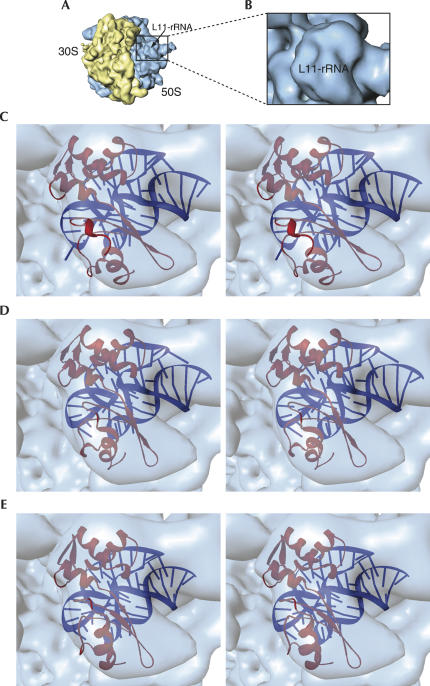
In the decoding process, the factor-bound state is bracketed by two factor-unbound states. Prior to the binding, one unbound state (the initial factor-unbound state) is the initiation-like complex with a vacant A site, as described by Valle and coworkers (2003a), in which the L11–rRNA complex is positioned away from the main body of the 50S subunit. The other unbound state (factor-released) appears after the GTP hydrolysis on EF-Tu, release of EF-Tu from the ribosome, and accommodation of the aa-tRNA in the A site followed immediately by the peptidyl transfer reaction (Fig. 9). Our cryo-EM map representing this state bears an initiator fMet-tRNAfMet in the P site and a cognate Phe-tRNAPhe in the A site (Valle et al. 2003a). In this state (Fig. 9A,B), the L11–rRNA complex is positioned similarly (i.e., away from the main loop) as in the initial factor-unbound state (Fig. 10). Valle and coworkers (2003a) termed the position of the GAC shown in Figure 9A and Figure 10 “open,” as compared to the position that appeared in the factor-bound state, designated as “closed” (Fig. 8). These observations implied that the entire GAC is repositioned on a global scale upon binding and release of the ternary complex. This global-scale motion of the L11–rRNA complex relative to the rest of the ribosome from the open to the closed position is outside the scope of the current study. Instead, our current study focused on the local-scale dynamic behavior of the L11–rRNA complex per se (see more details in Discussion). We proceeded to examine whether the global change in binding condition would affect the local structure of the L11–rRNA complex, as well. To this end, we tried out the three atomic structures (MDI, MDII, and the crystal structure) for best fit.
FIGURE 9.
Conformation of the L11–rRNA complex in the factor-released state. (A) Cryo-EM map of the 70S ribosome (30S: yellow, 50S: blue) in the factor-released state with tRNA in the A site (pale pink). The boxed region includes the GAC. (B) Enlarged view of the boxed GAC in A. (C) Stereo-view of MDI fitted into the cryo-EM map. (D) Stereo-view of MDII fitted into the map. (E) Stereo-view of fitting of the crystal structure of the L11–rRNA complex fitted into the same cryo-EM map as shown in C and D. In C, D, and E, the cryo-EM maps are rendered semitransparent for a better view of the fitting positions.
FIGURE 10.
Conformation of the L11–rRNA complex in the initial factor-unbound state. (A) Cryo-EM map of the 70S ribosome (30S: yellow, 50S: blue) in the initial factor-unbound state. The boxed region includes the GAC. (B) Enlarged view of the boxed GAC in A. (C) Stereo-view of MDI fitted into the cryo-EM map. (D) Stereo-view of MDII fitted into the map. (E) Stereo-view of the crystal structure of the L11–rRNA complex fitted into the same cryo-EM map as shown in C and D. In C, D, and E, the cryo-EM maps are rendered semitransparent in order to visualize the fitting positions.
Docking of MDI into maps for the unbound states improved the cross-correlation coefficients when compared with the crystal structure: 0.79 versus 0.72 (for initial unbound state), and 0.75 versus 0.69 (factor-released state). But much better fitting yet was obtained for MDII, by which the cross-correlation coefficients were improved to 0.86 versus 0.72 and 0.80 versus 0.69 for the two unbound states, respectively. This improvement is the result of both the rotation of NTD and the extension in the Glu62 turn. On the other hand, an obvious discrepancy arises when attempting to fit a rotated NTD of the crystal structure, without the extension of the Glu62 turn (Agrawal et al. 2001), since this extension is an important feature in the functional states.
In summary, the fittings of MDII into the maps depicting unbound states are superior compared with the fitting of MDI. MDII matches both the factor-released state (Fig. 9) and the initial unbound state (Fig. 10). In contrast to the factor-bound state, MDI fails to represent the unbound states, and this failure is mainly due to the overextended position of both the Glu62 turn and A1067 loop compared with the map where they expand out of the map (Fig. 9).
Thus, these fittings convincingly demonstrate that MDII most closely represents the states of the ribosome before binding with the EF-Tu·aa-tRNA complex and after release of EF-Tu.
DISCUSSION
Correlative analysis of cryo-EM and MD
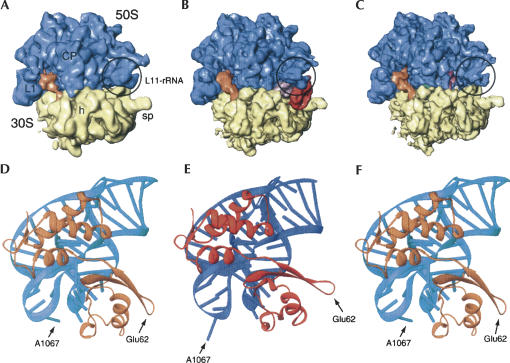
The correlative analysis of MD simulation and cryo-EM provides a useful tool to identify those structures, among the structures generated along an MD simulation trajectory, that best represent a functional state trapped by cryo-EM. We summarize these results in Table 1 and Figure 11. As shown by the cryo-EM maps of the 70S ribosome, the position of the L11–rRNA complex depends on the aa-tRNA·EF-Tu·GTP binding condition, but the functional mechanism in the various states can be understood only when the atomic details are revealed explicitly. However, this level of detail has not been reached in cryo-EM maps of the ribosome.
TABLE 1.
The cross-correlation coefficients obtained by fitting MDI, MDII, and the crystal structure into cryo-EM maps at the initial factor-unbound state, the factor-bound state, and the factor-released state
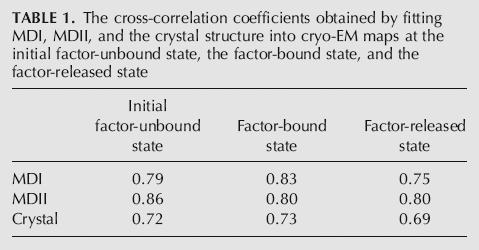
FIGURE 11.
Summary of the three successive ribosomal states and their corresponding MD structures. Cryo-EM maps of the 70S ribosome (30S: yellow, 50S: blue) in initial factor-unbound state (A), factor-bound state (B), and factor-released state (C). (D) MDII is the atomic structure best fitting the initial factor-unbound state shown in A. (E) MDI is the atomic structure best fitting the factor-bound state shown in B. (F) MDII is the atomic structure best fitting the factor-released state shown in C. Landmarks of the 50S subunit: (L1) protein L1; (CP) central protuberance. Landmarks of the 30S subunit: (h) head; (sp) spur.
Because of the difficulties presented by X-ray crystallography of fully functional ribosome complexes, the most substantial progress in characterizing various steps of the elongation cycle has been made by cryo-EM and manual or computer-assisted docking of coordinates of ligand structures obtained by X-ray crystallography (e.g., Valle et al. 2003a,b). The limitation of this approach lies in the fact that it fails to provide specific information on the location and dynamic behavior of atomic interactions.
The current study demonstrates that correlative analysis of cryo-EM and MD simulations are able to provide this kind of information. The existence of alternative MD conformations matching experimental density maps of functional states suggests that these conformations may represent the states of the factor binding and release. The increased power in computer performance makes it possible to generate a relatively long dynamic trajectory that provides varying conformations evolving over time, provided that the component is of reasonable size. Still, an important question to be asked is if the dynamic snapshots from the simulation over a time period of nanoseconds are representative of a relatively long MD run that matches the experimentally suggested time scale of a complete structural transition or binding reaction. In the present study, the fact that structures match with the experimental density maps suggests that, at the very least, the simulation has provided some strong candidates for the functionally relevant conformations. In principle, this correlative approach could also be used to identify transiently formed conformations of binding partners that result in binding opportunities between juxtaposed nucleotides/residues. This knowledge could be used in designing experiments for trapping those conformations, for the purpose of cryo-EM visualization.
Binding mechanism of the L11–rRNA complex with ribosomal factors
Starting with the initial factor-unbound state, decoding advances when aminoacyl-tRNA in complex with EF-Tu and GTP is delivered to the ribosome, forming the factor-bound state, and the decoding process ends with the factor-released state in which the aa-tRNA is accommodated in the A site and EF-Tu has dissociated. We know from previous cryo-EM observations that during this process, the GAC undergoes global-scale movements from the “open” to the “closed” position, and then reverses to the “open” position. This movement can be traced to the instability of Kt-42, a kink-turn located in helix 42 (Klein et al. 2001; Razga et al. 2005). This behavior might be observed in a simulation that includes a larger scope of the ribosomal substructures than the L11–rRNA complex in the present study; at the very least, helix 42 of the 23S rRNA should be included with its unstable element Kt-42. However, a recent X-ray study (Schuwirth et al. 2005) indicates that in attempting to simulate the GAC global motions, the limiting tertiary contacts with other ribosomal domains must be considered as well. Such a study including the larger context would require a much greater computational cost. Instead, therefore, we have confined our present study to the local dynamics within the GAC itself. Our MD simulations show that the GAC undergoes internal conformational changes concomitantly with the global movements, namely from MDII to MDI, then back to MDII (Table 1; Fig. 11).
During the incorporation of the aa-tRNA into the 70S ribosome, a conformational change in the aa-tRNA facilitates its interaction with the mRNA in the decoding center and its accommodation into the ribosomal A site. A model has been developed to explain mechanistically how aa-tRNA is delivered to, selected by, and accommodated into the ribosome (Valle et al. 2003a). This model suggested that the decoding process is accompanied by two crucially important conformational changes, one affecting the position of the GAC in the ribosomal 50S subunit and the other the relative position between the aa-tRNA and EF-Tu. These changes are coupled through the contact between the aa-tRNA and the GAC. Valle and coworkers (2003a) observed that nucleotide A1067 in the GAC is located near the elbow region of the aa-tRNA, although the fitting of the crystal structure into cryo-EM map did not conclusively yield the geometry of a direct bond. However, this contact becomes unambiguous when the crystal structure in the GAC is replaced by MDI (Fig. 8D). The crystal structure of the aa-tRNA·EF-Tu·GTP complex (PDB code: 1B23) shows that bases G19 and C56 in the elbow region of aa-tRNA neither form a Watson–Crick base pair nor stack with other bases. Quite likely, the outward position of this non-Watson–Crick base pair leads to intermolecular interactions. This feature has been demonstrated by a recent biochemical study on the role of tRNA (Leu) tertiary structure in the aminoacylation and editing reactions catalyzed by leucyl-tRNA synthethase, suggesting that the elbow region of tRNA affects the binding between tRNA and aminoacyl-tRNA synthetase during both aminoacylation and editing (Du and Wang 2003). Thus, in molecular complexes involving tRNA, the elbow region apparently has an active role in the intermolecular binding.
An earlier studied by Uchiumi and Kominami (1994) indicated that nucleotide 1067 is an adenine in virtually all bacterial, archaeal, and chloroplast rRNAs, but conserved (95%) as a guanine in eukaryotes. However, since the sizes of the two bases are comparable, this substitution would not affect the postulated mechanism of interaction with the D-loop of tRNA.
An important feature of this binding circumstance is that the GAC and the aa-tRNA are connected when the size of the L11–rRNA complex is extended and when A1067 reaches out toward the GAC. The contact by one major nucleotide represents a moderate strength for the connection. This moderate binding strength may be required to facilitate the transitions between sequential functional states before and after the binding. In analogy, orientations of universally conserved base G530 of 16S rRNA are sensitively tied to various functional states (PDB code: 1N32; Ogle et al. 2002). As seen in the crystal structures, the base of G530 exists in either anti or syn conformation, depending on the position of codon and anticodon mismatch (PDB codes: 1N32, 1N34, and 1N36; Ogle et al. 2002). When the bases of the codon–anticodon pair match at the first position, base G530 appears in the anti conformation, where it interacts with A1492, which forms an overall stable environment for each of the components in the vicinity. When they mismatch at the first position, G530 is present in the syn conformation (a self-energy unfavorable form), and its contact with A1492 is broken (Ogle et al. 2001). Both anti and syn conformations were in fact observed in MD simulations on helix 18 of 16S rRNA (W. Li, unpubl. data).
The current study leads to a further elaboration of our previously proposed model of the decoding dynamics (Valle et al. 2003a). First, in the association phase, the binding between the GAC (A1067) and the tRNA (G19 and C56) is imperative for placing the EF-Tu ternary complex into the correct binding position, allowing codon–anticodon recognition to occur, although the recognition may only need a transient stabilization. Second, in the dissociation phase of EF-Tu, assuming the ASL to be recognized and the aa-tRNA to be cognate, structural flexibility of the aa-tRNA would allow overall conformational adjustment. Triggered by anticodon–codon recognition, changes in the D loop would break its contact with the GAC and disrupt the interaction between the CCA stem and EF-Tu (Valle et al. 2003a). This disruption subsequently triggers the GTP hydrolysis on EF-Tu and release of EF-Tu from the ribosome. With a noncognate aa-tRNA, the EF-Tu ternary complex preferentially dissociates without hydrolyzing GTP. In both cases, the moderate nature of the contact between the aa-tRNA and the GAC permits a rapid dissociation of aa-tRNA.
Both the association and dissociation of the factor reflect the essential dynamics of the L11–rRNA complex. When associated with the extension of the complex, base A1067 is stabilized either in the flipped-out position, as the binding partner comes in its vicinity, or in the flipped-in position, where the base is less exposed to solvent and where its stability is less dependent on the binding partner. The structural flexibility of the L11–rRNA complex might present an efficient means of sampling the neighborhood, in order to make contact with the elbow region of an approaching aa-tRNA. Once that contact is made, the equilibration among the changing conformations is biased toward MDI. Biochemical experiments already suggested that the rRNA in the GAC constantly undergoes conformational changes that are induced by the mobility of the NTD of L11 (Cundliffe 1987). Prior to the current study, the crystal structures represented the only data on the atomic details of the GAC in one state only. The lack of dynamic information led to various suggestions of the binding model when the complex reacts to the binding of antibiotics and ribosomal factors (Cundliffe 1987; Wimberly et al. 1999). The MD simulation information along with the cryo-EM results now allows us to establish a model that readily explains the binding and release of the aa-tRNA.
Our study should be placed in the context of a recent attempt to simulate the decoding process, which included all atoms of the entire ribosome and focused on the accommodation of tRNA from the A/T site to the A site (Sanbonmatsu et al. 2005). The results, obtained with a target MD simulation, showed that A1067 consecutively interacts with tRNA bases 55, 54, 53, 52, and 51 during the accommodation, so the authors named A1067 a monitor for the tRNA movement. In the final stage of the accommodation, the elbow region of the tRNA does no longer interact with A1067. These results demonstrate the importance of the involvement of A1067 in the accommodation at the early stage of accommodation, in agreement with our current analysis. However, this study offered no discussion about the conformational changes within the GAC observed during the simulated time interval.
This brings up a related question: to what extent the MD simulation of an isolated component may portray the dynamic features displayed by that component when placed into its full context. In principle, a comparison of our results with those derived from a full-atom study of the ribosome would be illuminating, but the only existing study, by Sanbonmatsu et al. (2005) mentioned before, used targeted MD and may not result in a trajectory that is characteristic for the actual behavior of the system formed by tRNA and GAC. However, in answer to the question, we can assume, as a rule of thumb, that fast motions on the time scale observed for the Glu62 loop and NTD are determined by the local structural context, whereas slow motions on the microsecond and millisecond time scale require the global context of a domain to be considered.
It should finally be noted that the same region of the GAC also binds with several other ribosomal factors (EF-G, IF2, and RF3) transiently, and that these factors all possess domains in a similar position, acting as structural mimics of the D-loop of the tRNA. Therefore, the functional conformations of the GAC observed may occur in other factor-binding related states as well.
MATERIALS AND METHODS
Molecular dynamics simulations
The MD simulations were performed using the Sander module in the molecular simulation software package AMBER7 (University of California, San Francisco) and the Cornell force field (Cornell et al. 1995). The particle-mesh-Ewald method was used for the treatment of the electrostatic interaction energies (Petersen 1995). The X-ray atomic coordinates of the L11–rRNA complex from Thermotoga maritima were obtained from the Brookhaven Protein Data Bank (PDB code: 1MMS; Wimberly et al. 1999). This crystal structure includes 133 amino acids of L11 and 58 nt of the RNA fragment, and this complex was used as the starting structure for the simulation. Very recently, an X-ray structure of the 70S E. coli ribosome in two conformations was published that put the L11–rRNA component into the context of the entire ribosome. We compared one of the conformations (PDB code: 2AW4) with the X-ray structure we used for the simulation (PDB code: 1MMS) and found that they closely match in their backbones. Although there were several other X-ray structures of the L11–rRNA complex available at the time we performed the simulations, the one we used had the best resolution.
Net charges on the L11–rRNA complex were neutralized by adding sodium ions around the complex. In addition, ionic conditions of ∼0.1 M NaCl (36 Na+/36 Cl−) were used for the simulations. The system was placed in a water box with a water shell that was at least 10 Å away from the solute to the outer edge of the shell, using the TIP3P water model (Jorgensen et al. 1983). The water box had a size of 86 × 84 × 80 Å3 and contained 14,218 water molecules.
The system was subjected to an energy minimization using the steepest descent minimization algorithm with 200 steps, followed by 50 psec of dynamics to heat the system from 100°K to 300°K with a 20 kcal/mol/Å2 constraint on the L11–rRNA complex. This procedure was then followed by 50 psec of equilibration with the same constraint on the solute. Next, the system was energy-minimized with gradually decreasing constraints on the L11–rRNA complex starting from 20 kcal/mol/Å2, 15 kcal/mol/Å2, then 10 kcal/mol/Å2, 5 kcal/mol/Å2, 1 kcal/mol/Å2, and finally no constraints with 200 steps for each minimization. Then a reduced water box size was used to replace the initial size, and the previous heating dynamics simulation was repeated. The size of the water box was reduced to 82 × 81 × 77 Å3 after the preparation steps. After the constraint was released, three independent production runs were performed, using changed velocity distributions (random seeds), lasting 16 nsec for each. The constant-pressure condition was used. SHAKE (van Gunsteren and Berendsen 1977) was applied to the bonds involving hydrogen atoms. The time-step was 2 fsec and the cutoff distance for nonbonded interactions was 9 Å. AMBER7/CARNAL and Moil-View (Simmerling et al. 1995) were used for the trajectory analysis. Figures were based on the results derived from one of the trajectories since all trajectories exhibited similar conformational changes.
Docking of dynamic structures into cryo-EM maps
Docking was performed using a rapid motif search procedure (Rath et al. 2003), based on Roseman's (2003) fast local cross-correlation algorithm and implemented in SPIDER (Frank et al. 1996). MDI and MDII for the L11–rRNA complex from T. maritima and portions of the crystal structure of EF-Tu·tRNA complex from Thermus thermophilus were docked into cryo-EM maps of the three E. coli 70S ribosome complexes (Valle et al. 2003a): (1) a 12.5 Å map of an initiation-like complex with fMet-tRNAf Met at the P site (initial factor-unbound state); (2) a 9 Å map of the ribosome bound to the EF-Tu·aa-tRNA·GDP·kirromycin complex (factor-bound state); and (3) a 9 Å map of the ribosome with aa-tRNA accommodated in the A site (factor-released state). The atomic structures were converted into SPIDER density maps having a pixel size of 2.82 Å. The maps for the L11–rRNA complex were windowed to a size of 79 × 79 × 79 Å3. Coarse searches to determine the matching locations of the windowed volume within the 70S ribosomal maps were performed with rotations of the windowed volume using an interval of 10°, covering the entire angular range in three dimensions. In a range of ±10° around the Euler angles determined by the coarse search, the complex was then subjected to an exhaustive search using an angular interval of 1°. The graphic visualizations were done with the programs IRIS Explorer (The Numerical Algorithms Group Ltd.), Ribbons (Carson 1997), and INSIGHT II (Accelrys Inc.). The MD-I and MD-II models have been deposited to the PDB.
ACKNOWLEDGMENTS
We thank the National Cancer Institute and the Advanced Biological Computer Center in the NCI for support with their supercomputer resources. We also thank Drs. Charles Brooks and Hugo Martinez for helpful comments and suggestions, Ardean Leith and Brian Cuttler for assistance with installation of software, and Michael Watters for assistance with the illustrations. This work was supported by the Howard Hughes Medical Institute and grants from NIH (R37 GM29169 and R01 GM55440 to J.F.).
Footnotes
Article published online ahead of print. Article and publication date are at http://www.rnajournal.org/cgi/doi/10.1261/rna.2294806.
REFERENCES
- Agrawal R.K., Heagle A.B., Penczek P., Grassucci R.A., Frank J. EF-G-dependent GTP hydrolysis induces translocation accompanied by large conformational changes in the 70S ribosome. Nat. Struct. Biol. 1999;6:643–647. doi: 10.1038/10695. [DOI] [PubMed] [Google Scholar]
- Agrawal R.K., Spahn C.M., Penczek P., Grassucci R.A., Nierhaus K.H., Frank J. Visualization of tRNA movements on the Escherichia coli 70S ribosome during the elongation cycle. J. Cell Biol. 2000;150:447–460. doi: 10.1083/jcb.150.3.447. [DOI] [PMC free article] [PubMed] [Google Scholar]
- Agrawal R.K., Linder J., Sengupta J., Nierhaus K.H., Frank J. Localization of L11 protein on the ribosome and elucidation of its involvement in EF-G-dependent translocation. J. Mol. Biol. 2001;311:777–787. doi: 10.1006/jmbi.2001.4907. [DOI] [PubMed] [Google Scholar]
- Allen G.S., Zavialov A., Gursky R., Ehrenberg M., Frank J. The solution structure of a translation initiation complex from Escherichia coli at 13.8 Å. Cell. 2005;121:703–712. doi: 10.1016/j.cell.2005.03.023. [DOI] [PubMed] [Google Scholar]
- Carson M. Ribbons. Acta Crystallogr. B. 1997;277:493–505. [PubMed] [Google Scholar]
- Conn G.L., Draper D.E., Lattman E.E., Gittis A.G. Crystal structure of a conserved ribosomal protein–RNA complex. Science. 1999;284:1171–1174. doi: 10.1126/science.284.5417.1171. [DOI] [PubMed] [Google Scholar]
- Cornell W.D., Cieplak P., Bayly C.L., Gould I.R., Merz K.M., Ferguson D.M., Spellmeyer D.C., Fox T., Caldwell J.W., Kollman P.A. A second generation force field for the simulation of proteins and nucleic acids. J. Am. Chem. Soc. 1995;177:5179–5197. [Google Scholar]
- Cundliffe E. On the nature of antibiotic binding sites in ribosomes. Biochimie. 1987;69:863–869. doi: 10.1016/0300-9084(87)90213-6. [DOI] [PubMed] [Google Scholar]
- Du X., Wang E.D. Tertiary structure base pairs between D- and TpsiC-loops of E. coli tRNA play important roles in both aminoacylation and editing. Nucleic Acids Res. 2003;31:2865–2872. doi: 10.1093/nar/gkg382. [DOI] [PMC free article] [PubMed] [Google Scholar]
- Frank J., Agrawal R.K. A ratchet-like inter-subunit reorganization of the ribosome during translocation. Nature. 2000;406:318–322. doi: 10.1038/35018597. [DOI] [PubMed] [Google Scholar]
- Frank J., Radermacher M., Penczek P., Zhu J., Li Y., Ladjadj M., Leith A. SPIDER and WEB: Processing and visualization of images in 3D electron microscopy and related fields. J. Struct. Biol. 1996;116:190–199. doi: 10.1006/jsbi.1996.0030. [DOI] [PubMed] [Google Scholar]
- Jorgensen W.L., Chandreskhar J., Madura J.D., Imprey R.W., Klein M.L. Comparison of simple potential functions for simulating liquid water. J. Chem. Phys. 1983;79:926–935. [Google Scholar]
- Klaholz B.P., Myasnikov A.G., Van Heel M. Visualization of release factor 3 on the ribosome during termination of protein synthesis. Nature. 2004;427:862–865. doi: 10.1038/nature02332. [DOI] [PubMed] [Google Scholar]
- Klein D.J., Schmeing T.M., Moore P.B., Steitz T.A. The kink-turn: A new RNA secondary structure motif. EMBO J. 2001;15:4214–4221. doi: 10.1093/emboj/20.15.4214. [DOI] [PMC free article] [PubMed] [Google Scholar]
- Moazed D., Robertson J.M., Noller H.F. Interaction of elongation factors EF-G and EF-Tu with a conserved loop in 23S RNA. Nature. 1988;334:362–364. doi: 10.1038/334362a0. [DOI] [PubMed] [Google Scholar]
- Ogle J.M., Brodersen D.E., Clemons W.M., Jr., Tarry J.J., Carter A.P., Ramakrishnan V. Recognition of cognate transfer RNA by the 30S ribosomal subunit. Science. 2001;292:897–902. doi: 10.1126/science.1060612. [DOI] [PubMed] [Google Scholar]
- Ogle J.M., Murphy IV F.V., Tarry M.J., Ramakrishnan V. Selection of tRNA by the ribosome requires a transition from an open to a closed form. Cell. 2002;111:721–732. doi: 10.1016/s0092-8674(02)01086-3. [DOI] [PubMed] [Google Scholar]
- Petersen H.G. Accuracy and efficiency of the particle mesh Ewald method. J. Chem. Phys. 1995;103:3668–3679. [Google Scholar]
- Rath B.K., Hegerl R., Leith A., Shaikh T.R., Wagenknecht T., Frank J. Fast 3D motif search of EM density maps using a locally normalized cross-correlation function. J. Struct. Biol. 2003;144:95–103. doi: 10.1016/j.jsb.2003.09.029. [DOI] [PubMed] [Google Scholar]
- Razga F., Koca J., Sponer J., Leontis N.B. Hinge-like motions in RNA kink-turns: The role of the second a-minor motif and nominally unpaired bases. Biophys. J. 2005;88:3466–3485. doi: 10.1529/biophysj.104.054916. [DOI] [PMC free article] [PubMed] [Google Scholar]
- Roseman A. Particle finding in electron micrographs using a fast local correlation algorithm. Ultramicroscopy. 2003;94:225–236. doi: 10.1016/s0304-3991(02)00333-9. [DOI] [PubMed] [Google Scholar]
- Rosendahl G., Douthwaite S. The antibiotics micrococcin and thiostrepton interact directly with 23S rRNA nucleotides 1067A and 1095A. Nucleic Acids Res. 1994;22:357–363. doi: 10.1093/nar/22.3.357. [DOI] [PMC free article] [PubMed] [Google Scholar]
- Sanbonmatsu K.Y., Joseph S., Tung C.S. Simulating movement of tRNA into the ribosome during decoding. Proc. Natl. Acad. Sci. 2005;102:15854–15859. doi: 10.1073/pnas.0503456102. [DOI] [PMC free article] [PubMed] [Google Scholar]
- Schuwirth B.S., Borovinskaya M.A., Hau C.W., Zhang W., Vila-Sanjurjo A., Holton J.M., Cate J.H. Structures of the bacterial ribosome at 3.5 Å resolution. Science. 2005;310:827–834. doi: 10.1126/science.1117230. [DOI] [PubMed] [Google Scholar]
- Simmerling C., Elber R., Zhang J. Moil-View—A program for visualization of structure and dynamics of biomolecules and STO—A program for computing stochastic paths, in modeling of molecular structure and mechanisms. In: Pullman A., et al., editors. Modelling of biomolecular structure and mechanisms. Kluwer; Amsterdam: 1995. pp. 241–265. [Google Scholar]
- Song H., Parsons M.R., Rowsell S., Leonard G., Phillips S.E. Crystal structure of intact elongation factor EF-Tu from Escherichia coli in GDP conformation at 2.05 Å resolution. J. Mol. Biol. 1999;285:1245–1256. doi: 10.1006/jmbi.1998.2387. [DOI] [PubMed] [Google Scholar]
- Stark H., Rodnina M.V., Wieden H.J., Zemlin F., Wintermeyer W., van Heel M. Ribosome interactions of aminoacyl-tRNA and elongation factor Tu in the codon-recognition complex. Nat. Struct. Biol. 2002;9:849–854. doi: 10.1038/nsb859. [DOI] [PubMed] [Google Scholar]
- Uchiumi T., Kominami R. A functional site of the GTPase-associated center within 28S ribosomal RNA probed with an anti-RNA autoantibody. EMBO J. 1994;13:3389–3394. doi: 10.1002/j.1460-2075.1994.tb06641.x. [DOI] [PMC free article] [PubMed] [Google Scholar]
- Valle M., Sengupta J., Swami N.K., Grassucci R.A., Burkhardt N., Nierhaus K.H., Agrawal R.K., Frank J. Cryo-EM reveals an active role for aminoacyl-tRNA in the accommodation process. EMBO J. 2002;21:3557–3567. doi: 10.1093/emboj/cdf326. [DOI] [PMC free article] [PubMed] [Google Scholar]
- Valle M., Zavialov A., Li W., Stagg S.M., Sengupta J., Nielsen R.C., Nissen P., Harvey S.C., Ehrenberg M., Frank J. Incorporation of aminoacyl-tRNA into the ribosome as seen by cryo-electron microscopy. Nat. Struct. Biol. 2003a;10:899–906. doi: 10.1038/nsb1003. [DOI] [PubMed] [Google Scholar]
- Valle M., Zavialov A., Sengupta J., Rawat U., Ehrenberg M., Frank J. Locking and unlocking of ribosomal motions. Cell. 2003b;114:123–134. doi: 10.1016/s0092-8674(03)00476-8. [DOI] [PubMed] [Google Scholar]
- van Gunsteren W.F., Berendsen H.J.C. Algorithms for macromolecular dynamics and constraint dynamics. Mol. Phys. 1977;34:1311–1327. [Google Scholar]
- Wimberly B.T., Guymon R., McCutcheon J.P., White S.W., Ramakrishnan V. A detailed view of a ribosomal active site: The structure of the L11–RNA complex. Cell. 1999;97:491–502. doi: 10.1016/s0092-8674(00)80759-x. [DOI] [PubMed] [Google Scholar]


