

Abstract
Background
Previous studies of the relationship between perfusion, diffusion, and stroke suggest that the extent of cerebral hypoperfusion may be a better indicator of neurological status than lesion size in the early phases of recovery. It is not clear how these factors are related to aphasia severity.
Aims
The purpose of this study was to investigate the relationship between cerebral perfusion, diffusion, and aphasia severity in stroke.
Methods & Procedure
Nine participants were examined within 24 hours of stroke onset and six were re-examined at 1 month post stroke. The examination included administration of an aphasia test, a face recognition task, and a neuroimaging session including T2-, perfusion-, and diffusion-weighted MRI.
Outcomes & Results
Participants with a variety of aphasia types and severity were included in the study. Visual inspection suggested larger perfusion abnormality than the actual lesion in eight of nine subjects at day 1. The correlation between aphasia severity and hypoperfusion was significant at day 1 and at 1 month post stroke. However, this was not the case for the relationship between aphasia severity and lesion size where the correlation was not statistically significant at day 1 or at 1 month post stroke.
Conclusions
These results suggest that cerebral hypoperfusion is a more accurate indicator of aphasia severity in early stroke than lesion volume.
Acute aphasia following stroke is a dynamic condition whose course is difficult to predict. Several factors are probably influential in recovery from aphasia, but a strong predictor model has not been conceptualised. One of these factors may pertain to changes in cerebral haemodynamics. That is, brain perfusion changes following stroke may play a role in the extent and timing of aphasia recovery. Although many studies have explored the relationship between cerebral perfusion, diffusion, and global neurological deficits (Barber et al., 1998; Beaulieu et al., 1999; Chalela et al., 2000; Neumann-Haefelin, Moseley, & Albers, 2000; Tong et al., 1998), less is known about how these changes may affect the course of recovery in aphasia.
Cerebral perfusion refers to microcirculation of blood in the brain and is believed to be an indicator of exchange of nutrients between capillaries and neurons. Severe decrease in cerebral perfusion—for example in stroke—ultimately leads to cell death in areas irrigated by the affected blood vessels. However, decreased perfusion (hypoperfusion) may result in cessation of neural firing without cell death in areas surrounding the actual lesion. Depending on perfusion dynamics, neurons in these areas may ultimately die, remain hypoperfused, or regain normal neuronal function (Baird & Warach, 1998). Using either positron emission tomography (PET) or perfusion weighted magnetic resonance imaging (PWI) it is possible to assess perfusion in the brain. In the case of stroke, with the onset of tissue injury, random flow of water (diffusion) in the lesion is slowed down by a factor of two compared to the rest of the brain. Diffusion weighted magnetic resonance imaging (DWI) makes use of this principle and can reveal brain lesions within minutes following stroke onset (Barber et al., 1998). By combining PWI and DWI it is possible to assess the extent of cortical tissue that is not yet dead but not functional due to hypoperfusion.
Using PET, Metter et al. (1990) found that hypoperfusion in the angular gyrus and the temporal cortex correlated significantly with the language performance of aphasic persons. They suggested that the extent of hypoperfusion was a better indication of language impairment than lesion size. In a similar study, Metter, Jackson, Kempler, and Hanson (1992) found that increases in brain metabolism correlated with improvement in comprehension scores on the Western Aphasia Battery (WAB, Kertesz, 1982) within 1year post stroke. The initial scan for all of the patients studied by Metter et al. was performed at least 1 month post stroke.
An MRI study of aphasia severity and neglect by Hillis, Barker, Beauchamp, Gordon, and Wityk (2000) suggested that decreased performance on single-word processing tasks was associated with hypoperfusion and lesion size in acute stroke patients. They found that lexical performance had a stronger correlation with hypoperfusion volumes than lesion volumes seen on DWI in patients with a left hemisphere stroke. This study differed from Metter et al. (1990) in that these investigators used PWI and DWI to assess hypoperfusion and lesion size. Also, instead of using a global measure of aphasia such as the WAB, Hillis et al. assessed aphasia severity using single-word processing tasks. It is probable that a test of overall language function may better reflect aphasia severity than tasks employing only single words.
The purpose of this study was to investigate the association between aphasia severity, hypoperfusion, and lesion size within 24 hours of stroke onset and at 1 month post stroke. If there is a significant correlation between these factors then it is possible that early aphasia recovery may be predicted by changes in perfusion/diffusion.
METHOD
Participants
Nine patients were recruited for study participation at the University of Arizona Medical Center (UMC) (Table 1). Participants received behavioural testing and MRI examination within 24 hours after estimated symptom onset.
TABLE 1.
Demographic data
| Participants | Gender | Age | Ethnic background |
|---|---|---|---|
| RI | Man | 79 | Caucasian |
| EJ | Woman | 74 | Caucasian |
| CJ | Woman | 77 | Hispanic |
| EF | Man | 77 | Caucasian |
| MG | Woman | 70 | Native American |
| ES | Woman | 70 | Caucasian |
| LN | Woman | 76 | Caucasian |
| JT | Woman | 70 | Caucasian |
| PH | Woman | 78 | Caucasian |
All participants had symptoms consistent with a left middle cerebral artery (MCA) ischaemic stroke and were medically capable of MRI scanning at the time it was performed. One participant (RI) received treatment with tPA within 3 hours of symptom onset.
Seven of the nine participants were women. The mean age was 74.6 years with a standard deviation of 3.7 and a range of 70 to 79 years. All spoke English as their primary language. Patients with a history of moderate to severe dementia or seizure disorder were excluded from the study.
Prospective participants were recruited by attending neurologists. Participants either signed consent forms prior to inclusion in the study or, when applicable, informed consent was given by legal representatives. Patients who qualified for the study underwent behavioural testing, and an MRI examination that included PWI, DWI, and T2-MRI scans. Behavioural testing was conducted within plus or minus 3 hours of the MRI session. At 30 days post stroke, seven participants came back to UMC for re-examination.
Behavioural testing
The Bedside Evaluation Screening Test (2nd edn) (BEST-2; West, Sands, & Ross-Swain, 1998) served as the formal language assessment tool. The BEST-2 takes about 15–20 minutes to administer and was designed to assess language problems of patients in acute care who may not be ready for the rigour of a longer aphasia battery. There are seven subtests on the BEST-2 focusing on: (1) Conversational Expression; (2) Naming Objects; (3) Describing Objects; (4) Repeating Sentences; (5) Pointing to Objects; (6) Pointing to Parts of a Picture; and (7) Reading. Raw scores can be converted to percentile ranks and standard scores and the sum of standard scores is used to rate participants’ aphasia severity (> 91 = No Impairment; 91–77 = Mild; 76–63 = Moderate; < 63 = Severe).
Depending on stroke severity it is possible that patients’ aphasia test performance in acute care may be compromised due to decreased arousal rather than language impairment. To address this issue, all participants were administered a test that is thought to tax the non-dominant hemisphere. The Florida Affect Battery (FAB; Bowers, Blonder, & Heilman, 1991) facial discrimination subtest (FAB-1) was used for this purpose. The FAB-1 involves viewing 20 black-and-white photographs of unfamiliar faces presented two per page in a vertical array and determining for each pair whether the faces are the same or different. The resultant differential diagnosis of aphasia was based on comparison of performances on the BEST-2 and the FAB-1. That is, participants with aphasia would be expected to score relatively higher on the FAB-1 than on the BEST-2.
Participants who were evaluated again at 1 month post stroke were administered the BEST-2 and FAB-1. In addition, the 15-item short form of the Boston Naming Test (2nd. Edn) (BNT; Kaplan, Goodglass, & Weintraub, 2001) was added to the assessment battery to assess naming impairment more fully.
Neuroimaging
At day 1, all participants received PWI and DWI. PWI was used to assess cerebral perfusion, and DWI for lesion size analyses. The neuroimaging session at 30 days post stroke included PWI, but T2-weighted MRI was used for lesion volume analyses instead of DWI. Because of changes in lesion diffusion in the days and weeks following stroke, T2-weighted MRI is thought to be better for lesion assessment in the chronic stages of stroke.
All MRI examinations were carried out on a General Electric 1.5 Tesla Signa echospeed scanner. PWI was carried out using an arterial spin labelling (ASL) method, FAIR (Flow-sensitive Alternating Inversion Recovery; Kwong et al., 1995), with a spiral data collection. ASL does not require an injection of contrast bolus but rather relies on comparison of images taken with and without the inversion of water in the arterial blood supplying the brain (for a detailed review see Thomas, Lythgoe, Pell, Calamante, & Ordidge, 2000). Five slices covering a 4.3 cm thick slab were imaged in the PWI exam with the following parameters: Field of view (FOV) = 30 cm × 30 cm; effective matrix size = 128 × 128 pixels; TR = 10.000; and TE = 20; and time between inversion and image acquisition, TI = 1,400 ms. Perfusion images were calculated by pairwise subtraction of 50 labelled and 50 control images (Kwong et al., 1995) analysed in grey scale on a Sun Microsystems computer.
Because of spatial limitations of PWI it is not an optimal technique for volume analysis. Because hypoperfusion may be present in the lowest slice it is not possible to determine how far below this slice hypoperfusion may extend. Therefore, to quantify perfusion, a ratio of left hemisphere PWI pixels to whole brain PWI pixels was calculated (left/whole hemisphere perfusion ratio) for each of the five PWI slices. Thus, the right hemisphere was used as a reference for participant’s cerebral perfusion. In the case of a large perfusion deficit in the hemisphere that incurred the ischaemic event, a lower ratio would be expected than in cases in which there is only very limited or no hypoperfusion. Consequently, severity of hypoperfusion is determined by the lack of MR signal in the hemisphere of interest.
To compare the perfusion ratios found in this study to that found in normal brains, three normal participants were scanned with the perfusion MRI. The perfusion ratios for these three participants were .5013, .5091, and .5003 indicating that cerebral perfusion in both hemispheres of non-brain-damaged subjects is similar.
For DWI, 22 slices were collected using Single-Shot Echo Planar Imaging (SSEPI). Slice thickness was set at 5 mm without gaps. As with the PWI images, the field of view was set at 30 cm × 30 cm with a grid of 128 × 128 pixels. The remaining parameters were set as follows: TR = 10,000 ms and TE eff = 96 ms; and b = 1000 s/mm2. Lesion volume analyses were performed, again using Khoros software on a Sun Microsystems computer. DWI images were visually inspected for evidence of brain lesions. After manual outlining of a lesion, its mean voxel value and standard deviation was calculated. The image was then high-pass filtered at two standard deviations below the mean voxel value for the lesion to obtain the number of pixels within the lesion. The number of lesion voxels was then multiplied by the voxel dimensions to obtain lesion volume. A reference image was used to ensure that over- or under-filtering did not take place.
All participants also underwent T2-weighted MRI with the following parameters: Slice thickness = 5 mm (1.5 mm gap between slices); TR = 90 ms; and TE = 24 ms; FOV = 22 cm × 16 cm and 256 × 192 acquisition matrix. Volume analyses were performed in the same way as on DWI except that low pass filtering was also used to remove signal from cerebral spinal fluid.
Data analysis
Spearman rank correlation coefficients were calculated for correlations between standard scores from the BEST-2, BNT scores, perfusion ratios, and lesion volumes seen on DWI and T2-MRI. This non-parametric test was used because of the small sample size. Alpha level was set at .01. Because most participants scored within normal limits on the FAB-1, point-biserial correlations were calculated between raw scores and other variables. That is, performance on the FAB-1 was scored as being below or within normal limits compared to the published FAB norms.
RESULTS
Day 1
Standard scores from the BEST-2 ranged from 36 (severe) to 76 (mild) (Table 2). The mean score was 63 with a standard deviation of 14.21 (Table 2). A range of aphasia types was noted. All participants performed above chance level on the FAB-1. In fact, most participants made only one or two errors. The mean score was 19 and the range was 13–20. Three participants responded correctly to all 20 items and three made only one mistake.
TABLE 2.
Performance on aphasia tests and aphasia types at day 1 and day 30
|
Day 1 |
Day 30 |
Day 30 |
Day 1 |
Day 30 |
||
|---|---|---|---|---|---|---|
| Participants | Aphasia type | Aphasia type | BNT | BEST-2 | BEST-2 | BEST-2 change |
| EF | Wernicke’s | Died | 36* | Died | ||
| CJ | Global | Broca’s | 4† | 45 | 63 | 18 |
| MG | Broca’s | Declined reassessment | 56 | Declined reassessment | ||
| RI | Anomic | Anomic | 11 | 65 | 82 | 17 |
| EJ | Conduction | Conduction | 12 | 67 | 84 | 17 |
| JT | Conduction | WNL | 13 | 69 | 91 | 22 |
| PH | Trans. Mot. | WNL | 14 | 74 | 93 | 19 |
| LN | Anomic | WNL | 10 | 76 | 93 | 17 |
| ES | Conduction | Conduction | 6 | 76 | 65 | −11 |
Maximum score possible is 100.
Maximum score possible is 15.
Perfusion deficits were visually obvious in the left hemisphere of all participants. Hypoperfusion ranged from involving only the immediate lesion (Figure 1) to affecting most of the left hemisphere (Figure 2). Visual inspection of the PWI scans suggested right hemisphere hypoperfusion deficit in four participants. Quantitative data analyses were also performed on the PWI data (Table 3). The mean for the left/whole hemisphere perfusion ration was .4309 (SD = .0642) with a range of .33 to .50. Lesion size seen on DWI was not a significant predictor of left/whole hemisphere perfusion ratio [left/whole perfusion ratio = .45 − (lesion size on DWI) .0004, F = 1.62, p = .244]. This was not surprising as visual inspection suggested that a small lesion seen on DWI was not always associated with a small area of hypoperfusion.
Figure 1.
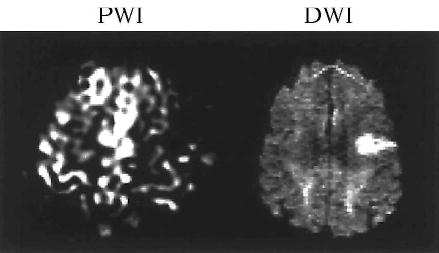
Hypoperfusion only involves the immediate lesion (Participant: PH).
Figure 2.
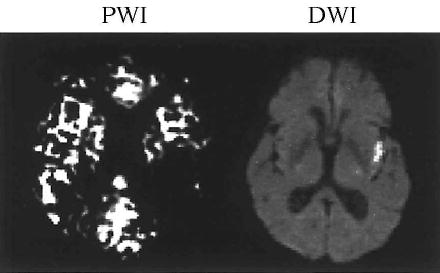
Hypoperfusion extends beyond the actual lesions (Participant: LN).
TABLE 3.
Perfusion ratios and lesion volumes at day 1 and day 30
|
Day 1 |
Day 30 |
Day 1 |
Day 30 |
|||
|---|---|---|---|---|---|---|
| Participants | Perfusion ratio | Perfusion ratio | Change in ratio | Lesion size | Lesion size | Change in lesion size |
| EF | .34 | Died | 201 cm3 | Died | ||
| CJ | .33 | .40 | .15 | 4 cm3 | 124 cm3 | +120 cm3 |
| MG | .39 | Declined reassessment | 25 cm3 | Declined reassessment | ||
| RI | .42 | .48 | .06 | 123 cm3 | 92 cm3 | −31 cm3 |
| EJ | .49 | Declined reassessment | 3 cm3 | Declined reassessment | ||
| JT | .47 | .49 | .02 | 0 cm3 | 0 cm3 | 0 cm3 |
| PH | .46 | .51 | .05 | 52 cm3 | 55 cm3 | +3 cm3 |
| LN | .45 | .44 | −.01 | 22 cm3 | 53 cm3 | +31 cm3 |
| ES | .50 | .46 | −.04 | 43 cm3 | 395 cm3 | +352 cm3 |
The Spearman correlation coefficient was statistically significant between BEST-2 scores and left/whole brain perfusion ratio, r(9) = .80, p = .005 (Table 4). Consequently, hypoperfusion, as measured in the present study, appears to correlate with aphasia severity within 24 hours of symptom onset. Participants with lower perfusion ratios tended to have more severe aphasia than those with higher perfusion ratios.
TABLE 4.
Correlation matrix for assessment immediately post stroke
| FAB | .14†
.35 |
||
| Lesion size | −.218
.287 |
−.32†
.20 |
|
| Perfusion ratio | .803**
.005 |
.32†
.20 |
−.317
.203 |
| BEST-2 | FAB | Lesion size |
Correlation is significant at the .05 level (1-tailed).
Correlation is significant at the .01 level (1-tailed).
Point–biserial correlation.
The correlation between BEST-2 scores and lesion size measured on DWI did not reach statistical significance, r(9) = −.22, p = .287. There did not seem to be a clear relationship between lesion size and aphasia severity. That is, participants with larger lesions did not appear to have more severe aphasia than those who had smaller lesions.
The point-biserial correlation between FAB-1 scores and left/whole brain perfusion was not significant, r(9) = .32, p = .20. Nor was the correlation between FAB-1 scores and lesion volume seen on DWI. Neither of these correlation coefficients exceeded those for the relationship between BEST-2 scores and lesion data, suggesting that, for these participants, language function was more affected by stroke than face discrimination ability. It is also important to note that most participants had a perfect or near perfect score on the FAB-1. This was not the case for participants’ performance on the BEST-2, providing justification for differential diagnosis of aphasia rather than some more general cognitive impairment.
Day 30
Seven of nine participants were tested with the BEST-2, FAB-1, and BNT at 1 month post stroke. One participant declined reassessment and one died following a second massive stroke involving the cerebellum and brainstem 3 weeks after inclusion in the study. The mean score on the BEST-2 on re-examination was 82 with a standard deviation of 13 and a range of 63–93 (Table 2.). Six of these seven participants obtained higher scores compared to the initial assessment. Three scored within normal limits, one had mild anomia, one had Broca’s aphasia, and one had conduction aphasia. One participant (ES) did not improve nor did her aphasia evolve to another type. She also demonstrated increased phonemic paraphasias in naming and running speech. The mean improvement on the BEST-2 was 14.42 (SD = 11.23). A Wilcoxon signed-rank test revealed a statistically significant difference between day 1 and day 30 using an alpha level of .05 (n = 7, T = 2.213, p < .027), indicating substantial recovery from aphasia.
In contrast to performance on the BEST-2, at 1 month post onset no participant correctly named all items on the Boston Naming Test (BNT). The mean score on the BNT was 10 with a standard deviation of 3.7 and a range of 4–14 (out of 15 possible).
The mean score on the FAB-1 on re-examination was 18.14 with a standard deviation of 2.03 and a range of 14–20. Two participants responded correctly to all 20 items and four made only one or two mistakes. The difference between FAB-1 scores immediately after stroke and at 1 month post stroke was not statistically significant (n = 7, T = .92, p < .36), largely because of the ceiling effect obtained in acute care.
Six of the seven participants who were evaluated at 1 month post stroke received an MRI that included PWI and T2-MRI. Visual inspection suggests that, compared to day 1, cerebral perfusion had increased for five participants. For example, CJ’s left hemisphere appeared to have increased cerebral perfusion as well as a decrease in aphasia severity (Figure 3). ES, however, appeared to have decreased global perfusion at 1 month post stroke that was accompanied by the previously mentioned marked increase in aphasia severity (Figure 4). The mean left/whole perfusion ratio at 1 month post stroke was .46 with a SD of .038 (Table 3). The range was .40 to .51. The difference between left/whole brain perfusion ratios immediately post stroke and at 1 month post stroke was not statistically significant (n = 6, T = .943, p < .35). Four of six participants’ perfusion ratio did improve at 1 month post stroke. That is, compared to right hemisphere perfusion, left hemisphere perfusion had increased. Based on results from these participants, left hemisphere perfusion would be expected to improve in the month following stroke, even in the absence of tPA administration. This improvement in perfusion is likely (at least in part) the result of improved collateral blood flow and/or spontaneous recanalisation of an occluded artery or arterioles.
Figure 3.
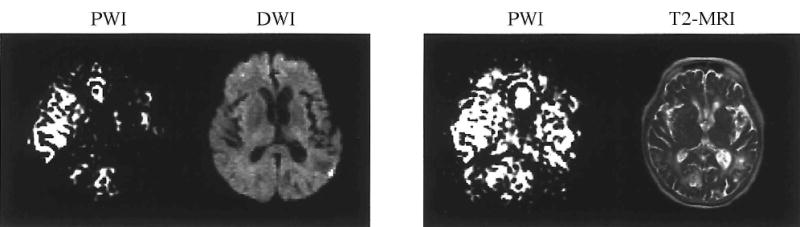
PWI and DWI at day 1 and PWI and T2-MRI at day 30 for CJ.
Figure 4.
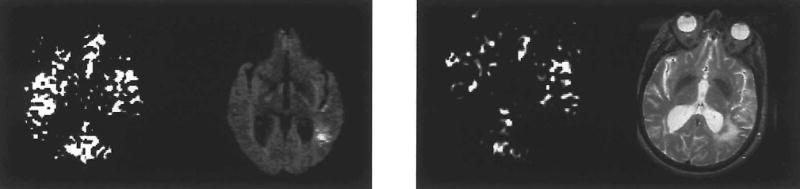
PWI and DWI at day 1 and PWI and T2-MRI at day 30 for ES.
Hyperintensity was visually apparent on T2-MRI scans of five participants at reexamination. The difference in lesion size immediately post stroke and at 1 month post stroke was not statistically significant (n = 6, T = 1.36, p < .18).
The correlation between BEST-2 scores and left/whole brain perfusion was not statistically significant, r(6) = .49, p = .16 (Table 5). However, inspection of perfusion images suggests that brains of participants with the lowest BEST-2 scores were significantly hypoperfused at 1 month post stroke. On the other hand, the participants who scored within normal limits on the BEST-2 had perfusion ratios that were compatible to what is seen in normal subjects. As in the acute stage, lower left hemisphere perfusion at 1 month post stroke was more likely to be associated with more severe cases of aphasia.
TABLE 5.
Correlation matrix for assessment at 1 month post stroke
| FAB | .878**†
.005 |
|||
| BNT | .721*
.034 |
.23†
.31 |
||
| Perfusion ratio | .493
.160 |
.42†
.18 |
.886**
.009 |
|
| Lesion size | −.754*
.042 |
−.46†
.15 |
−.657
.078 |
−.257
.311 |
| BEST-2 | FAB | BNT | Perfusion ratio |
Correlation is significant at the .05 level (1-tailed).
Correlation is significant at the .01 level (1-tailed).
Point–biserial correlation.
The correlation between BEST-2 scores and measured lesion size on T2-MRI did not reach statistical significance, r(6) = −.75, p = .042, for an alpha level of .01. However, participants with larger lesions were more likely to have more severe aphasia than participants who scored within normal limits on the BEST-2 at 1 month post stroke. There was a strong correlation, r(6) = .89, p = .009, between BNT scores and left/whole brain perfusion. Because no participant achieved a perfect score on the BNT, this measure probably reflects aphasia severity more accurately at 1 month post stroke than BEST-2 scores. These results support previous findings that low perfusion ratios are associated with more severe aphasia than when perfusion in the left hemisphere is similar to right hemisphere perfusion. The correlation between lesion size and BNT scores was not statistically significant, r(6) = −.66, p = .078. However, this relationship approached statistical significance and is similar to that found for the relationship between lesion size and BEST-2 scores at 1 month post onset. That is, participants in this study who had large lesions were more likely to have more severe aphasia than were participants whose lesions were smaller 1 month post stroke.
The point-biserial correlation between FAB-1 scores and left/whole perfusion was not statistically significant, r(5) = .42, p = .18. As was the case at day 1, the correlation between FAB-1 scores and hypoperfusion (.27) was lower than the correlation between BEST-2 scores and hypoperfusion (.49). This was also the case for the relationship between FAB-1 scores and lesion size seen on T2-MRI, r(6) = −.46, p = .15. The correlation between BEST-2 scores and lesion size was −.74. Because most participants scored high on both the BEST-2 and FAB-1, it is difficult to decipher the importance of these results. At least, it is clear that participants improved on both the BEST-2 and the FAB-1, but that the improvement was much greater on the BEST-2.
DISCUSSION
A statistically significant correlation between aphasia severity and hypoperfusion in acute stroke suggests that left hemisphere perfusion is related to aphasia severity. Visual inspection of PWI scans suggested that participants with the lowest BEST-2 scores in the acute stage clearly had more limited left hemisphere perfusion than participants with milder aphasia. For example, CJ and EF both had severe aphasia as well as the lowest left/whole brain perfusion ratios of the study group. Conversely, higher ratios were associated with higher scores on the BEST-2. This is similar to previous studies showing that decreased performance on single-word processing tasks correlates both with the volume of cerebral hypoperfusion (Hillis et al., 2000) and the severity of hypoperfusion within Wernicke’s area (Hillis et al., 2001), measured with contrast bolus tracking perfusion MRI in acute stroke patients. Also, these results agree with Cappa et al. (1997) who used positron emission tomography (PET) to investigate eight stroke participants with mild aphasia. They found lower metabolism in the left hemisphere at 2 weeks and 6 months following stroke to correlate with aphasia severity. Using PET with six aphasic participants, Heiss et al. (1997) found decreased metabolic rate in the left hemisphere to be related to both aphasia severity and recovery. These two latter studies differ from the present work in that neither of them studied participants with acute stroke.
The present findings also concur with studies of hypoperfusion and global neurological impairment (Barber et al., 1998; Beaulieu et al., 1999; Chalela et al., 2000; Lev et al., 2001; Neumann-Haefelin et al., 2000; Tong et al., 1998). These studies used repeated scans and behavioural assessment of stroke patients within the first month of onset—usually starting in acute care. Although none of these studies specifically focused on aphasia, they all suggest that decreased cerebral perfusion in the infarcted hemisphere is associated with increased neurological impairment. For example, using ASL-PWI, Chalela et al. (2000) found a strong correlation (Spearman; p = .007) between left/right MCA perfusion difference and neurological impairment measured on the NIHSS in 15 acute stroke patients. Similar to the present study, participants who had the greatest difference in left and right hemisphere perfusion had poorer neurological status overall than participants with smaller hemisphere differences.
In contrast to the relationship between hypoperfusion and aphasia severity, there did not appear to be a clear association between lesion size and aphasia severity in the participants studied here. Lesion size seen on DWI varied greatly between the participants. Small lesions were not necessarily associated with higher scores on the BEST-2. PH, for example, had a considerably larger lesion (52 cm3) than CJ (4 cm3) but her stroke resulted in aphasia that was not nearly as severe as CJ’s. The correlation between lesion size and hypoperfusion was not statistically significant which suggests that larger lesions were not always associated with low left/right perfusion ratios and increased aphasia severity—”what you see” (on DWI) is NOT necessarily “what you get” (in aphasia severity).
Several studies have suggested that the extent of lesion size seen on CT or MRI is a predictor of aphasia severity (Kertesz, Harlock, & Coates, 1979; Mazzoni et al., 1992, Pedersen, Jorgensen, Nakayama, Raaschou, & Olsen, 1995). There could be several reasons why the present results do not agree with these studies.
Because of technical limitations, previous studies were not able to show the extent of hypoperfusion in stroke—something that was possible in the present study. Indeed, the most likely explanation for the low correlation between aphasia severity and lesion size in the present study has to do with the presence of cerebral hypoperfusion. Given the high correlation between aphasia severity and hypoperfusion, it is probable that lesion size seen on DWI does not represent the extent of tissue that is functional in the acute stage of stroke. None of the studies mentioned earlier looked at acute stroke, perhaps because T2-MRI and CT scans are not optimal techniques for lesion volume analyses in acute stroke. That is, using these techniques the ischaemic lesion is often not observed until several days after the onset of stroke. PWI and DWI overcome this limitation. The earliest time-point for examination was at 1 month post stroke by Mazzoni et al. (1992). Based on findings by Beaulieu et al. (1999), significant hypoperfusion beyond the actual lesion is not common in chronic patients. Consequently, it is possible that hypoperfusion, rather than lesion size, is the determining factor in aphasia severity in acute stroke, although either lesion or hypoperfusion volume are equally correlated with aphasia severity in chronic stroke, as the volume of lesion and volume of hypoperfusion are usually similar in the chronic stage. That is, “what you see” (on PWI) is “what you get” (in aphasia severity). Another source for discrepancy between the present results (which found no significant correlation between lesion size and severity on the BEST-2 and BNT, even at 1 month) and other studies may come from lack of statistical power, because the present study used a smaller sample than the studies described earlier. Nine participants were tested in the present study. A power analysis was performed to assess how many more participants would have been needed to reveal a statistically significant correlation at an alpha level of .01. Using the correlation between BEST-2 scores and lesion size seen on DWI (−.22) as a reference effect size for the power analysis, a total of 103 participants would be needed to reveal a significant correlation using an alpha level of .01 and power of .60. That is to say, if the same correlation between these two variables was found with increased sample size, 103 participants would be needed for a statistically significant correlation.
Because PWI provides information about tissue that is hypoperfused but not (yet) dead, it is likely that PWI more accurately demonstrates cerebral areas that are not receiving enough perfusion to maintain neuronal function than does DWI. Based on visual inspection, most participants studied here appeared to have hypoperfusion that extended beyond the actual lesion. Consequently, left/whole brain perfusion ratio was a better predictor of aphasia severity than lesion size seen on DWI.
The correlation between BEST-2 scores and hypoperfusion was not statistically significant at 1 month post onset. That does not necessarily mean that perfusion in the left hemisphere at 1 month post stroke and aphasia severity are unrelated. Two important factors need to be considered here: ceiling effects on the BEST-2 and statistical power. Unlike in the acute stage, when all participants had at least mild aphasia as measured on the BEST-2, three participants scored within normal limits on the BEST-2 at reassessment. Therefore, it is possible that the correlation is not statistically significant because of a ceiling effect on the language assessment. Thus, it is possible that these three participants were still aphasic but that the BEST-2 was not sensitive enough to detect their aphasia. Indeed, two of the three participants complained of having word-finding difficulty at 1 month post stroke, albeit this difficulty was not apparent to the examiner. Even though the BEST-2 works well for assessment in acute care, other aphasia tests may be added to the assessment battery to obtain more in-depth information when patients are able to participate in longer diagnostic sessions. The only language test on which errors occurred for all participants at 1 month post onset was the Boston Naming Test (BNT). The variance of scores was greater on the BNT than on the BEST-2. Therefore, it is possible that the BNT reflected aphasia severity more accurately at this time than the BEST-2. In fact, the correlation between BNT scores and hypoperfusion was statistically significant at the .01 level. Unequivocally, participants who had low cerebral perfusion ratios were more likely to score low on the BNT than participants whose PWI scans revealed higher perfusion ratios.
Statistical power needs to be considered when such a small sample has been studied. Using the correlation coefficient (.49) between BEST-2 scores and hypoperfusion as a reference effect size, a power analysis was carried out to estimate how many more participants would be needed to reach statistical significance. Using an alpha level of .01, 20 participants would be needed to attain power of at least .60. If a correlation of .49 is the true state of nature between BEST-2 scores and hypoperfusion, it would suggest that there is relationship between aphasia severity and hypoperfusion at 1 month post onset, even though it may not be as strong as in the acute stage. This seems to be an obvious observation, but it is one that needs to be stated because researchers who use lesion data to investigate language function usually assume that what is seen on T2-MRI represents brain tissue with neurons that are capable of firing. T2-MRI does not reveal the remote effects of stroke, something that needs to be taken into account in studies of brain–language relationships. The existence of cerebral hypoperfusion in chronic stroke may also have important implications for treatment of stroke. It has been suggested that more detailed blood pressure management in cases of low cerebral perfusion in stroke may aid in reducing the ischaemic penumbra after the 3-hour time-window for tPA therapy (e.g., Hillis & Heidler, 2002).
The correlation coefficient between BEST-2 scores and lesion size seen on T2-MRI was statistically significant at an alpha-level of .05. Power analysis revealed that with a correlation of −.75, power of .60 would have been reached with nine participants for an alpha level of .01.
At 1 month post stroke visual inspection of perfusion images suggested that the brains of two participants had normal perfusion, and two more experienced increased perfusion compared to day 1. Therefore, it is probable that perfusion had less of an effect on the relationship between lesion size and aphasia severity at this time.
Further research in this area should seek to increase the sample size, as well as to consider in more detail how changes in perfusion and lesion size may affect aphasia outcome. For example, it would be interesting to study how the mismatch between the actual lesion size and hypoperfusion in the acute stage may affect recovery from aphasia. That is, does a patient who has a large ischaemic penumbra recover more or less fully than someone who does not have hypoperfusion beyond the actual lesion seen on DWI?
Footnotes
This research was supported by National Multipurpose Research & Training Center Grant DC-01409 from the National Institute on Deafness and Other Communication Disorders.
References
- Baird AE, Warach S. Magnetic resonance imaging of acute stroke. Journal of Cerebral Blood Flow and Metabolism. 1998;18:583–609. doi: 10.1097/00004647-199806000-00001. [DOI] [PubMed] [Google Scholar]
- Barber PA, Darby DG, Desmond PM, Yang Q, Gerraty RP, Jolley D, Donnan GA, Tress BM, Davis SM. Prediction of stroke outcome with echoplanar perfusion- and diffusion-weighted MRI. Neurology. 1998;51:418–426. doi: 10.1212/wnl.51.2.418. [DOI] [PubMed] [Google Scholar]
- Beaulieu C, de Crespigny A, Tong DC, Moseley ME, Albers GW, Marks MP. Longitudinal magnetic resonance imaging study of perfusion and diffusion in stroke: Evolution of volume and correlation with clinical outcome. Annals of Neurology. 1999;46:568–579. doi: 10.1002/1531-8249(199910)46:4<568::aid-ana4>3.0.co;2-r. [DOI] [PubMed] [Google Scholar]
- Bowers, D., Blonder, L.X., & Heilman, K.M. (1991). The Florida Affect Battery Gainsville, FL: Center for Neuropsychological Studies.
- Cappa SF, Perani D, Grassi F, Bressi S, Alberoni M, Franceschi M, Bettinardi V, Todde S, Fazio F. A PET follow-up study of recovery after stroke in acute aphasics. Brain and Language. 1997;56:55–67. doi: 10.1006/brln.1997.1737. [DOI] [PubMed] [Google Scholar]
- Chalela JA, Alsop DC, Gonzalez-Atavales JB, Maldjian JA, Kasner SE, Detre JA. Magnetic resonance perfusion imaging in acute ischemic stroke using continuous arterial spin labeling. Stroke. 2000;31(3):680–686. doi: 10.1161/01.str.31.3.680. [DOI] [PubMed] [Google Scholar]
- Heiss WD, Karbe H, Weber-Luxenburger G, Herholz K, Kessler J, Pietrzyk U, Pawlik G. Speech-induced cerebral metabolic activation reflects recovery from aphasia. Journal of Neurological Sciences. 1997;145(2):213–217. doi: 10.1016/s0022-510x(96)00252-3. [DOI] [PubMed] [Google Scholar]
- Hillis AE, Barker PB, Beauchamp NJ, Gordon B, Wityk RJ. MR perfusion imaging reveals regions of hypoperfusion associated with aphasia and neglect. Neurology. 2000;55(6):782–788. doi: 10.1212/wnl.55.6.782. [DOI] [PubMed] [Google Scholar]
- Hillis AE, Heidler J. Mechanisms of early aphasia recovery. Aphasiology. 2002;16:885–895. [Google Scholar]
- Hillis AE, Wityk RJ, Tuffiash E, Beauchamp NJ, Jacobs MA, Barker PB, Selnes OA. Hypoperfusion of Wernicke’s area predicts severity of semantic deficit in acute stroke. Annals of Neurology. 2001;50(5):561–566. doi: 10.1002/ana.1265. [DOI] [PubMed] [Google Scholar]
- Kaplan, E., Goodglass, H., & Weintraub, S. (2001). Boston Naming Test (2nd edn). Philadelphia: Lippincott Williams & Wilkins.
- Kertesz, A. (1982). Western Aphasia Battery New York: Grune & Stratton.
- Kertesz A, Harlock W, Coates R. Computer tomographic localization, lesion size and prognosis in aphasia and nonverbal impairment. Brain and Language. 1979;8:34–50. doi: 10.1016/0093-934x(79)90038-5. [DOI] [PubMed] [Google Scholar]
- Kwong KK, Chesler DA, Weisskoff RM, Donahue KM, Davis TL, Ostergaard L, Campbell TA, Rosen BR. MR perfusion studies with T1-weighted echo planar imaging. Magnetic Resonance in Medicine. 1995;34(6):878–887. doi: 10.1002/mrm.1910340613. [DOI] [PubMed] [Google Scholar]
- Lev MH, Segal AZ, Farkas J, Hossain ST, Putman C, Hunter GJ, Budzik R, Harris GJ, Buonanno FS, Ezzeddine MA, Chang Y, Koroshtz WJ, Gonzalez RG, Schwamm LH. Utility of perfusion-weighted CT imaging in acute middle cerebral artery stroke treated with intra-arterial thrombolysis. Stroke. 2001;32:2021–2034. doi: 10.1161/hs0901.095680. [DOI] [PubMed] [Google Scholar]
- Mazzoni M, Vista M, Pardossi L, Avial L, Bianchi F, Moretti P. Spontaneous evolution of aphasia after ischaemic stroke. Aphasiaology. 1992;6:387–369. [Google Scholar]
- Metter EJ, Hanson WR, Jackson CA, Kempler D, van Lancker D, Maziotta JC, Phelps ME. Temporoparietal cortex in aphasia evidence from positron emission tomography. Archives of Neurology. 1990;47:1235–1238. doi: 10.1001/archneur.1990.00530110097024. [DOI] [PubMed] [Google Scholar]
- Metter EJ, Jackson CA, Kempler D, Hanson WR. Temporoparietal cortex and the recovery of language comprehension in aphasia. Aphasiology. 1992;6(4):349–358. [Google Scholar]
- Neumann-Haefelin T, Moseley ME, Albers GW. New magnetic resonance imaging methods for cerebrovascular disease: Emerging clinical applications. Annals of Neurology. 2000;47(5):559–570. [PubMed] [Google Scholar]
- Pedersen PM, Jorgensen HS, Nakayama H, Raaschou HO, Olsen TS. Aphasia in acute stroke: Incidence, determinants, and recovery. Annals of Neurology. 1995;38(4):659–666. doi: 10.1002/ana.410380416. [DOI] [PubMed] [Google Scholar]
- Thomas DL, Lythgoe MF, Pell GS, Calamante F, Ordidge RJ. The measurement of diffusion and perfusion in biological systems using magnetic resonance imaging. Physics in Medicine and Biology. 2000;45:R97–R138. doi: 10.1088/0031-9155/45/8/201. [DOI] [PubMed] [Google Scholar]
- Tong DC, Yenari MA, Albers GW, O’Brien M, Marks MP, Moseley ME. Correlation of perfusion- and diffusion-weighted MRI with NIHSS score in acute (<6.5 hour) ischemic stroke. Neurology. 1998;50:864–869. doi: 10.1212/wnl.50.4.864. [DOI] [PubMed] [Google Scholar]
- West, J.F., Sands, E.S., & Ross-Swain, D. (1998). Bedside Evaluation Screening Test (2nd Edn). Austin, TX: Pro-Ed.