

Abstract
Simultaneous determination of biogenic monoamines such as dopamine, serotonin, and 3-methoxytyramine in brain is important in understanding neurotransmitter activity. This study presents a sensitive determination of biogenic monoamines in rat brain striatum microdialysates using capillary high-performance liquid chromatography with the photoluminescence following electron-transfer detection technique. Separation conditions were optimized by changing the concentration of an ion-interaction agent and the percentage of an organic modifier. The high concentration of ion-interaction agent enabled the amines as a class to be separated from interfering acids, but also made the separation very long. To shorten the separation time, 10% (v/v) acetonitrile was used as the organic modifier. Eight chromatographic runs during a 3-h period were analyzed in terms of retention times, peak heights, and peak widths. Chromatograms are very reproducible, with less than 1% changes in peak height over 3 h. Typical concentration detection limits at the optimum separation conditions were less than 100 pM for metabolic acids and ~200 pM for monoamines. The injection volume of the sample was 500 nL. Thus, the mass detection limits were less than 50 amol for metabolic acids and ~100 amol for monoamines. Typical separation time was less than 10 min. To validate the technique, the separation method was applied to the observation of drug-induced changes of monoamine concentrations in rat brain microdialysis samples. Local perfusion of tetrodotoxin, a sodium channel blocker, into the striatum of an anesthetized rat decreased dopamine, 3-methoxytyramine, and serotonin concentrations in dialysates. Successive monitoring of striatal dialysates at a temporal resolution of 7.7 min showed that the injection of nomifensine transiently increased dopamine and 3-methoxytyramine concentrations in rat brain dialysate.
Biogenic monoamines, such as dopamine (DA) and serotonin (5HT), play important roles as major neurotransmitters in the mammalian central nervous system.1 Reliable measurement of extracellular neurotransmitter concentration is thus important in understanding the central nervous system and its underlying physiology.
Several methods have been used to monitor the extracellular level of neurotransmitters and their metabolites without separation.2–5 However, some neurons do not contain only one neurotransmitter; thus, changes in the neurotransmitter concentrations are often interrelated. Moreover, the real biological response is more likely due to the interplay of all the released neurotransmitters. Therefore, it is highly desirable to monitor the level of several neurotransmitters simultaneously. Measuring extracellular concentrations of neurotransmitter metabolites, including 3, 4-dihydroxyphenylacetic acid (DOPAC), 3-methoxytyramine (3MT), 5-hydroxyindole-3-acetic acid (5HIAA), and homovanillic acid (HVA), is also important in understanding the metabolic pathways and their kinetics.6
Since the first successful combination of microdialysis and high-performance liquid chromatography (HPLC) in 1980s,7 the technique has been most widely used in the study of neurotransmitters and their metabolites. Typical detection methods are electrochemical detection (HPLC-EC)8,9 and fluorescence detection (HPLC-FL).10–12 The high sensitivity and selectivity of HPLC-EC is beneficial, but its reliability is compromised due to electrode fouling. On the other hand, the utility of HPLC-FL is dictated by the availability of suitable fluorescent labels. Analytes can be derivatized, but it requires multiple sample treatment steps and can induce extra band broadening if it is done after separation.
The photoluminescence following electron-transfer (PFET) technique,13,14 developed in our laboratory, is a useful detection scheme for electrochemically active molecules. A fluid stream containing a homogeneous oxidant is mixed with chromatographic eluent in a diffusion-controlled mixer. The oxidant is subsequently reduced allowing photoluminescence upon optical excitation, which is quantitatively measured and recorded. No surface reaction is involved in the PFET process; thus no electrode fouling can happen. Also, PFET detection does not include derivatization steps, but rather an electron-transfer reaction. As long as the analyte can be oxidized by the homogeneous oxidant, which is true for many neurotransmitters and their metabolites, the PFET technique can be applied after separation with negligible band broadening.15,16
In the present study, we report the successful combination of capillary HPLC with tris(2,2′-bipyridine)osmium(III) (13+) as the postcolumn PFET reagent. Capillary HPLC is especially suited for the analysis of biological samples due to its small sample load volume and high sensitivity.17,18 Rat brain microdialysis samples were analyzed to show the effectiveness of the system by monitoring the changes in neurotransmitter concentrations under previously characterized conditions. The PFET approach has competitive detection limits (both mass and concentration) and is both rapid and reproducible.
EXPERIMENTAL SECTION
Reagents
All chemicals from commercial sources were used as received without further purification except where noted. Reagent and sources were as follows: trifluoroacetic acid (TFA) from Acros (Geel, Belgium); monochloroacetic acid from Mallinck-rodt (St. Louis, MO); acetonitrile, 2-propanol, and sodium acetate from EMD (Gibbstown, NJ); 1-propanol, lead dioxide, sodium hydroxide, glacial acetic acid, and disodium EDTA from J. T. Baker (Phillipsburg, NJ); tetrodotoxin (TTX; with citrate) from Alomone Labs (Jerusalem, Israel); sodium perchlorate from Aldrich (Milwaukee, WI); chloral hydrate, nomifensine, dopamine hydrochloride, DOPAC, serotonin hydrochloride, 3-methoxy-tyramine hydrochloride, 5HIAA, HVA, and sodium 1-octane-sulfonate (SOS) from Sigma (St. Louis, MO). Sodium perchlorate was recrystallized from methanol once to remove chloride. All aqueous solutions were prepared with deionized water (18.2MΩ resistivity) from a Millipore Milli-Q Synthesis A10 system (Billerica, MA).
Preparation of Metal Polypyridyl Complexes
Os(bpy)3- (PF6)2 (1) was prepared and recrystallized in our laboratory according to previously reported procedures.19 Crystals of the osmium complex were dissolved in acetonitrile to make a 1.0 mM stock solution. Aliquots of the stock solution were diluted in an acidic electrolyte solution (0.2% TFA and 0.1 M NaClO4 in acetonitrile) to prepare the PFET reagent solution. The resulting solution was used after passing a disposable 0.45-μm PTFE/PP syringe filter (Chrom Tech, Apple Valley, MN).
Chromatographic System
Two HPLC pumps (models 590 and 600/626S, Waters, Milford, MA) or a syringe pump (model 100DM, Isco, Lincoln, NE) with simple tees as flow splitters delivered solutions at ~1 μL/min. One pump was used to deliver the mobile phase and another to deliver the PFET reagent. As flow splitting was used, the flow rate from each source was frequently checked by measuring the volume of solutions delivered in a specific time, to ensure the correct flow rate is maintained during experiments. Flow rates were typically between 0.95 and 1.05 μL/min in both chromatography and postcolumn reactor.
Homemade capillary columns were packed by previously described techniques17 using 100-μm-i.d., 360-μm-o.d. fused-silica capillaries (Polymicro Technologies, Pheonix, AZ) as the column blank. The column was slurry packed with reversed-phase particles at 3000–4000 psi using a constaMetric III metering pump (LDC Analytical, Riveria Beach, FL)15 and connected directly to an Upchurch loop microinjector (Oak Harbor, WA), which introduced 500 nL of each sample into the column.
A capillary Taylor reactor was used to mix the chromatographic eluents and the postcolumn PFET solution. It was prepared according to the previously reported procedure.15,16,20 The ends of two 18-μm tungsten wires (Goodfellow, Devon, PA) were each threaded into two 50-μm fused-silica capillaries (Polymicro Technologies). The other ends were both threaded into another 50-μm fused-silica capillary to form a Y-shaped device. The third capillary was coated with a transparent polymer (Polymicro Technologies). The junction between three capillaries was placed in a piece of dual shrink/melt tubing (Small Parts, Miami Lakes, FL). After sufficient heat was applied and the device was allowed to cool, the tungsten wires were removed to create fluid conduits of 18-μm diameter between 50-μm capillaries. The reaction length was set at 8 cm from the confluence according to the previous study.16
Optical Detection Setup
A laser beam from a 30-mW variable-power blue-line argon ion laser (model 2201-30BL, Cyonics/Uniphase, San Jose, CA) passed through a 488-nm band-pass filter and was focused onto an optically transparent capillary. Photoluminescence from 12+ was measured using an epifluorescence optical setup: a microscopic objective lens (Plan Neofluar 20×, NA 0.5, Carl Zeiss, Thornwood, NY) focused the optical emission from the capillary and a combination of a dichroic mirror (cutoff at 500 nm) and optical filters (a 600-nm long-pass filter and a 750-nm band-pass filter, angle tuned) passed the photoluminescence into an IR-sensitive photomultiplier tube (R374, Hamamatsu, Bridgewater, NJ). A Keithley 6485 picoammeter (Cleveland,OH) converted photocurrent from the photomultiplier tube to a dc voltage signal. An IBM-compatible computer with a PeakSimple Chromatographic Data System (SRI Instruments, Torrance, CA) collected the dc signal after a 0.4-Hz eight-pole low-pass filter (Wavetek 852 dual filter, San Diego, CA).
Chromatographic Conditions for Separation of Mono-amines
The capillary column was slurry packed to 7.6 cm with 2.6 μm XTerra MS-C18 (Waters) reversed-phase particles. Aqueous buffers containing 100 mM sodium acetate or a mixture of sodium acetate and monochloroacetic acid (total concentration of 100 mM), 0.15 mM disodium EDTA, and SOS (pH was adjusted with glacial acetic acid or concentrated NaOH solution) were mixed with organic modifiers, such as acetonitile or methanol. The mobile phase was passed through a Nylon filter with 0.45-μm pores (Osmonics, Minnetonka, MN).
Chromatographic Standard Samples
Stock solutions of 1.0 mM analytes were prepared in 0.1 M acetic acid and stored frozen. The frozen stock solutions were thawed before each use and were diluted to desired concentrations in degassed solutions. Typically, successive 10-fold dilutions were made using 0.1 M acetic acid except the final dilution, where artificial cerebrospinal fluid (aCSF), was used to mimic the sample matrix of the microdialysis samples. The aCSF contained 145.0 mM NaCl, 2.7 mM KCl, 1.0 mM MgCl2, 1.2 mM CaCl2, 0.45 mM NaH2PO4, and 1.55 mM Na2HPO4 at pH 7.4.
Animal and Surgical Procedures
All procedures involving animals were conducted with approval of the Institutional Animal Care and Use Committee of the University of Pittsburgh. Male Sprague–Dawley rats (250–375 g, Hilltop, Scottdale, PA) were anesthetized with chloral hydrate (initial dose of 300 mg/kg ip with additional doses of 50 mg/kg ip as needed to maintain anesthesia) and wrapped in a homeothermic blanket (EKEG Electronics,Vancouver, BC, Canada). The rats were placed in a stereotaxic frame (David Kopf Instruments, Tujunga, CA) with the incisor bar set at 5 mm above the interaural line,21 and appropriately placed holes were drilled through the skull.
Microdialysis
Vertical concentric microdialysis probes (220-μm o.d., 4 mm long) were constructed with hollow fiber dialysis membrane (Spectra-Por RC hollow fiber; MWCO 13 000; 160-μm i.d.; Spectrum Laboratories Inc., Rancho Dominguez, CA) and fused-silica outlet lines (150-μm o.d., 75-μm i.d., Polymicro Technologies). The microdialysis probe was implanted into the striatum, a brain region richly innervated by dopamine neurons, over a period of 30 min to the following coordinates: 2.5 mm anterior to bregma, 2.5 mm lateral from midline, and 7.0 mm below dura. The probe was perfused with aCSF at 0.586 μL/min for at least 2 h before samples were collected for analysis. Tetrodotoxin (100 μM) was delivered directly to the striatum by adding it to the microdialysis perfusion fluid. Nomifensine (20 mg/kg, ip) was prepared in phosphate-buffered saline. All brain dialysate samples were collected in vials containing a volume of 0.10 M acetic acid equal to 10% of the intended sample volume. The typical volume of the dialysis samples was 5 μL unless otherwise noted. For nomifensine experiments, four consecutive samples were collected from an anesthetized rat brain striatum at an interval of 15 min to monitor basal levels of monoamines. After the ip injection of nomifensine, the sampling interval was reduced to 7.7 min to increase the temporal resolution. The dialysate samples were stored in an ice bath for immediate analysis or frozen for future use.
RESULTS AND DISCUSSION
Optimizing the Separation Conditions
The separation conditions for the biogenic monoamines were optimized using three parameters: pH of the mobile phase, the SOS (ion-interaction agent) concentration, and the percentage of organic modifier. The major technical problem in the separation was that the brain dialysates contained interfering compounds, including amines and acids. Retention times of solutes usually depend on pH, according to their pKa values. However, a previous study proved that the PFET system works best at acidic conditions.13,22 The pH values of the mobile phases tested were thus limited to a range of pH from 3.0 to 5.0. Generally, in this range acids are retained less at higher pH while the retention of amines is not influenced much by changes in pH.
A more effective optimization could be achieved by changing the SOS concentration and the organic modifier content. SOS is known to retain ammonium ions electrostatically. Thus, a high concentration of SOS makes monoamines as a class separate from acids. The SOS concentrations of the mobile phases were from 0 to 10 mM. Successful separations of monoamines and metabolic acids in standard samples (DA, DOPAC, HVA, 3MT, 5HT, 5HIAA) were achieved with a mobile phase at low or intermediate concentrations of SOS. However, application of the same separation condition to the rat brain dialysates was not successful. The concentrations of uric acid, ascorbic acid, and the acidic metabolites in the brain dialysates are much higher than the concentrations of monoamines, typically a few orders of magnitude higher. Thus, monoamine peaks were usually buried by huge peaks of metabolic acids, and quantification of the peaks was difficult. This problem was solved by using a high concentration of SOS to retain the monoamines even longer in the column: the monoamines were eluted even later than the typical late runner, HVA. The use of SOS at high concentration, however, resulted in a very long chromatographic run and band broadening of the more retained monoamines. Thus, organic modifiers, methanol and acetonitrile in this study, were used to shorten the chromatographic run time. The optimum organic modifier was 10% (v/v) acetonitrile. A typical isocratic chromatographic run time for a standard mixture was less than 7 min. Using organic modifiers not only shortened the chromatographic run times but also achieved on-line preconcentration of analytes: since the injection solution did not contain any organic solvents, injected analytes were concentrated at the front of the column until the more hydrophobic mobile phase eluted the analytes. Thus, peak volumes of analytes are smaller than the injection volume. Figure 1 shows a typical optimized separation of standard analytes.
Figure 1.
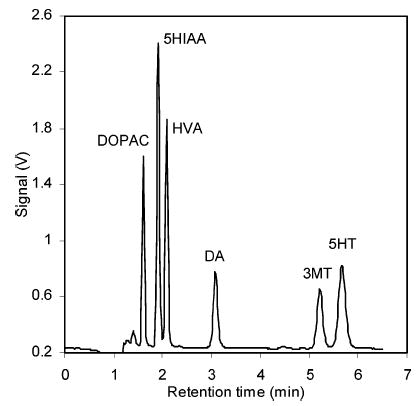
Typical chromatogram of a standard injection sample, containing DA, DOPAC, 3MT, HVA, 5HT, and 5HIAA, each at 100 nM. Separation conditions were as follows. Column: 100-μm-i.d., 7.6-cm-length capillary column packed with XTerra MS-C18 reversed-phase particles. Mobile phase: pH 4.0 aqueous buffer containing 100 mM sodium acetate, 0.15 mM disodium EDTA, and 10.0 mM SOS, mixed with 10% (v/v) acetonitrile. Flow rate: 1 μL/min. Injection volume: 500 nL.
Reproducibility, Linearity, and Detection Limits
The chemistry of the detection is more thoroughly explained in the accompanying paper.22 For the determination of monoamines, the reproducibility of a method is very important. Table 1 shows the variability of the retention times, the peak heights, and the peak widths (full width at half-maximum, fwhm) for eight chromatographic runs during a 3-h period. Some of the eight chromatograms are consecutive. Chromatograms are very reproducible, with changes in peak height less than 1% of over the 3-h period. This is remarkable reproducibility for a nominally electrochemical detection technique.
Table 1.
Reproducibility of the Chromatographic Retention and the Detector Sensitivitya
| analytes | retention time (min) | peak height (mV) | fwhm (s) |
|---|---|---|---|
| DOPAC | 1.78 (0.00) | 546 (3) | 3.48 (0.00) |
| 5HIAA | 2.31 (0.00) | 811 (5) | 4.10 (0.09) |
| HVA | 2.56 (0.00) | 494 (3) | 4.23 (0.10) |
| DA | 3.07 (0.00) | 183 (1) | 7.86 (0.08) |
| 3MT | 5.45 (0.00) | 133 (1) | 7.86 (0.12) |
| 5HT | 5.95 (0.01) | 291 (2) | 9.42 (0.11) |
Eight chromatographic runs of 50 nM mixture samples were analyzed. Values in the parentheses are standard errors of the mean for eight repeats. Separation conditions were slightly different from Figure 1. Mobile phase contained the aqueous buffer of 100 mM sodium acetate, 0.15 mM disodium EDTA, and 7.0 mM of SOS at pH 4.0, mixed with 87.5:12.5 (v/v) acetonitrile. Capillary column was slurry packed to 9.5 cm with 3-μm AlltimaC18.
A calibration fit revealed the linearity of the detector and the detection limits. Standard solutions containing DA, 3MT, and 5HT from 0 to 100 nM were injected, and the resulting peak heights were analyzed. Typical regression equations for peak heights versus concentrations (mV/nM) were as follows: y = 4.88x + 0.06 (r2 = 1.000) for DA, y = 3.64x – 5.06 (r2 = 0.997) for 3MT, and y = 5.99x – 2.37 (r2 = 0.999) for 5HT.
The concentration detection limits for monoamines were calculated from the calibration fit, and those of metabolic acids were from a standard injection containing 100 nM analytes using a signal-to-noise ratio of 3. Typical concentration detection limits were 62 pM for DOPAC, 41 pM for 5HIAA, 55 pM for HVA, 180 pM for DA, 250 pM for 3MT, and 150 pM for 5HT. The injection volume of the sample was 500 nL. Thus, the mass detection limits were 31 amol for DOPAC, 21 amol for 5HIAA, 27 amol for HVA, 92 amol for DA, 120 amol for 3MT, and 75 amol for 5HT.
Analysis of Rat Brain Microdialysates
The optimized chromatographic conditions were used to determine monoamine concentrations in rat brain dialysates. Figure 2 shows the chromatograms of dialysates from a rat brain striatum before and after local infusion of TTX for ~60 min. Local infusion of TTX caused a significant decrease of monoamine concentrations in the microdialysate samples: basal levels of DA, 3MT, and 5HT were 10.6, 3.6 and 1.2 nM, respectively, while concentrations of the same compounds after local infusion of TTX were 3.1, 1.6, and 0.6 nM. Concentrations are not corrected for in vitro probe recovery. Generally accepted literature values for basal microdialysate concentrations of DA and 5HT in rat brain striatum are 5–12 and 0.2–6 nM.3,23,24
Figure 2.
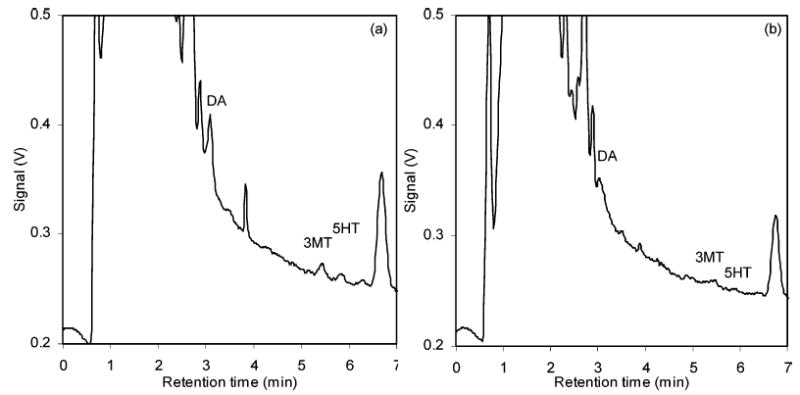
Chromatograms of rat brain dialysates (a) before and (b) after the local infusion of TTX for 60 min. TTX decreased the DA concentration to ~30% of basal level and other monoamines to ~50%.12 Separation conditions were the same as in Figure 1.
The small injection volume of the capillary HPLC, combined with a short HPLC analysis time, enabled the consecutive analysis of the samples. Our optimized HPLC-PFET method was applied to monitor the drug-induced changes of the monoamine concentrations. Figure 3 shows the concentration changes of the monoamines upon the injection of nomifensine, a dopamine reuptake blocker. The dopamine level increased by ~10 times soon after nomifensine was injected and gradually relaxed to a value still higher than the basal level of dopamine. The concentration of 3MT changed with the same time course as that of DA. Typical chromatograms from the analysis are presented in Figure 4. All the solutes were eluted in 9 min; thus, the total analysis time for all 16 chromatographic runs was less than 2.5 h (9 min ×16 = 144 min).
Figure 3.
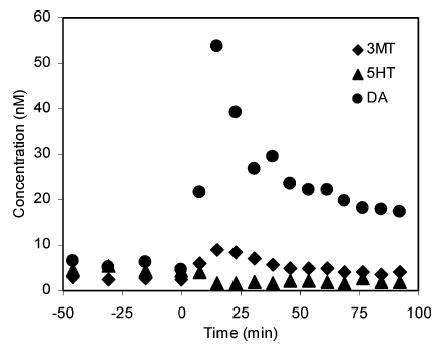
Concentration changes of the monoamines in the rat brain striatum dialysates after injection of nomifensine. Injection time of nomifensine is marked as time 0.
Figure 4.
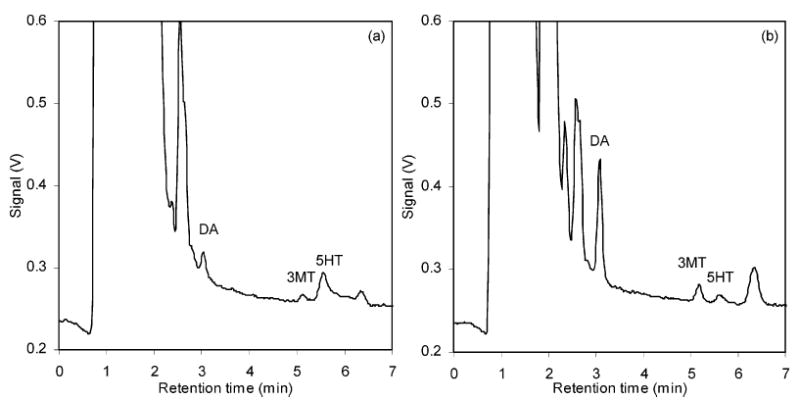
Typical chromatograms of rat brain dialysis (a) before and (b) after the injection of nomifensine. Separation conditions were same as in Figure 1.
Comparison with Other Techniques
The utility of the detection method can be assessed by several factors: (1) concentration or mass detection limits, (2) sample requirements, (3) variety of detectable analytes, and (4) analysis time. The capillary electrophoresis (CE) combined with laser-induced fluorescence technique generally showed good mass detection sensitivity, typically ~300 amol of catecholamines.25–28 This is mainly due to the small sample volume for CE. Nonfluorescent catecholamine analytes were successfully derivatized with naphthalene-2,3-dicarboxaldehyde (NDA) before separation. The relatively fast reaction of NDA, on the order of few minutes, was successfully combined with an on-line derivatization technique to achieve continuous detection of catecholamines with a temporal resolution of 20 s.27 However, the NDA derivatization technique is highly selective: DOPAC, a very important dopamine metabolite, cannot be derivatized due to the lack of a primary amine.29 Serotonin could not be derivatized either. Thus, simultaneous detection of catecholamines and indoleamines with their metabolites is not possible. Serotonin was reported to be derivatized with fluorescein isothiocyanate,30 but its detection limit was on the order of 20 nM with a 2-h derivatization time.
Table 2 shows a summary of the comparison of PFET to the best fluorescence approach and the most recent electrochemical detector approaches. Yamaguchi, Kehr, and co-workers presented a successful precolumn derivatization technique for catecholamines, indoleamines, and their metabolites combined with HPLC.12,31,32 The two-step derivatization involves reactions of benzylamine and 1,2-diphenylethylenediamine. This technique enabled simultaneous detection of many neurotransmitters and their metabolites with very good detection sensitivity. Typical mass detection limits are ~100 amol with 10–20-μL injections. However, the technique is limited due to the long analysis time and pretreatment steps. The derivatization step takes ~20 min at elevated temperature (50 °C), and the chromatographic run time is ~50 min.
Table 2.
Comparison of Detection Limits, Separation Time, and Detectable Analytes for HPLC Detection
| Detctn method | analytesa | Analysis time | Injection volume | Mass detection limit | Concentration detection limit |
|---|---|---|---|---|---|
| FL12 | DA, 5HT, NE | 22 + 50 min | 10 μL | 42 amol (DA) | 4.2 pM (DA) |
| 76 amol (5HT) | 7.6 pM (5HT) | ||||
| FL32 | DA, 5HT, NE, 5HIAA, DOPAC, l-DOPA | 22 + 50 min | 20 μL | 130 amol (DA) | 19.5 pM (DA) |
| 200 amol (5HT) | 30 pM (5HT)b | ||||
| ECc,38 | DA, NE, E | 10 min | 200 nL | 25 amol (DA, NE) | 120 pM (DA, NE) |
| EC35 | DA | 11 min | 10 μL | 600 amol (DA) | 60 pM (DA) |
| EC34 | DA, 5HT, NE | 25 min | 10 μL | 3–6 fmol | 300–600 pM |
| EC39 | DA, 5HT, NE, DOPAC, HVA, 5HIAA | 30 min | 50 μL | 110 fmol (DA) | 2.2 nM (DA) |
| 28 fmol (5HT) | 560 pM (5HT) | ||||
| ECd,24 | DA, 5HT, DOPAC, HVA, 5HIAA | 25 min | 15 μL | 0.5–1 fmol | 30–70 pM |
| ECe,37 | DA, 5HT, NE, E, DOPAC | 25 min | 20 μL | 50 fmol (DA) | 2.5 nM (DA) |
| 20 fmol (5HT) | 1.0 nM (5HT) | ||||
| 10 fmol (NE, E) | 500 pM (NE, E) | ||||
| PFETf | DA, 5HT, 3MT, HVA, | < 10 min | 500 nL | 92 amol (DA) | 180 pM (DA) |
| DOPAC, 5HIAA | 120 amol (3MT), 75 amol (5HT) | 250 pM (3MT) | |||
| 150 pM (5HT) |
Analyte abbreviations given in text except for NE, norepinephrine, and E, epinephrine.
Due to dilution during derivatization.
Electrochemical detection with redox-cycling.
Electrochemical detection with the thin-layer amperometic cell.
Electrochemical detection with the modified dual electrodes.
This work.
HPLC-EC is one of the most widely used techniques for neurotransmitter detection, because there is no need for sample pretreatment. Simultaneous detection of various neurotransmitters and their metabolites is possible in ~20 min depending on the separation conditions.6,33 Typical detection limits are ~1 nM (see Table 2), but careful optimization of the separation/detection conditions34–36 and modification of an electrode surface37 enabled the even higher detection sensitivity of subnanomolar concentrations. Innovations in cell design24,38 also improved the detection sensitivity to lower than 100 pM. The typical sample injection volume was 10 μL. In one case, the injection volume was 200 nL,38 however, the technique uses redox recycling and thus it is limited to reversible couples. Furthermore, it was not applied to real samples.
The performance of PFET combined with a capillary HPLC system is comparable to that of the best HPLC-EC or HPLC-FL: its typical detection limits are ~100 pM (with 500-nL injection volume) with a short analysis time of less than 10 min. Aside from the good detection performance, the technique is remarkably robust. Chromatographic parameters (retention, peak shape, sensitivity) are reproducible. There is no electrode fouling problem and no need for a pretreatment step before injection.
Acknowledgments
This study was supported by NIH through Grant 2R01GM-044842. We acknowledge Dr. Eskil Sahlin for synthesis of Os(bpy)3(PF6)2, and Joe Mitala and Katherine Bohovic for providing rat brain microdialysis samples at the initial stage of this study. We thank Dr. Ed Bouvier at Waters Corp., Milford, MA, for the gift of the XTerra packing material.
References
- 1.Nestler, E. J.; Hyman, S. E.; Malenka, R. C. Molecular Neuropharmacology; McGraw-Hill: New York, 2001.
- 2.Troyer KP, Heien MLAV, Venton BJ, Wightman RM. Curr Opin Chem Biol. 2002;6:696–703. doi: 10.1016/s1367-5931(02)00374-5. [DOI] [PubMed] [Google Scholar]
- 3.Khan AS, Michael AC. Trends Anal Chem. 2003;22:503–508. [Google Scholar]
- 4.Michael D, Travis ER, Wightman RM. Anal Chem. 1998;70:586A–592A. doi: 10.1021/ac9819640. [DOI] [PubMed] [Google Scholar]
- 5.Perez XA, Andrews AM. Anal Chem. 2005;77:818–826. doi: 10.1021/ac049103g. [DOI] [PubMed] [Google Scholar]
- 6.Kumar AM, Fernandez JB, Schneiderman N, Goodkin K, Eisdorfer C, Kumar M. J Liq Chromatogr Relat Technol. 1999;22:2211–2223. [Google Scholar]
- 7.Ungerstedt U, Herrera-Marschitz M, Jungnelius U, Stahle L, Tossman U, Zetterstroem T. Adv Biosci (Oxford) 1982;37:219–231. [Google Scholar]
- 8.Nagatsu T. J Chromatogr. 1991;566:287–307. doi: 10.1016/0378-4347(91)80246-9. [DOI] [PubMed] [Google Scholar]
- 9.Kissinger PT, Bruntlett CS, Shoup RE. Life Sci. 1981;28:455–465. doi: 10.1016/0024-3205(81)90138-7. [DOI] [PubMed] [Google Scholar]
- 10.Kehr J. J Chromatogr, A. 1994;661:137–142. [Google Scholar]
- 11.Parrot S, Bert L, Mouly-Badina L, Sauvinet V, Colussi-Mas J, Lambas-Senas L, Robert F, Bouilloux JP, Suaud-Chagny MF, Denoroy L, Renaud B. Cell Mol Biol. 2003;23:793–804. doi: 10.1023/A:1025009221285. [DOI] [PMC free article] [PubMed] [Google Scholar]
- 12.Yoshitake T, Yoshitake S, Fujino K, Nohta H, Yamaguchi M, Kehr J. J Neurosci Methods. 2004;140:163–168. doi: 10.1016/j.jneumeth.2004.04.041. [DOI] [PubMed] [Google Scholar]
- 13.Woltman SJ, Even WR, Weber SG. Anal Chem. 1999;71:1504–1512. doi: 10.1021/ac981181e. [DOI] [PubMed] [Google Scholar]
- 14.Woltman SJ, Even WR, Sahlin E, Weber SG. Anal Chem. 2000;72:4928–4933. doi: 10.1021/ac000170u. [DOI] [PubMed] [Google Scholar]
- 15.Beisler AT, Sahlin E, Schaefer KE, Weber SG. Anal Chem. 2004;76:639–645. doi: 10.1021/ac034785d. [DOI] [PMC free article] [PubMed] [Google Scholar]
- 16.Jung MC, Weber SG. Anal Chem. 2005;77:974–982. doi: 10.1021/ac0486241. [DOI] [PMC free article] [PubMed] [Google Scholar]
- 17.Kennedy RT, Jorgenson JW. Anal Chem. 1989;61:1128–1135. doi: 10.1021/ac00180a012. [DOI] [PubMed] [Google Scholar]
- 18.Chervet JP, Van Soest REJ, Salzmann JP. LC-GC. 1992;10(866):868–871. [Google Scholar]
- 19.Gaudiello JG, Bradley PG, Norton KA, Woodruff WH, Bard AJ. Inorg Chem. 1984;23:3–10. [Google Scholar]
- 20.Sahlin E, Beisler AT, Woltman SJ, Weber SG. Anal Chem. 2002;74:4566–4569. doi: 10.1021/ac025622c. [DOI] [PMC free article] [PubMed] [Google Scholar]
- 21.Pellegrino, L. J.; Pellegrino, A. S.; Cushman, A. J. A Stereotaxic Atlas of the Rat Brain, 2nd ed.; Plenum Press: New York, 1979.
- 22.Jung, M. C.; Munro, N.; Shi, G.; Michael, A. C.; Weber, S. G. 2006, 77, 1761–1768. (ac051182o) [DOI] [PMC free article] [PubMed]
- 23.Trabace L, Cassano T, Tucci P, Steardo L, Kendrick KM, Cuomo V. Brain Res. 2004;1008:293. doi: 10.1016/j.brainres.2004.01.090. [DOI] [PubMed] [Google Scholar]
- 24.Chaurasia CS, Chen CE, Ashby CR., Jr J Pharm Biomed Anal. 1999;19:413–422. doi: 10.1016/s0731-7085(98)00182-4. [DOI] [PubMed] [Google Scholar]
- 25.Bert L, Robert F, Denoroy L, Renaud B. Electrophoresis. 1996;17:523–525. doi: 10.1002/elps.1150170318. [DOI] [PubMed] [Google Scholar]
- 26.Bert L, Robert F, Denoroy L, Stoppini L, Renaud B. J Chromatogr, A. 1996;755:99–111. doi: 10.1016/s0021-9673(96)00595-x. [DOI] [PubMed] [Google Scholar]
- 27.Parrot S, Sauvinet V, Riban V, Depaulis A, Renaud B, Denoroy L. J Neurosci Methods. 2004;140:29. doi: 10.1016/j.jneumeth.2004.03.025. [DOI] [PubMed] [Google Scholar]
- 28.Robert F, Bert L, Lambas-Senas L, Denoroy L, Renaud B. J Neurosci Methods. 1996;70:153. doi: 10.1016/s0165-0270(96)00113-6. [DOI] [PubMed] [Google Scholar]
- 29.Desvignes C, Bert L, Vinet L, Denoroy L, Renaud B, Lambas-Senas L. Neurosci Lett. 1999;264:5–8. doi: 10.1016/s0304-3940(99)00139-1. [DOI] [PubMed] [Google Scholar]
- 30.Roman DA, Carretero AS, Blanco CC, Gutierrez AF. Biomed Chromatogr: BMC. 2004;18:422–426. doi: 10.1002/bmc.330. [DOI] [PubMed] [Google Scholar]
- 31.Fujino K, Yoshitake T, Kehr J, Nohta H, Yamaguchi M. J Chromatogr, A. 2003;1012:169–177. doi: 10.1016/s0021-9673(03)01180-4. [DOI] [PubMed] [Google Scholar]
- 32.Yoshitake T, Kehr J, Yoshitake S, Fujino K, Nohta H, Yamaguchi M. J Chromatogr, B. 2004;807:177–183. doi: 10.1016/j.jchromb.2004.03.069. [DOI] [PubMed] [Google Scholar]
- 33.Duine JM, Floch F, Cann-Moisan C, Mialon P, Caroff J. J Chromatogr, B. 1998;716:350–353. doi: 10.1016/s0378-4347(98)00301-6. [DOI] [PubMed] [Google Scholar]
- 34.Heidbreder CA, Lacroix L, Atkins AR, Organ AJ, Murray S, West A, Shah AJ. J Neurosci Methods. 2001;112:135–144. doi: 10.1016/s0165-0270(01)00460-5. [DOI] [PubMed] [Google Scholar]
- 35.Virag L, Whittington RA. J Chromatogr, B. 2002;772:267–272. doi: 10.1016/s1570-0232(02)00106-x. [DOI] [PubMed] [Google Scholar]
- 36.Sabbioni C, Saracino MA, Mandrioli R, Pinzauti S, Furlanetto S, Gerra G, Raggi MA. J Chromatogr, A. 2004;1032:65–71. doi: 10.1016/j.chroma.2004.01.008. [DOI] [PubMed] [Google Scholar]
- 37.Zhang W, Cao X, Xie Y, Ai S, Jin L, Jin J. J Chromatogr, B. 2003;785:327–336. doi: 10.1016/s1570-0232(02)00953-4. [DOI] [PubMed] [Google Scholar]
- 38.Cullison JK, Waraska J, Buttaro DJ, Acworth IN, Bowers ML. J Pharm Biomed Anal. 1999;19:253–259. doi: 10.1016/s0731-7085(98)00136-8. [DOI] [PubMed] [Google Scholar]
- 39.Vicente-Torres MA, Gil-Loyzaga P, Carricondo F, Bartolome MV. J Neurosci Methods. 2002;119:31–36. doi: 10.1016/s0165-0270(02)00151-6. [DOI] [PubMed] [Google Scholar]