

Abstract
In the owl midbrain, a map of auditory space is synthesized in the inferior colliculus (IC) and conveyed to the optic tectum (OT). Ascending auditory information courses through these structures via topographic axonal projections. Little is known about the molecular composition of projection neurons or their postsynaptic targets. To visualize axodendritic contacts between identified cell types, we used double-label immunohistochemistry, in vivo retrograde tracing, in vitro anterograde tracing, high-resolution confocal microscopy, three-dimensional reconstruction and fly-through visualization. We discovered a major class of IC neurons that strongly expressed calcium/calmodulin-dependent protein kinase type II, α subunit (CaMKII). The distribution of these cells within the IC was mostly restricted to the external nucleus of the IC (ICX), in which the auditory space map is assembled. A large proportion of ICX-OT projection neurons were CaMKII positive. In addition to being the principal outputs, CaMKII cells were in direct contact with axonal boutons emanating from the main source of input to ICX, the lateral shell of the central nucleus of the inferior colliculus (ICCls). Numerous sites of putative synaptic contact were found on the somata, proximal dendrites, and distal dendrites. Double-label immunoelectron microscopy confirmed the existence of synapses between ICCls axons and the dendrites of CaMKII cells. Collectively, our data indicate that CaMKII ICX neurons are a cellular locus for the computation of auditory space-specific responses. Because the ICCls-ICX projection is physically altered during experience-dependent plasticity, these results lay the groundwork for probing microanatomical rearrangements that may underlie plasticity and learning.
Keywords: convergence, dendrite, development, sound localization, synapse
Introduction
Spatial receptive fields of auditory neurons in the barn owl sound-localization pathway are derived through integration of auditory cues (for review, see Konishi, 2003). This computation must be shaped by the patterns of anatomical convergence from diverse inputs onto the spatially selective auditory neurons. Elucidation of these patterns requires knowledge of the afferent and efferent pathways, a catalog of resident cell types, and the direct visualization of connections between neurochemically identified presynaptic and postsynaptic partners.
A major site of integration is the external nucleus of the inferior colliculus (ICX). Many ICX neurons respond only to sounds arising from discrete directions, termed space-specific neurons (SSNs) (Knudsen and Konishi, 1978). Within the ICX, SSNs selective for different sound-source directions are arranged topographically to form a map of auditory space. This map is relayed to the deep layers of the optic tectum (OT) via excitatory connections (Knudsen and Knudsen, 1983). Thus, one characteristic feature of SSNs is that they provide the principle source of output from the ICX to the OT.
A second characteristic feature of SSNs relates to their input. The principal source of input to ICX is a topographic axonal projection that originates in the lateral shell of the central nucleus of the inferior colliculus (ICCls) (Wagner et al., 1987). Postsynaptic targets of the ICCls-ICX projection must include SSNs, because onset latency to sound stimuli is ∼1-2 ms longer in SSNs than in ICCls (Gold and Knudsen, 2000). Yet, the proportion of the ICCls-ICX projection that directly targets SSNs, as opposed to other ICX cell types, is not known. Knowledge of microanatomical connectivity within the ICCls-ICX projection is essential for additional study of the experience-dependent structural plasticity that is known to occur in ICX (Feldman and Knudsen, 1997; DeBello et al., 2001).
The morphological and physiological characteristics of SSNs have been described previously, most recently by intracellular recording and intracellular labeling (Pena and Konishi, 2001; Nieder et al., 2003). In contrast, little is known about their molecular composition. A number of proteins expressed in the ICX have been documented, including the inhibitory markers calretinin, calbindin, glutamate decarboxylase (GAD) and GABA (Takahashi et al., 1987; Carr et al., 1989), acetylcholinesterase (AChE) (Adolphs, 1993), AMPA receptor subunits (Levin et al., 1997), GABAA receptor subunits (Rodriguez-Contreras and DeBello, 2002; Wagner et al., 2003), and dopamine and cAMP-regulated phosphoprotein 32 (Wagner et al., 2003). It is not known whether the neurons expressing these proteins are SSNs or whether they represent distinct elements of the ICX circuit. Here, we report a new, highly specific marker for a large class of ICX neurons, the calcium/calmodulin-dependent protein kinase type II, α subunit (CaMKIIα). We found that CaMKIIα ICX neurons project to OT and are not inhibitory. To visualize the patterns of synaptic convergence onto these cells, we developed a novel, high-throughput method for confocal analysis. This technique, and conventional double-label immunoelectron microscopy, revealed numerous sites of synaptic contact between ICCls axonal boutons and the dendrites of CaMKIIα neurons. Together, the results indicate that CaMKIIα ICX neurons are a major component of the SSN population.
Materials and Methods
Sixteen barn owls (Tyto alba) were used in this study. Animals were housed in group aviaries and were cared for in accordance with the University of California, Davis animal care policy.
Immunohistochemistry. Owls were perfused transcardially with 100 ml of 0.1 m phosphate buffer (PB), followed by 500 ml of 4% paraformaldehyde in PB (fixative), and 100 ml of 10% sucrose in fixative (all ice-cold). The brain was removed, immersed in 30% sucrose in PB at 4°C overnight for cryoprotection, and processed within 1 week. Tectal lobes were sectioned at 25 μm on a freezing microtome. Both horizontal and coronal planes of section were used (Fig. 1). Sections were incubated in blocking solution containing the following (in %): 4.0 normal goat serum (Vector Laboratories, Burlingame, CA), 0.4 Triton X-100, and 1.0 bovine serum albumin (BSA; Sigma, St. Louis, MO) for 1 h at room temperature (RT). Primary antibodies were diluted in 1.0 normal goat serum, 0.3 Triton X-100, and 1.0 BSA. The following antibodies and working dilutions were used: mouse anti-CaMKIIα at 1:600 (clone 6G9, subtype IgG1; catalog #MAB8699), mouse anti-AChE at 1:2000 (clone AE-1, subtype IgG1; catalog #MAB303), and rabbit anti-GAD 65/67 at 1:600 (catalog #AB1511; all from Chemicon, Temecula, CA), rabbit anti-calretinin at 1:1000 (catalog #7699/4), and anti-calbindin at 1:1000 (catalog #CB38; both from Swant, Bellinzona, Switzerland). Tissue was incubated in primary antibody for 24-48 h at 4°C under gentle agitation. After primary antibody incubation, tissue was rinsed two times for 5 min in 0.02 Triton X-100 and 0.25 BSA at RT. Secondary antibodies were diluted at 5 μg/ml in 0.02 Triton X-100 and 1.0 BSA, and sections were incubated at 4°C for 12-24 h. Before mounting, tissue was rinsed five times for 2 min in 0.25 BSA and two times for 5 min in PB. Tissue sections were mounted on gelatinized coverslips (0.3% gelatin in distilled H2O), allowed to dry for 10-15 min, and inverted and sealed onto slides using Vectashield Hard-Set (Vector Laboratories). All dilutions were made in PB, except where indicated.
Figure 1.

The barn owl midbrain sound-localization pathway. A, Schematic diagram of information flow through the midbrian sound-localization pathway. Binaural cues, ITD and ILD, are represented in frequency-specific channels within the ICC. Information is integrated across cue type in the ICCls and across frequency in the ICX. This computation produces a map of auditory space. The map is conveyed from ICX to the deep layers of the OT, in which it merges with a visual map of space. B, Lateral view of owl brain, showing the planes of section used in this study. The plane parallel to the long axis of the tectal lobe is horizontal (D), and the orthogonal plane is coronal (C). C, Sketch of a coronal section through the rostral IC. Arrows indicate the flow of information from one frequency channel (in kilohertz) in the ICCls to the ICX. The projection is highly divergent in the dorsoventral dimension. D, Sketch of a horizontal section through the middle of the IC. Arrows indicate the flow of ITD information (in microseconds) from the ICCls to the ICX, where it is transformed into a spatiotopic map and subsequently conveyed to the OT. d, Dorsal; r, rostral; v, ventral; c, caudal; l, lateral.
Western blotting. For protein isolation, one owl was deeply anesthetized and decapitated. The tectal lobes were removed and homogenized with ultrasonication in mammalian Ringer's solution containing 1 mg/ml trypsin inhibitor. For comparison, a 300-μm-thick rat brain slice was homogenized under identical conditions. The homogenates were suspended in SDS sample buffer, and the proteins were separated on a 12% SDS-polyacrylamide gel and subsequently transferred to polyvinylidene difluoride membrane. Blots were incubated overnight at 4°C in the anti-CaMKIIα antibody (1:300 dilution), followed by washes and incubation in secondary antibody (goat anti-mouse Alexa Fluor 680; 1:10,000 dilution; Molecular Probes, Eugene, OR) for 30 min. Blots were visualized using an Odyssey infrared detection system (LiCor Biosciences, Lincoln, NE).
In vivo retrograde tracing. Three owls were used for retrograde labeling of ICX neurons, using methods described previously (Feldman and Knudsen, 1997; DeBello and Knudsen, 2004). Briefly, animals were anesthetized using a mixture of 2% isofluorane, 1 L/min oxygen, and 1 L/min nitrous oxide, placed in a soft restraint, and secured to a stereotaxic apparatus within a soundproof recording chamber. A craniotomy was opened, and recording electrodes (Thomas Recording, Giessen, Germany) were lowered through the forebrain into the tectal lobes. Visually evoked multiunit responses were recorded extracellularly from layers throughout the OT. Visual receptive fields were determined using hand-held stimuli projected onto a calibrated tangent screen. Units in the deep layers of the OT were identified by their preference for negative-contrast visual stimuli and by the absence of spontaneous bursting activity that is characteristic of the superficial layers. Injections were made at sites representing frontal space (0° to contralateral 10° azimuth; 0 to -10° elevation). The recording electrode was withdrawn, and a glass electrode containing tracer and 0.1% Triton-X in 0.14 m KCl was placed at the same location and depth. For three injections, the tracer was mini-ruby (10 kDa dextran, tetramethylrhodamine, and biotin; catalog #D-3312; Molecular Probes); for one injection, it was micro-ruby (3 kDa dextran, tetramethylrhodamine, and biotin; catalog #D-7162; Molecular Probes). Tracer was deposited by injecting positive current (2-5 μA) for 15 min using a 7 s on/off cycle. The electrode was withdrawn, and the craniotomy was infused with 1% chloroptic ointment. Survival time was 2-4 d.
In vitro anterograde tracing. Seven owls were used for in vitro tracing. Two different artificial CSF (ACSF) solutions were prepared [sucrose ACSF (in mm): 240 sucrose, 3 KCl, 3 MgCl2, 1.2 NaH2PO4, 23 NaHCO3, and 11 d-glucose; normal ACSF (in mm): 120 NaCl, 3 KCl, 1 MgCl2, 2 CaCl2, 1.2 NaH2PO4, 23 NaHCO3, and 11 d-glucose (∼300 mOsmol, oxygenated with carbogen, pH 7.4)]. Animals were anesthetized and perfused with oxygenated ice-cold sucrose ACSF. After the blood cleared (∼30 s), the animals were decapitated, and the was head opened along the midsagittal plane. The tectal lobes were isolated and maintained in oxygenated ice-cold sucrose ACSF, which was also used to cut the brain slices. Coronal slices (300-500 μm thick) were prepared with a vibratome (Leica, Nussloch, Germany) and kept in oxygenated normal ACSF at RT. Glass micropipettes (1.5 mm outer diameter, with filament; World Precision Instruments, Sarasota, FL) were pulled to a tip diameter of 1-2 μm using a Flaming/Brown puller (Sutter Instrument, Novato, CA). Glass electrodes were back filled with a solution containing 10% micro-ruby in normal ACSF and positioned using a micromanipulator at the center of a custom-made chamber filled with oxygenated normal ACSF (10 ml total volume). Slices were brought into the chamber, and tracer was applied under visual control using a stereo microscope (4× objective; Zeiss, Oberkochen, Germany). Continuous current (+0.02 to 0.5 μA) was passed through a customized head stage at 2 s intervals. To allow for anterograde transport, the slices were incubated in carbogen-bubbled normal ACSF for 3-4 h. They were subsequently placed in fixative at 4°C for 5 h and then transferred to 30% sucrose in PB at 4°C overnight. Fixed slices were resectioned and processed for immunohistochemistry, as described above. To verify that injections were confined to ICCls, every fourth or fifth section was labeled with calretinin or calbindin. Injections that resulted in labeling of cell bodies >600 μm distant to the lateral edge of immunolabeled ICC core were discarded before analysis.
Confocal imaging and digital processing. Imaging was performed on a Bio-Rad (Hercules, CA) Radiance 2100 laser-scanning confocal system attached to an Olympus (Tokyo, Japan) BX microscope. Unless specified, images were obtained at 60× magnification with an oil-immersion objective (Plan Apochromat; numerical aperture, 1.4; Olympus oil, refractive index 1.515). The confocal aperture was initially set at 1 airy unit and then reduced to adjust contrast and intensity to maximize use of the dynamic range (pixel intensities from 0 to 255, with minimal saturation). Image frame size was 1024 × 1024. Step size for z-stacks was 0.2 μm, resulting in voxel dimensions of 0.18, 0.18, and 0.2 μm (x, y, and z, respectively).
Confocal images were analyzed using Volocity 2.6 (Improvision, Coventry, UK). To determine point spread functions (PSFs), we used subresolution fluorescent beads (TetraSpeck; 0.1 μm diameter; Molecular Probes) (Table 1). For image stacks of isolated beads, the fluorescent intensity of the brightest pixel was determined, and PSFs were measured in the lateral and axial planes. To compare the appearance of beads in isolation versus beads embedded in tissue, a sample was prepared by perfusing a chick with a 1:100 dilution of fluorescent beads in normal ACSF, followed by fixative. The tectal lobes were processed for immunohistochemistry, except that primary and/or secondary antibodies were omitted. The full width at half-maximum of fluorescent intensity functions of tissue-embedded beads were not different from those obtained from tissue-free beads, and therefore, PSF data from both sources were pooled (Fig. 2 A, B). The PSF half-widths indicated that the imaging system performed near or at the theoretical limits for light microscopy (Hell, 2003).
Table 1.
Resolution of laser-scanning confocal microscope used in this study
| Fluorophore | Resolution (μm) |
FWHM (μm) |
||||
|---|---|---|---|---|---|---|
| λex/λem(nm) |
Lateral |
Axial |
Lateral |
Axial |
||
| TetraSpeck | 0.19 | 0.46 | 0.22 | 0.45 | ||
| 488/515 | ||||||
| TetraSpeck | 0.21 | 0.51 | 0.25 | 0.64 | ||
| 543/580 | ||||||
| TetraSpeck | 0.25 | 0.60 | 0.27 | 0.73 | ||
| 633/680 | ||||||
| Alexa Fluor 488 | 0.19 | 0.46 | Not measured | |||
| 488/519 | ||||||
| Rhodamine (micro-ruby) | 0.21 | 0.51 | Not measured | |||
| 543/580 | ||||||
| Alexa Fluor 647 | 0.24 | 0.60 | Not measured | |||
| 633/668 |
|
|
|
|
||
Resolution was calculated according to the following, which describe theoretical limits for confocal microscopy: lateral = (0.51 × λem)/NA, and axial = (0.88 × λex)/[n - (n2 - NA2)]½, where λem is the peak emission wavelength, λex is the laser excitation wavelength, n is the refractive index of medium, and NA is the numerical aperture of the microscope objective. FWHM, Full width at half-maximum.
Figure 2.

Optimization of image acquisition and processing. Point spread functions were obtained for subresolution fluorescent beads (0.1 μm diameter) with similar excitation/emission spectra to the fluorophores used in this study (see Table 1). A, Lateral fluorescence spread for point sources with emission peaks (in nanometers) at 515 (green), 580 (red), and 680 (blue). B, Axial extent of fluorescence spread for the same point sources. Insets, Representative examples of images that were used for measuring PSFs. C, Image of a monochromatic supraresolution bead (1μm diameter) before (left) and after (right) deconvolution. D, Image of four multicolor beads before (top) and after (bottom) deconvolution (10 iterations; 99.4% confidence interval). The true physical dimensions of the multicolor beads are shown in E. FWHM, full width at half-maximum. Scale bars: 1 μm. A 60×/1.4 oil-immersion objective was used.
Deconvolution was performed using measured PSFs and an iterative maximum entropy algorithm (Volocity Restoration; Improvision). To determine the number of iterations, we imaged supraresolution multicolor fluorescent beads (Fig. 2C-E). The spatial dimensions of the differently colored outer shell and inner core of the beads were known and provided a standard to evaluate the efficacy of deconvolution. The best results were obtained when the number of iterations was constrained by a confidence limit of 99.2%. When the same procedure was applied to images of labeled neuropil, it resulted in marginal improvements in spatial resolution with minimal loss of signal.
During three-dimensional (3D) analysis of the supraresolution beads, we noticed an unexpected, small spatial offset between color channels. Far-red bead cores appeared to be positioned slightly below the centers of the green/red outer beads. This could not have been attributable to a manufacturing artifact, because the spatial offset was consistently observed as a -z offset, whereas the beads were freely scattered in the samples. Color-dependent spatial offset was probably the result of imperfect correction of chromatic aberration by the objective. To correct for the offset before additional analysis, the top image from far-red image stacks was removed, and a blank image was inserted at the bottom of the stack.
To search for sites of putative synaptic contact (PSC) between tracer-labeled axons and CaMKIIα neurons, three-dimensional profiles were generated from confocal stacks using the high-resolution rendering mode. Isolated processes were inspected by fly-through visualization, during which both viewing angle and vantage point were freely adjustable (see Fig. 8 D, E). Boutons were identified as axonal swellings no longer than 3 μm, with a diameter at least 1.5 times greater than the diameter of the adjoining axon. Sites of contact between bouton and dendrite, identified by the presence of double-labeled voxels at their interface, were counted as PSCs.
Figure 8.
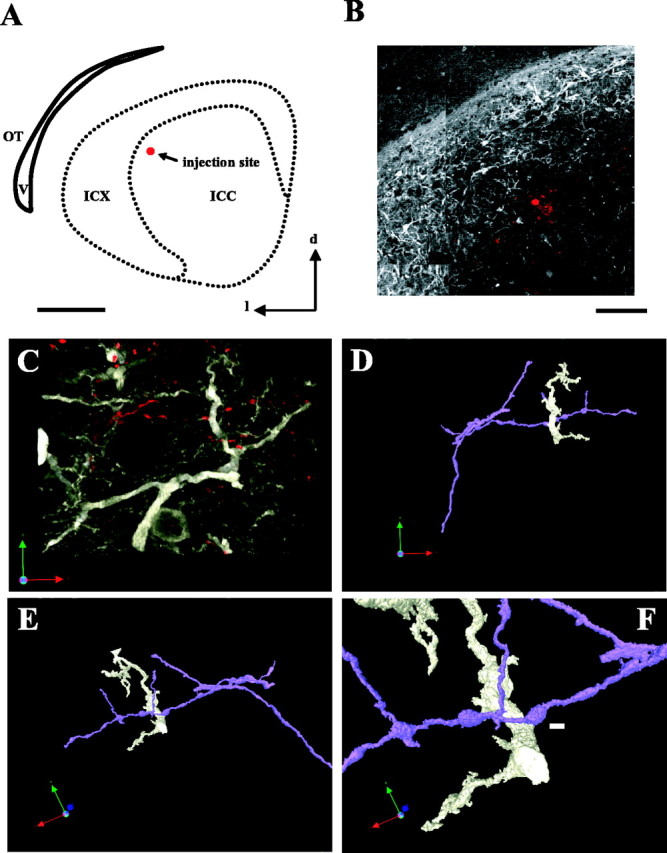
Labeling and visualization of axodendritic contacts onto CaMKIIα ICX neurons. A, Sketch of a coronal section used for anterograde tracing. Dotted line indicates borders of intense CaMKIIα staining. Red dot indicates injection site. Scale bar, 1000 μm. v, Ventral; l, lateral; d, dorsal. B, Close-up of raw image of tissue section diagrammed in A. The injection site is small and confined to ICCls. Scale bar, 300 μm. C, Deconvolved confocal image stack showing CaMKIIα cells in grayscale and ICCls axons in red. Sites of putative contact could not be reliably identified from this image. D, A portion of dendrite receiving a candidate contact is isolated and rendered in three dimensions. For clarity, the dendrite is shown in white, and the axon is shown in purple. E, The 3D volume is rotated around the candidate contact (fly-through visualization; Volocity). F, Close-up of candidate contact between axonal bouton and CaMKII dendrite. White scale bar, 2μm. No intervening space is visible at any rotation or zoom factor. Thus, the site is scored as a PSC.
To determine the interface thickness of supraresolution beads, the volume of overlap between inner core and outer shell was measured with the threshold set at 5% of maximum intensity for each color channel. The maximum radius of the sphere of colocalization (R) (see Fig. 11 A, gray area) was used to calculate the interface thickness, according to the following formula: interface thickness = R - 600 (in nm). This is the geometric equivalent of the interface bound by the arrows in Figure 1 A. To measure the interface thickness of PSCs, overlap was determined using the same threshold as that used for beads. Because this PSC interface volume was variable in shape and orientation, an automated procedure could not be readily developed to measure the relevant dimension. Instead, the interface plane between bouton and dendrite was determined by an observer by rotating the PSC in three dimensions, and the interface thickness was measured as the longest dimension of overlap orthogonal to the interface plane.
Figure 11.

Interface thickness of beads and PSCs. A, Diagram of the image of a multicolor bead. The physical interface between yellow inner core and red outer shell is denoted by the dotted line. The interface is the gray area of apparent overlap between the core and the shell and is attributable to point spread of light. The arrows denote interface thickness, which was measured as described in Materials and Methods. B, PSC interface is shown in white, bouton is shown in light gray, and dendrite is shown in dark gray. Transparency was adjusted in Photoshop for display purposes only. The interface thickness was measured orthogonal to the plane of contact (see Materials and Methods). C, Distribution of interface thicknesses for beads. The mean was 367 nm. D, Distribution of interface thicknesses for PSCs; 77% were equal to or larger than the criterion derived from bead measurements (dotted line).
ICCls-ICX projection fields were reconstructed by segmenting the ICX into small measurement zones (60 μm 2) for analysis. Within each zone, the number of boutons and PSCs were determined as described above. Total axonal length and surface area of CaMKII neuropil were measured using the skeletal length and surface tools, respectively, of Volocity. Regressions and statistical analyses were performed using Igor (WaveMetrics, Lake Oswego, OR) and StatView (SAS Institute, Cary, NC).
The degree of colocalization of GAD and CaMKIIα within individual neurons was determined by visual inspection. Automated analysis of the two labels did highlight small areas of apparent overlap but never a clear somatic or dendritic profile that expressed both proteins. The invariably small and variably shaped areas of apparent overlap could represent point spread of light from adjacent processes or the true colocalization of GAD and CaMKIIα in small, unidentifiable subcellular compartments. The degree of colocalization between retrogradely labeled cell bodies in ICX and CaMKIIα, calretinin, or AChE was also determined by visual inspection. A neuron was counted as double or triple labeled if the somatodendritic profile was clearly evident in each color channels. To verify complete separation of color channels, test images were acquired by saturating one or the other channel. No bleed-through was observed.
Soma size and number of primary dendrites of CaMKIIα and retrogradely labeled ICX neurons were determined using confocal image stacks acquired with a 25× objective. Soma size was measured as the area traced around the somata on the optical section in which the somata was largest. The number of primary dendrites was counted by panning through optical sections covering the entire volume of the cell. Primary dendrites were frequently observed to bifurcate very close to the cell body (within micrometers); these bifurcations were not counted as separate primary branches.
Some of the lower-power images shown were processed further, for display only, using Adobe Photoshop 6.5 (Adobe Systems, San Jose, CA).
Immunoelectron microscopy. Injections were made in slices in vitro, as described previously. After anterograde transport, slices were fixed in 4% paraformaldehyde and 0.5% glutaraldehyde in 0.1 m phosphate buffer for 5 h at 4°C, resectioned on a vibratome at 50-70 μm, and stored in 0.1 m phosphate buffer at 4°C. To visualize anterogradely labeled terminals and CaMKIIα immunoreactivity, sections were incubated in avidin- biotin complex (ABC kit; Vector Laboratories) and the mouse monoclonal antibody for CaMKIIα (1:1000) overnight at 4°C. After washing, sections were first reacted in DAB solution to visualize biocytin-labeled terminals. The labeled wet sections were immediately examined under a light microscope, and selected regions were processed for preembedding silver-enhanced immunogold staining. Briefly, sections were incubated in goat anti-mouse IgG covalently conjugated to the 1.4 nm gold particles (1:50; Nanoprobes, Yaphank, NY) for 2 h and then fixed in 1% glutaraldehyde for 10 min. Silver enhancement was conducted using HQ Silver kit (Nanoprobes) and following the instructions of the manufacturer. Typical time for silver enhancing was 4-6 min. Sections were washed thoroughly and processed for electron microscopy (EM).
Selected sections were osmicated in 1% OsO4 and dehydrated in a graded ethanol series and then flat embedded in Araldite, as described in detail previously (Liu et al., 1995; Liu and Jones, 2003). Serial thin sections at 70-80 nm were obtained using an ultramicrotome (Ultracut; Leica) and collected on Formvar-coated single-slot grids (Electron Microscopy Sciences, Washington Fort, PA). Grids were stained with uranyl acetate and lead citrate and examined in a Philips (Eindhoven, The Netherlands) CM120 electron microscope at 80 kV. Images were acquired by a 2000 × 2000 CCD camera (Gatan, Pleasanton, CA) and digitally processed (DigitalMicrograph; Gatan). Images were imported to Photoshop 6.5 for contrast adjustment and composition.
Results
CaMKIIα-expressing neurons mark the ICX
To identify molecular markers for distinct elements of ICX circuitry, we used immunohistochemistry to screen a number of commercially available antibodies raised against well conserved neuronal and synaptic proteins. An example of a section used for screening is shown in Figure 3A. We found that antibodies directed against rat CaMKIIα intensely labeled neurons in the inferior colliculus of juvenile and adult owls (14 of 14 owls) (Figs. 3, 4). Labeling was completely absent when the primary antibody was omitted (Fig. 3B). High-resolution imaging revealed that CaMKIIα labeling was localized to medium-large multipolar cells and was expressed throughout their somatodendritic architecture, including in distal dendrites (Fig. 3C) and occasionally in spines (see Figs. 8, 9, 10). Intense labeling of somata, dendrites, and spines was also observed throughout the OT, at the highest density within layer 10 (data not shown). The morphologies of the cells labeled in both structures indicated that they were neurons.
Figure 3.

CaMKIIα immunoreactivity in the sound-localization pathway. A, Horizontal section reacted with the CaMKIIα antibody and visualized using DAB. The box indicates the field of view shown in C. B, Adjacent section processed identically, except for the omission of the primary antibody. The borders of ICX and ICCls are indicated by dotted lines. V, Ventricle; R, rostral; L, lateral. Scale bar, 600 μm. C, Morphologies of CaMKIIα ICX cells (60× objective). D, Western blot of owl and rat brain homogenates probed with the CaMKIIα antibody. At high resolution, the owl band is clearly resolvable as a doublet and exhibits near identical mobility to the rat band of expected size (∼50 kDa). No other bands were evident.
Figure 4.

Regional distribution of CaMKIIα, calbindin, and calretinin. Horizontal sections through the IC reacted for calretinin (red), CaMKIIα (green), or calbindin (purple). A-C, Calretinin labeling at a dorsal, mid-dorsoventral, and ventral level through the inferior colliculus, respectively. Intense labeling delineates the ICC core. White line extends 600 μm lateral (l) to the core, corresponding to the boundary between ICCls and ICX. r, rostral. D-F, CaMKIIα labeling in adjacent sections from the same tectal lobe. The medial edge of CaMKIIα labeling closely corresponds with the measured boundary. CaMKIIα labeling is extensive in the rostrolateral ICX at mid-dorsoventral level (E) and also extends into ICCms at more dorsal and ventral levels (D and F, respectively). G-I, Calbindin labeling at similar dorsal, mid-dorsoventral, and ventral levels, taken from a different owl. Calbindin labels both ICC core (intensely) and ICX (more lightly). Scale bar: (in I) A-I, 1 mm. Images were obtained using a wide-field microscope (5× air objective). Very similar results were observed in all owls (n = 14 for CaMKIIα; n = 7 for double label).
Figure 9.

Near misses and multiple PSCs converging onto CaMKII ICX dendrites. A, Near miss between axon and dendrite. This site fails on two criteria: lack of bouton and lack of contact. B, Near miss between bouton and dendrite. This site fails based on lack of contact. One PSC was found between the same axon and dendrite (left side of main view). C, Multiple PSCs from different axons converge onto the same dendrite. Axons with distinct incoming trajectories are colored red, blue, and orange. D, Multiple PSCs from single axon contact a single dendrite. Note the presence of terminal boutons on axonal branchlets that do not contact CaMKII neuropil.
Figure 10.
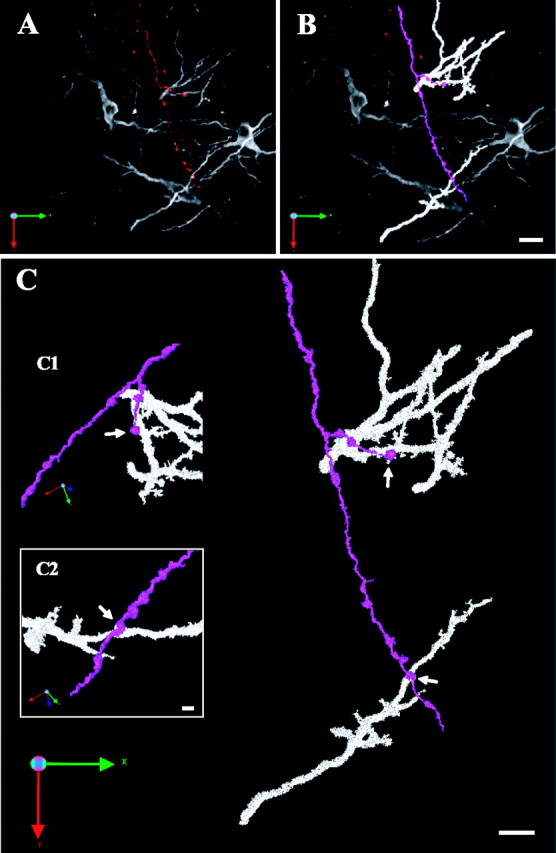
Local divergence in the ICCls-ICX projection. A, Raw image of ICCls axon (red) coursing past several CaMKII ICX neurons. B, Classified axon (blue) and dendrites from separate ICX neurons (white). C, High-magnification view of PSCs on each dendrite.
To identify the location of CaMKIIα+ neurons within the subdivisions of the IC, we compared the regional distribution of CaMKIIα labeling with that of the well established anatomical markers calretinin and calbindin. The results are shown in Figure 4. Calretinin antibodies intensely label the core of the ICCls, as well as a cloud of terminals surrounding it and a scattering of cell bodies and terminals in ICX. Previous studies established that the border between ICCls and the ICX is ∼600 μm lateral to the edge of the intensely labeled core region (Takahashi et al., 1987; Brainard and Knudsen, 1993). As shown in Figure 4E, this measured boundary closely corresponded with the edge of dense CaMKIIα labeling. CaMKIIα+ neurons were observed medial to the boundary, in ICCls, but the large majority was found lateral to it, within the ICX. The spatial density of CaMKIIα labeling was highest in lateral ICX, and labeling abruptly terminated at the interface between ICX and the superficial nucleus of the IC (ICS) (Figs. 3, 4). Sections through the dorsal or ventral IC revealed a similar pattern, with CaMKIIα neurons always localized to a narrow ring surrounding the ICCls. At the dorsal and ventral edges of the structure, this ring extended around both rostral and caudal poles (Fig. 4A,D,G and C,F,I, respectively). In total, the pattern of CaMKIIα labeling closely corresponded with the known boundaries of the ICX.
This regional localization suggested that CaMKIIα-expressing neurons are a cellular locus for assembly and plasticity of the ICX auditory space map. If this inference is correct, these cells should exhibit characteristic features of SSNs, which are excitatory output neurons that project to the deep layers of the OT, and which receive monosynaptic input from ICCls.
CaMKIIα ICX neurons do not express GAD
In mammalian cortex and thalamus, CaMKIIα is expressed exclusively in excitatory neurons (Liu and Jones, 1996; Liu and Jones, 1997). To determine whether this is true in ICX, we double labeled sections with antibodies specific for CaMKIIα and the GABAergic marker GAD65 (Fig. 5). Consistent with previous reports, GAD antibodies labeled a dense plexus of neuropil and small somata (Carr et al., 1989). Despite the high spatial density of both GAD and CaMKIIα labeling, we found no evidence that CaMKIIα profiles colabeled with GAD (three owls) (Fig. 5A-D). This indicated that CaMKIIα ICX neurons were not inhibitory. In contrast, calretinin or calbindin did sporadically colabel CaMKIIα neurons: 41% of the CaMKIIα ICX neurons examined were positive for calbindin, and 58% were positive for calretinin (Fig. 5E-H, left IC, and I-L, right IC, respectively). The results indicated that in the ICX, these calcium-binding proteins were not exclusively expressed in inhibitory cells.
Figure 5.
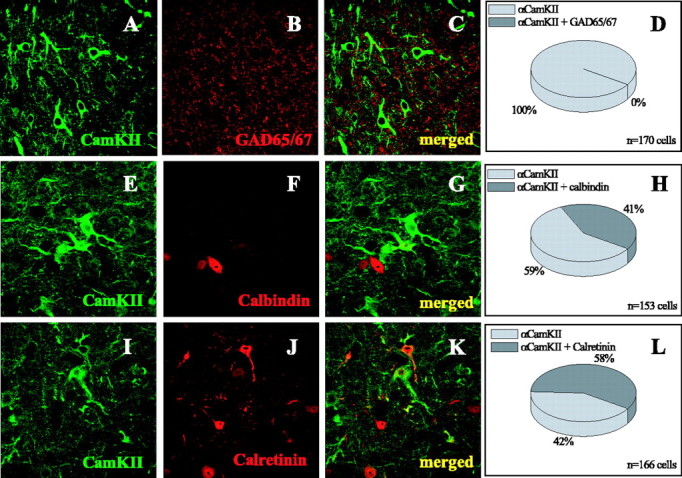
Coexpression of CaMKIIα with GAD65/67, calretinin, and calbindin. A-C, Single optical section (∼1 μm thick) from the ICX labeled with CaMKIIα (green) and GAD65/67 (red). CaMKIIα+ somata did not express GAD. E-G, Single optical section from the ICX labeled with CaMKIIα (green) and calbindin (red). Some somata were single labeled; others were double labeled. I-K, Single optical section from the ICX labeled with CaMKIIα (green) and calretinin (red). Some somata were single labeled; others were double labeled. D-L, Pie charts indicate the percentage of CaMKIIα cell bodies positive for CaMKIIα only (light gray) versus those also positive for GAD, calbindin, or calretinin.
CaMKIIα ICX neurons project to the OT
The lack of colabeling with GAD suggested that the CaMKIIα ICX cells were excitatory projection neurons. To test this, the neuronal tracer, micro-ruby, was injected into the deep layers of the OT, which receive input from the ICX (Fig. 6A) (injections were placed in vivo, four injections in three owls). Retrogradely labeled cells resulting from the injection were located primarily in the ICX, and to a lesser extent in ICS, medial to the tectal ventricle. The neurochemical identities of those located in the ICX were determined by colabeling for CaMKIIα, calretinin, or AChE. Across all experiments, 60% of the ICX-OT projection neurons were positive for CaMKIIα (142 of 235), 17% for calretinin (33 of 197), and 70% for AChE (60 of 85). Thus, a majority of CaMKIIα+ ICX neurons project to OT, consistent with CaMKIIα being expressed within SSNs.
Figure 6.
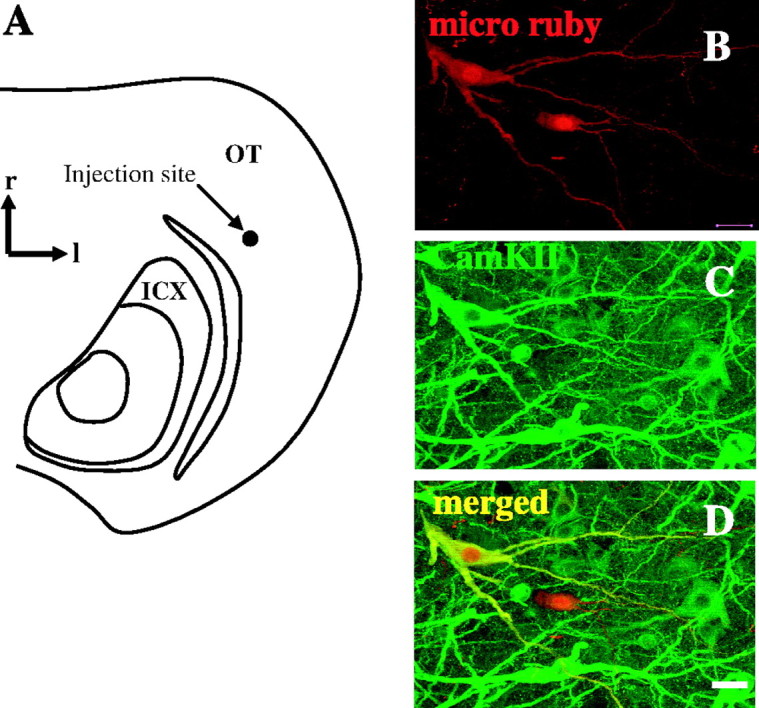
Retrograde labeling of ICX-OT projection neurons. A, Sketch of a horizontal section after in vivo injection of micro-ruby into the deep layers of the OT. Location of the injection site is indicated. r, Rostral; l, lateral. B, Retrogradely labeled cells located in the ICX. C, Labeling for CaMKIIα in the same section. D, Merged view, showing that one of the two retrogradely labeled cells expressed CaMKIIα; the other did not. All images shown here are collapsed confocal stacks, 10 μm in depth. Scale bar, 10 μm.
These results also raised the possibility that neurochemically and/or morphologically distinct subclasses of cells within ICX differentially project to the OT. To test this, we performed triple-labeling experiments. Retrogradely labeled ICX-OT projection neurons were stained for CaMKIIα and calretinin. Two morphological features of these cells were measured, soma size and number of primary dendrites. The distribution and covariance of these features for the entire retrogradely labeled population are shown in Figure 7B. ICX-OT projection neurons were morphologically diverse, ranging in size (from 33 to 655 μm) and number of primary dendrites (one to five). The overall distributions of these features were similar to those observed for a separate population of CaMKIIα+ ICX neurons (Fig. 7A), with the exception that a few very large (>600 μm soma size) projection neurons were observed outside the range of the CaMKII size distribution and that these cells were in fact CaMKII negative.
Figure 7.

Morphology and neurochemical identity of ICX-OT projection neurons. A, Relationship between soma size and number of primary dendrites for CaMKIIα ICX neurons (n=124). Dotted line is linear regression. The largest cells had, on average, one more primary dendrite than the smallest cells. B, Similar data plotted for four neurochemical classes of ICX-OT projection neurons (n = 128). Triangles, CaMKIIα+, calretinin+; circles, CaMKIIα+, calretinin-; +, CaMKIIα-, calretinin+; squares, CaMKIIα-, calretinin-. C, Prevalence of the four neurochemical classes within the ICX-OT projection. D, Mean number of primary dendrites (left) and soma size (right) for CaMKIIα ICX neurons (CaM), retrogradely labeled ICX-OT neurons (All), and the four neurochemical classes. C, CaMKIIα; r, calretinin. For these morphological features, no difference was observed between the neurochemical classes.
Of the four neurochemical subclasses of the ICX neurons that were discriminated in this set of experiments, all were found to project to the OT (Fig. 7B-D). However, one of these subclasses, cells that were negative for CaMKIIα but positive for calretinin, was rarely observed. These cells must not contribute substantially to the SSN population. In contrast, the other three subclasses did; 30% were positive for CaMKIIα only, another 30% were positive for CaMKIIα and calretinin, and 30% were negative for both. These results indicate that the ICX-OT projection neuron population is neurochemically diverse. Finally, there were no apparent differences in soma size or number of primary dendrites across these neurochemical subclasses (Fig. 7D). The absence of covariance between neurochemical and morphological features suggests that even neurochemically distinct cells in the ICX may engage a similar pattern of input and output connections and therefore may perform a similar function.
ICCls axonal boutons contact CaMKIIα ICX neurons
A second characteristic of SSNs is that they receive monosynaptic connections from ICCls. To determine whether ICCls axons synapse onto the dendrites of CaMKIIα ICX neurons, we developed methods for high-resolution confocal imaging and quantitative 3D image analysis. This novel high-throughput approach provided the tool needed to map out the precise spatial pattern of thousands of synaptic contacts distributed throughout millions of cubic micrometers of tissue.
The approach relied on high-quality labeling of both presynaptic and postsynaptic elements. To label ICCls axonal projections, focal injections of micro-ruby were made into the ICCls of in vitro slices (see Materials and Methods). The tracer was taken up by ICCls neurons and transported anterogradely into ICX. Figure 8 shows a representative example of a coronal section after tracer injection and processing for CaMKIIα labeling. The axons labeled by this method spread widely in ICX, consistent with a previous report that the ICCls-ICX projection is highly divergent in the dorsal-ventral dimension (Knudsen and Knudsen, 1983). At a high resolution, terminal fields were characterized by branched, bouton-studded axons, including en passant and terminal boutons (not shown). These axonal morphologies were qualitatively indistinguishable from those labeled by in vivo application of a related tracer, biocytin (DeBello et al., 2001).
To identify sites of putative synaptic contact between ICCls boutons and the dendrites of CaMKIIα ICX neurons, double-labeled neuropil was reconstructed in three dimensions (see Materials and Methods). Candidate contacts were analyzed by digitally isolating the individual dendritic and axonal branches from the plexus of neuropil (Fig. 8C,D). Sites of physical interface between bouton and dendrite were counted as putative synaptic contacts (Fig. 8F). This procedure effectively screened out a number of sites that initially appeared as candidate contacts, but ultimately failed to meet the criteria, referred to as “near misses” (Fig. 8A,B). Still, hundreds of PSCs onto CaMKIIα ICX neurons were observed (n = 1362 PSCs, sampled from four owls), almost of all of which were contacts onto dendritic shafts of variable caliber or onto somata. A small number of PSCs were observed onto spines.
The connections visualized by this method were profuse and included morphological profiles that reflected strong enervation, synaptic convergence, and synaptic divergence. In some cases, individual axons made multiple contacts onto a single CaMKIIα dendrite (Fig. 9 D). In others, axons with distinct trajectories converged onto the same dendrite (Fig. 9C). Overall, the number of PSCs per dendritic branch ranged from 1 to 14 (data not shown). Local divergence, in which an individual axon made contact with dendrites of two different ICX neurons, was also observed. (Fig. 10).
All PSCs exhibited a wedge of apparent colocalization, in which a cluster of voxels contained above-background signal from both color channels (Fig. 11B). We refer to this volume of apparent colocalization as the PSC interface. Two factors determined its size and contour. First, the point spread of light from discrete sources in direct physical contact will create an interface. To measure the size of this interface, we imaged supraresolution, synapse-sized multicolor beads (Fig. 11A) (n = 166 beads). The mean interface thickness observed was 367 nm (Fig. 11C). This result predicts that a synapse, in which presynaptic and postsynaptic compartments have been completely filled with two independent fluorophores, should exhibit an interface thickness of ∼350 nm (taking into account the thickness of the synaptic cleft, ∼20 nm). The distribution of interface thicknesses measured at a subset of PSCs is shown in Figure 11D (n = 166). Seventy-seven percent exhibited an interface thickness equal to or >350 nm, consistent with the expectation for true synaptic contacts.
A majority of PSCs exhibited an interface thickness significantly >350 nm. This can be accounted for by the presence of one of the fluorophores in both presynaptic and postsynaptic structures. There is no evidence that micro-ruby crosses the synaptic cleft. Therefore, this observation implied that CaMKIIα itself was present on both sides of the ICCls-ICX synapses. We tested this prediction using double-label immunoelectron microscopy.
Ultrastructure of synaptic contacts between ICCls boutons and CaMKII dendrites
The ultrastructure of CaMKIIα ICX neurons is shown in Figure 12. CaMKIIα immunoreactivity, revealed by silver-enhanced gold particles, was evident throughout the cytoplasm of medium-large neuronal cell bodies, proximal dendrites, and distal dendrites. It was mostly absent from cell nuclei (Fig. 12A). Tracer-labeled boutons emanating from ICCls, revealed by electron-dense peroxidase product, were found terminating onto dendrites labeled with CaMKIIα particles and also onto dendrites unreactive for CaMKIIα (Fig. 12B,C, respectively). Many tracer-labeled boutons were themselves immunopositive for CaMKIIα, and the colocalization could be traced in serial sections (Fig. 12D-F). Tracer-labeled and CaMKIIα-positive synaptic contacts were asymmetric type and therefore likely to be excitatory. In summary, the results obtained using double-label immunoelectron microscopy were consistent with those obtained using light-level microscopy.
Figure 12.
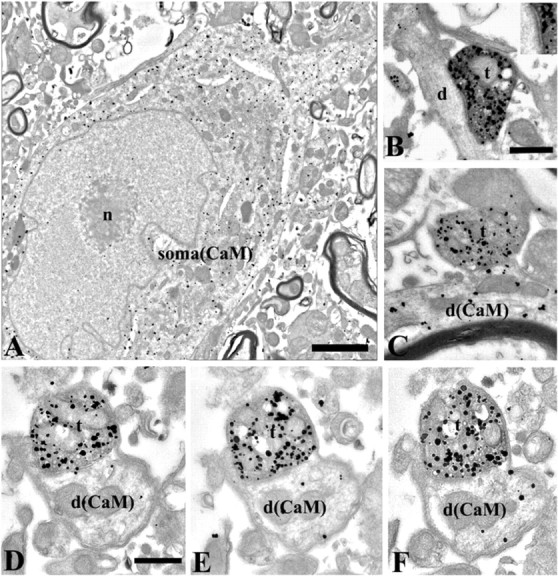
Ultrastructure of CaMKII ICX neurons and ICCls synapses. A, Low-power electron micrograph shows a soma and proximal dendrite labeled by silver-enhanced immunogold particles for CaMKII. Note that particles are evenly distributed within the cytoplasm and associated with subcellular organelles, such as Golgi apparatus and endoplasmic reticulum, but are excluded from the nucleus (n). Scale bar, 1 μm. B, A biocytin (electron-dense peroxidase reaction product) and CaMKII (silver-enhanced gold particles) double-labeled terminal (t) forming an asymmetrical synapse on a small CaMKII-negative dendritic shaft (d). The clear synaptic contact is shown at high magnification in the inset. C, A biocytin and CaMKII double-labeled terminal forming an asymmetrical synapse on a small CaMKII-immunopositive dendritic shaft [d(CaM)]. CaMKII-immunolabeled particles are distributed in the dendrite. D-F, Serial electron micrographs through a biocytin and CaMKII double-immunolabeled terminal forming an asymmetrical synapse on a CaMKII-labeled dendritic shaft. Particles labeled for CaMKII are consistently present in postsynaptic dendrite, shown in serial sections. Scale bars: B, D, 0.5 μm; B, inset, 0.1 μm.
Target selectivity in the ICCls-ICX projection
We asked whether the selectivity of ICCls boutons for synapsing onto CaMKIIα dendrites depended on their position of the boutons within the axonal arbor. Resolution of this issue required the reconstruction of circuitry across millions of cubic micrometers of tissue, and consequently, light-level methods were used.
The spatial pattern of four anatomical parameters as they vary with position across the ICX is shown in Figure 13A-D, which represents measurements made in a single coronal section. In this section, ICCls axons, boutons, and PSCs onto CaMKIIα ICX neurons were found >400 μm ventral to the level of the injection site (Fig. 13). Even greater anatomical spread was found dorsal to that level (data not shown). The patchy distribution of axons, boutons, PSCs and CaMKIIα neuropil reflected discontinuities inherent to the reconstruction of a single thin section. Still, the spatial pattern of PSCs was similar to the spatial pattern of boutons, suggesting that these anatomical parameters covaried. Data pooled across slices indicated that the number of PSCs covaried with the number of boutons, as shown in Figure 14A (n = 6998 boutons; n = 1362 PSCs; R2 = 0.759; p < 0.0001). Over more than an order of magnitude of bouton number, boutons exhibited similar preference for terminating onto CaMKIIα dendrites.
Figure 13.

Spatial distribution of ICCls axons, boutons, PSCs, and CaMKII neuropil. The pattern of labeling ventral and lateral to the site of injection of the coronal section shown in Figure 7A was reconstructed by tiling the ICX with measurement zones. Spatial maps were smoothed with a two-dimensional Gaussian filter. Whiter coloring indicates more labeling. Coordinates (0,0) indicate the site of injection. Spatial density of CaMKII labeling (A), total axonal length (B), number of tracer-labeled axonal boutons (C), and number of PSCs (D).
Figure 14.

Selectivity of ICCls axonal boutons for contacting CaMKII ICX neurons. A, Covariance plot of the number of boutons and the number of PSCs in each measurement zone (n = 63). B, Plot of number of boutons versus dorsoventral distance to the injection site. There is a modest decrease in the number of boutons at additional distances. C, CaMKII selectivity versus dorsoventral distance. Selectivity is constant over large distances. Lines are best fits to linear regression. For details, see Results.
CaMKIIα selectivity was defined as the proportion of ICCls boutons that formed PSCs with CaMKII dendrites. According to this metric, a value of 0.10 indicates that 10% of boutons synapsed onto CaMKIIα dendrites, whereas 90% synapsed onto unidentified targets. To directly determine whether CaMKIIα selectivity varied with position along the axonal arbor, we plotted selectivity versus distance ventral to the level of injection site. The data are shown in Figure 14C. Linear regression indicated that the correlation line was virtually horizontal (slope, -0.0035; n = 63; R2 = 0.006; p = 0.5691). Thus, there was no evidence that CaMKIIα selectivity varied with position along the axonal arbor. The magnitude of the constant CaMKIIα selectivity was determined by three methods, each of which gave similar results. The aggregate selectivity, corresponding to the ratio of the total number of PSCs to the total number of boutons was 0.19. The average selectivity, corresponding to the mean of selectivity in each zone, was 0.16 ± 0.01 SD, and the y intercept of the regression shown in Figure 14C was 0.17 ± 0.02 SD. In contrast to selectivity, the number of boutons did modestly decrease, on average, with distance from the injection site (Fig. 14B) (slope, -0.21; n = 63; R2 = 0.064; p < 0.0449). These results indicated that the ICCls axonal projection both provided input to a large dorsoventral extent of ICX and exhibited some topographic preference for connecting ICCls neurons to ICX neurons located at a similar dorsoventral level.
Discussion
We discovered that a subset of neurons in the barn owl IC strongly express CaMKIIα. These neurons are located in the ICX, project to the OT, do not express the inhibitory marker GAD, and receive divergent synaptic contacts from discrete sites within the ICCls. These traits indicate that CaMKIIα-expressing neurons are SSNs. In addition, we showed that ICCls boutons exhibit a selectivity for contacting CaMKIIα ICX neurons that is nearly constant across the ICCls axonal arbor. The discussion below addresses these findings and their implications for the assembly and plasticity of the auditory space map and provides a critical evaluation of the novel methods that were used to measure target selectivity.
CaMKIIα-expressing neurons are a major subclass of SSNs
The regional distribution of SSNs, derived from physiological surveys and the reconstruction of electrolytic lesions, and the regional extent of the ICX, determined by cytoarchitectonic standards, exhibit close correspondence (Brainard and Knudsen, 1993; Feldman and Knudsen, 1997; Gold and Knudsen, 2000). We found that CaMKIIα expression was mostly restricted to the ICX (Fig. 3), which raised the possibility that CaMKIIα is a neurochemical marker for a subclass of SSNs. One line of direct evidence in support of this conclusion is that CaMKIIα ICX neurons projected to the deep layers of the OT, the known major postsynaptic target of SSNs. In this role as principle outputs, CaMKIIα ICX neurons are likely excitatory, consistent with the observation that they lacked a GABAergic phenotype (Fig. 5). CaMKIIα-expressing neurons in cortex and hippocampus also serve as excitatory projection neurons.
Two disparities were observed between the spatial pattern of CaMKIIα labeling and the classically defined borders of the ICX: sparse CaMKIIα labeling extended into both the lateral and medial shells of the IC (Fig. 3). Neither location has been identified as a site for space-specific responses. One explanation is that CaMKIIα is expressed in a subset of IC neurons that is not SSNs. Another, nonexclusive explanation is that a subset of SSNs are located outside of the ICX. Exhaustive physiological surveys of the ICCls and the medial shell of the ICC (ICCms), in vivo intracellular fills and retrospective CaMKIIα labeling would be required to resolve this issue.
Two previous studies in which SSNs were labeled intracellularly revealed neuronal morphologies quite similar to those we observed, but with higher spine densities (not quantified in any of the studies) (Pena and Konishi, 2001; Nieder et al., 2003). In those studies, ICX neurons were labeled by intracellular injection, which reliably reveals spines because high concentrations of diffusible label are introduced into the dendrites. In contrast, the methods we used to label putative SSNs, in vivo retrograde tracing and immunohistochemistry, do not typically result in complete spine fills. That CaMKII labeling revealed a paucity of spines could indicate that, in these cells, the protein is more concentrated in dendritic shafts than spines. In summary, the inability to visualize spines on putative SSNs in the present study does not preclude their existence.
The molecular characterization of SSNs in owl IC has preceded parallel studies in mammals. A rich, species-specific organization of neurochemical modules in rat IC was described recently, although CaMKIIα was not part of the study (Chernock et al., 2004). Strong expression of CaMKIIα and its inhibitor peptide, CaMKIIN, has been reported in rat ICCls and the external cortex of the ICC, the ICCx (Benson et al., 1992; Chang et al., 2001). The relationship between any of these staining patterns and the cellular computation of sound location in mammals remains unclear. On the basis of physiological mapping and tracing experiments in ferrets, King and colleagues (Schnupp and King, 1997; King et al., 1998) have suggested that the analogous structure in mammals to owl ICX is not the ICCx but the nucleus of the brachium. Our results raise the possibility that CaMKII is expressed in excitatory output neurons in this nucleus.
Postsynaptic target selectivity of the ICCls-ICX projection
The second line of direct evidence that CaMKIIα ICX cells are SSNs, derived from both light-level and electron microscopy, is that a subset of ICCls boutons formed synapses with the dendrites of CaMKIIα ICX neurons. These synaptic profiles were asymmetric, and many ICCls boutons themselves expressed CaMKIIα, which, in mammalian systems, is a marker for a glutamatergic phenotype. Thus, the visualized ICCls-ICX connection appears to be excitatory, and likely underlies the rapid, sound-evoked excitation observed in vivo. These results represent the first direct visualization of contacts between identified presynaptic and postsynaptic elements in the owl midbrain.
The pattern of synaptic divergence within the ICCls-ICX projection has important implications for the construction of space-specific responses in the ICX. Within ICCls, neurons are tuned for binaural cues, interaural time difference (ITD) and interaural level difference (ILD), which, in barn owls, indicate the azimuth and elevation of a sound source (Moiseff and Konishi, 1981; Olsen et al., 1989). ITDs are encoded in frequency-specific laminas that are stacked in the dorsoventral dimension (Wagner et al., 1987). Divergence of the ICCls projection along this axis ensures that information from distinct laminas reaches many SSNs. Ensuing functional convergence is crucial for the resolution of spatial ambiguity inherent to frequency-specific ITDs and ILDs (Brainard et al., 1992; Pena and Konishi, 2002). The near-constant target selectivity we observed of ICCls boutons for CaMKIIα ICX neurons (Fig. 13) provides a conduit for information to SSNs for the integration of ITDs and ILDs across frequency.
Both light-level and EM results showed that ICCls boutons also formed synapses with targets unreactive for CaMKIIα. One major cell type in the ICX is small inhibitory neurons (Carr et al., 1989), and pharmacological experiments have demonstrated sound-evoked rapid inhibition in ICX (Fujita and Konishi, 1991). These data are consistent with a feedforward arrangement in which ICCls axons contact both excitatory and inhibitory cells (DeBello and Knudsen, 2001). We could not test this possibility, because labeling for the inhibitory markers GAD and GABA did not reveal extensive dendritic architecture.
In summary, our results represent the first demonstration of the expression of a particular protein within SSNs, which are themselves a crucial, functionally defined class of ICX neurons. The discovery of CaMKIIα as a marker should facilitate additional characterization of the molecular composition of SSNs, the cataloging of neurochemical subclasses within ICX, and the unraveling of their connectivity patterns.
Possible role of CaMKIIα in SSNs
The ICX is a major site for learning (Knudsen et al., 2000; Knudsen, 2002). When owls are raised wearing prismatic spectacles that horizontally displace the visual field, the spatial tuning of SSNs gradually recalibrates. This adaptive change restores alignment of the visual and auditory maps within the OT and, consequently, restores behavioral integrity. At a cellular level, adaptive plasticity involves changes in NMDA/AMPA expression (Feldman et al., 1996), GABAergic signaling (Zheng and Knudsen, 1999, 2001), and ICCls axonal morphology and synapse number (DeBello et al., 2001). The underlying molecular mechanisms are not understood.
CaMKII is a multifunctional protein kinase widely implicated in synaptic plasticity (for review, see Colbran and Brown, 2004). It is activated by synaptically induced changes in intracellular calcium levels. CaMKII is highly concentrated at the postsynaptic density, where it interacts with a number of proteins, including NMDA receptors. Postsynaptic CaMKII is required for NMDA receptor-dependent forms of long-term potentiation in hippocampus, neocortex, and spinal cord, hippocampal-dependent behaviors including spatial learning and memory, and for the stabilization of dendritic morphology in chick tectum. The role of presynaptic CaMKII is less well understood, but it has been implicated recently in regulating the frequency of miniature EP-SCs and the number of functional boutons in cultured hippocampal neurons (Ninan and Arancio, 2004).
Given the body of evidence that CaMKII plays a crucial role in neuronal plasticity, it is reasonable to speculate about its role in prism-induced adaptive plasticity. One possibility is that CaMKIIα serves as a link between the instructive signal that guides plasticity and the functional and structural remodeling that underlies adaptive reorganization within ICX. The instructive signal is visually based, originates in OT, and is relayed to ICX via a sparse, topographically organized projection (Hyde and Knudsen, 2000, 2002; Gutfreund et al., 2002). The cellular targets of this projection have not been identified. Activation of CaMKIIα by the instructive signal might trigger the known prism-induced changes in glutamate receptor expression, GABAergic signaling, axonal morphology, and synapse number.
Critical evaluation of light-level methods for the identification of PSCs
Synapse identification by light-level microscopy is fraught with pitfalls arising from the small size of synapses and the high spatial density of unlabeled, neighboring processes. In this study, we used morphological criteria for the identification of PSCs, physical contact between bouton and dendrite. Our results suggest a novel approach for improving the reliability of synapse identification, by establishing a criterion based on imaging physical models of synapses. Specifically, analysis of synapse-sized multicolor beads indicated that the width of apparent colocalization found at the interface of abutting objects is ∼370 nm (see Results). This value will vary with tissue preparation methods and across imaging systems. The value we found represents a lower limit on what can be achieved by conventional confocal microscopy, because the measured point spread functions were near the theoretical limits for the wavelengths of light used (Fig. 2). When we applied the 350 nm minimum interface-thickness criterion to PSCs, 77% passed, consistent with the expectation for true synaptic contacts.
What are the potential sources of false positives in the identification of PSCs? One possibility is that PSCs represent axodendritic contacts without a functional synapse. Correlative light-EM studies have established that a high proportion of tracer-labeled boutons do form synapses. We restricted our analysis to sites of bouton- dendrite contact and excluded sites of axodendrite crossing. In addition, the postsynaptic sides of PSCs expressed a known component of postsynaptic densities, CaMKIIα protein. Thus, PSCs exhibited both morphological and molecular hallmarks of synapses. Reliability of PSC identification might be improved by requiring the congregation of additional presynaptic and postsynaptic proteins. One additional advantage of that approach is the parsing of PSCs into neurochemical subclasses, for instance, ones that express predominantly NMDA versus AMPA receptors.
A second potential source of false positives is the expression of CaMKIIα protein in a thin process intervening between bouton and dendrite. In either case, an above minimum-sized interface might appear despite the absence of a true synapse. Unless the intervening CaMKIIα was highly localized to the site of false contact, the intervening process would be conspicuous from visual inspection, and the site could be excluded on this basis.
A third potential source is true colocalization of the two fluorescent labels. In fact, our EM results demonstrated the presence of CaMKIIα in presynaptic terminals as well as postsynaptic dendrites. Given this finding, false contacts would be expected to exhibit an intradendrite interface thickness of <350nm. However, we found that the majority of PSCs exhibited an intradendrite interface thickness of >350 nm (80%; analysis not shown), again consistent with the expectation for true synaptic contacts.
The novel light-level approach described here provides a high throughput method, compared with EM, for unraveling micro-circuits in the ICX and other brain regions. Because one expects that not all putative synaptic contacts correspond to functional synapses, the method is appropriate for circumscribing synaptic connectivity rather than precisely delineating it. Nonetheless, there is clear utility in a technique that can rapidly map the presynaptic and postsynaptic addresses of thousands of putative contacts. When coapplied with physiological measurements of synaptic activity, this method holds the potential to unlock a new level of microanatomical analysis.
Footnotes
This work was supported by a grant from the National Institute on Deafness and Other Communication Disorders, National Institutes of Health Grant R01 DC05640 (W.M.D.), and by a United Negro College Fund-Pfizer postdoctoral fellowship (A.R.-C.). We thank M. Burns for Western blotting, G. Nichols for technical assistance, and L. Chalupa, E. Jones, and E. Knudsen for comments on this manuscript.
Correspondence should be addressed to William M. DeBello, Center for Neuroscience, University of California, Davis, 1544 Newton Court, Davis, CA 95616. E-mail: wmdebello@ucdavis.edu.
A. Rodriguez-Contreras' present address: Department of Neuroscience, Erasmus Medical Center, Dr. Molewaterplein 50, NL-3015 GE Rotterdam, The Netherlands.
Copyright © 2005 Society for Neuroscience 0270-6474/05/255611-12$15.00/0
References
- Adolphs R (1993) Acetylcholinesterase staining differentiates functionally distinct auditory pathways in the barn owl. J Comp Neurol 329: 365-377. [DOI] [PubMed] [Google Scholar]
- Benson DL, Isackson PJ, Gall CM, Jones EG (1992) Contrasting patterns in the localization of glutamic acid decarboxylase and Ca2+/calmodulin protein kinase gene expression in the rat central nervous system. Neuroscience 46: 825-849. [DOI] [PubMed] [Google Scholar]
- Brainard MS, Knudsen EI (1993) Experience-dependent plasticity in the inferior colliculus: a site for visual calibration of the neural representation of auditory space in the barn owl. J Neurosci 13: 4589-4608. [DOI] [PMC free article] [PubMed] [Google Scholar]
- Brainard MS, Knudsen EI, Esterly SD (1992) Neural derivation of sound source location: resolution of spatial ambiguities in binaural cues. J Acoust Soc Am 91: 1015-1027. [DOI] [PubMed] [Google Scholar]
- Carr CE, Fujita I, Konishi M (1989) Distribution of GABAergic neurons and terminals in the auditory system of the barn owl. J Comp Neurol 286: 190-207. [DOI] [PubMed] [Google Scholar]
- Chang BH, Mukherji S, Soderling TR (2001) Calcium/calmodulin-dependent protein kinase II inhibitor protein: localization of isoforms in rat brain. Neuroscience 102: 767-777. [DOI] [PubMed] [Google Scholar]
- Chernock ML, Larue DT, Winer JA (2004) A periodic network of neurochemical modules in the inferior colliculus. Hear Res 188: 12-20. [DOI] [PubMed] [Google Scholar]
- Colbran RJ, Brown AM (2004) Calcium/calmodulin-dependent protein kinase II and synaptic plasticity. Curr Opin Neurobiol 14: 318-327. [DOI] [PubMed] [Google Scholar]
- DeBello WM, Knudsen EI (2001) Adaptive plasticity of the auditory space map. In: Toward a theory of neuroplasticity (Shaw CA, McEachern JC, eds), pp 13-30. Philadelphia: Psychology.
- DeBello WM, Knudsen EI (2004) Multiple sites of adaptive plasticity in the owl's auditory localization pathway. J Neurosci 24: 6853-6861. [DOI] [PMC free article] [PubMed] [Google Scholar]
- DeBello WM, Feldman DE, Knudsen EI (2001) Adaptive axonal remodeling in the midbrain auditory space map. J Neurosci 21: 3161-3174. [DOI] [PMC free article] [PubMed] [Google Scholar]
- Feldman DE, Knudsen EI (1997) An anatomical basis for visual calibration of the auditory space map in the barn owl's midbrain. J Neurosci 17: 6820-6837. [DOI] [PMC free article] [PubMed] [Google Scholar]
- Feldman DE, Brainard MS, Knudsen EI (1996) Newly learned auditory responses mediated by NMDA receptors in the rat inferior colliculus. Science 271: 525-528. [DOI] [PubMed] [Google Scholar]
- Fujita I, Konishi M (1991) The role of GABAergic inhibition in processing of interaural time difference in the owl's auditory system. J Neurosci 11: 722-739. [DOI] [PMC free article] [PubMed] [Google Scholar]
- Gold JI, Knudsen EI (2000) A site of auditory experience-dependent plasticity in the neural representation of auditory space in the barn owl's inferior colliculus. J Neurosci 20: 3469-3486. [DOI] [PMC free article] [PubMed] [Google Scholar]
- Gutfreund Y, Zheng W, Knudsen EI (2002) Gated visual input to the central auditory system. Science 297: 1556-1559. [DOI] [PubMed] [Google Scholar]
- Hell SW (2003) Toward fluorescence nanoscopy. Nat Biotechnol 21: 1347-1355. [DOI] [PubMed] [Google Scholar]
- Hyde PS, Knudsen EI (2000) Topographic projection from the optic tectum to the auditory space map in the inferior colliculus of the barn owl. J Comp Neurol 421: 146-160. [DOI] [PubMed] [Google Scholar]
- Hyde PS, Knudsen EI (2002) The optic tectum controls visually guided adaptive plasticity in the owl's auditory space map. Nature 415: 73-76. [DOI] [PubMed] [Google Scholar]
- King AJ, Jiang ZD, Moore DR (1998) Auditory brainstem projections to the ferret superior colliculus: anatomical contribution to the neural coding of sound azimuth. J Comp Neurol 390: 342-365. [PubMed] [Google Scholar]
- Knudsen EI (2002) Instructed learning in the auditory localization pathway of the barn owl. Nature 417: 322-328. [DOI] [PubMed] [Google Scholar]
- Knudsen EI, Knudsen PF (1983) Space-mapped auditory projections from the inferior colliculus to the optic tectum in the barn owl (Tyto alba). J Comp Neurol 218: 187-196. [DOI] [PubMed] [Google Scholar]
- Knudsen EI, Konishi M (1978) A neural map of auditory space in the owl. Science 200: 795-797. [DOI] [PubMed] [Google Scholar]
- Knudsen EI, Zheng W, DeBello WM (2000) Traces of learning in the auditory localization pathway. Proc Natl Acad Sci USA 97: 11815-11820. [DOI] [PMC free article] [PubMed] [Google Scholar]
- Konishi M (2003) Coding of auditory space. Annu Rev Neurosci 26: 31-55. [DOI] [PubMed] [Google Scholar]
- Levin MD, Kubke MF, Schneider M, Wenthold R, Carr CE (1997) Localization of AMPA-selective glutamate receptors in the auditory brainstem of the barn owl. J Comp Neurol 378: 239-253. [DOI] [PubMed] [Google Scholar]
- Liu X, Jones EG (1997) Alpha isoform of calcium-calmodulin dependent protein kinase II (CAM II kinase-alpha) restricted to excitatory synapses in the CA1 region of rat hippocampus. NeuroReport 8: 1475-1479. [DOI] [PubMed] [Google Scholar]
- Liu XB, Jones EG (1996) Localization of alpha type II calcium calmodulin-dependent protein kinase at glutamatergic but not gamma-aminobutyric acid (GABAergic) synapses in thalamus and cerebral cortex. Proc Natl Acad Sci USA 93: 7332-7336. [DOI] [PMC free article] [PubMed] [Google Scholar]
- Liu XB, Jones EG (2003) Fine structural localization of connexin-36 immunoreactivity in mouse cerebral cortex and thalamus. J Comp Neurol 466: 457-467. [DOI] [PubMed] [Google Scholar]
- Liu XB, Honda CN, Jones EG (1995) Distribution of four types of synapse on physiologically identified relay neurons in the ventral posterior thalamic nucleus of the cat. J Comp Neurol 352: 69-91. [DOI] [PubMed] [Google Scholar]
- Moiseff A, Konishi M (1981) Neuronal and behavioral sensitivity to binaural time differences in the owl. J Neurosci 1: 40-48. [DOI] [PMC free article] [PubMed] [Google Scholar]
- Nieder B, Wagner H, Luksch H (2003) Development of output connections from the inferior colliculus to the optic tectum in barn owls. J Comp Neurol 464: 511-524. [DOI] [PubMed] [Google Scholar]
- Ninan I, Arancio O (2004) Presynaptic CaMKII is necessary for synaptic plasticity in cultured hippocampal neurons. Neuron 42: 129-141. [DOI] [PubMed] [Google Scholar]
- Olsen JF, Knudsen EI, Esterly SD (1989) Neural maps of interaural time and intensity differences in the optic tectum of the barn owl. J Neurosci 9: 2591-2605. [DOI] [PMC free article] [PubMed] [Google Scholar]
- Pena JL, Konishi M (2001) Auditory spatial receptive fields created by multiplication. Science 292: 249-252. [DOI] [PubMed] [Google Scholar]
- Pena JL, Konishi M (2002) From postsynaptic potentials to spikes in the genesis of auditory spatial receptive fields. J Neurosci 22: 5652-5658. [DOI] [PMC free article] [PubMed] [Google Scholar]
- Rodriguez-Contreras A, DeBello WM (2002) Axonal localization of GABA-A receptor subunits in the barn owl inferior colliculus. Soc Neurosci Abstr 28: 845.5. [Google Scholar]
- Schnupp JW, King AJ (1997) Coding for auditory space in the nucleus of the brachium of the inferior colliculus in the ferret. J Neurophysiol 78: 2717-2731. [DOI] [PubMed] [Google Scholar]
- Takahashi TT, Carr CE, Brecha N, Konishi M (1987) Calcium binding protein-like immunoreactivity labels the terminal field of nucleus laminaris of the barn owl. J Neurosci 7: 1843-1856. [DOI] [PMC free article] [PubMed] [Google Scholar]
- Wagner H, Takahashi T, Konishi M (1987) Representation of interaural time difference in the central nucleus of the barn owl's inferior colliculus. J Neurosci 7: 3105-3116. [DOI] [PMC free article] [PubMed] [Google Scholar]
- Wagner H, Gunturkun O, Nieder B (2003) Anatomical markers for the subdivisions of the barn owl's inferior-collicular complex and adjacent peri- and subventricular structures. J Comp Neurol 465: 145-159. [DOI] [PubMed] [Google Scholar]
- Zheng W, Knudsen EI (1999) Functional selection of adaptive auditory space map by GABAA-mediated inhibition. Science 284: 962-965. [DOI] [PubMed] [Google Scholar]
- Zheng W, Knudsen EI (2001) GABAergic inhibition antagonizes adaptive adjustment of the owl's auditory space map during the initial phase of plasticity. J Neurosci 21: 4356-4365. [DOI] [PMC free article] [PubMed] [Google Scholar]