Abstract
A quantitative analysis of changes in the physiological status of bacterial cells is a fundamental type of study in microbiological research. We devised a method for measuring the viability of bacteria in the early stage of colony formation on a simulated natural environment. In this method, a solid medium containing soil extract was used, and the formation of bacterial microcolonies on a membrane filter was determined by use of a laser scanning cytometer combined with live-dead fluorescent dyes. A polychlorinated biphenyl degrader, Comamonas testosteroni TK102, was used in this study. Surprisingly, approximately 20% of the microcolonies had their growth stopped and eventually died. In the presence of biphenyl, the growth arrest was increased to 50%, and filamentous cells were observed in the colonies. Predicted intermediate metabolites of biphenyl were added to the medium to determine the relationship between the change of viability and the production of metabolites, and the addition of 2,3-dihydroxybiphenyl showed low viability. The arrest was not observed to occur on nutrient-rich medium, suggesting that the change in viability might occur in a nutrient-poor natural condition. The results of this study demonstrated that toxic metabolites of xenobiotics might change cell viability in the natural environment.
Recent studies of environmental microorganisms suggested that microbes play very important roles in keeping the natural environment clean by genome-wide metabolic networks (9, 29). For example, many microorganisms can degrade hazardous materials, such as polychlorinated biphenyls (PCBs) and polyaromatic hydrocarbons, in soil (1, 4, 12, 13, 26). This ability is regulated by many environmental factors, including the toxicity of pollutants, nutrient conditions, temperature, etc., and the physiological status is changed by these factors (15, 17, 37, 38). In this research, we focused on a method for detecting the viability of bacteria on a simulated natural environment (18). Determination of viability is the aim of many biological research studies (10, 20). The current technologies addressing this important issue have a limited range of application, and many different types of technologies are being developed to overcome this problem (5, 14, 21, 22, 23, 24, 33). There are, however, no approaches enabling accurate quantifications of the physiological changes of bacteria in the early stage on solid culture.
To assess the physiological status of bacterial cells, we developed a monitoring method using a laser scanning cytometer (LSC) (3, 19, 25, 31). This instrument combines the analytical capabilities of flow and image cytometry. The LSC scans samples on a glass slide to measure the fluorescence and positions of events, and these can be automatically relocated to provide visible observation with a microscope. We assessed the influence of biphenyl on the viability of the polychlorinated biphenyl degrader Comamonas testosteroni TK102 (16, 17, 36). In our previous study, it was suggested that the PCB degradation activity of strain TK102 was inhibited by the accumulation of toxic metabolites (36). Cells of strain TK102 were collected on a membrane filter and cultivated on solid agar containing soil extract with or without biphenyl. After the cells were stained with fluorescent dye, the viability of the individual cells in colonies was measured by cell fluorescence. Microscopic and cytometric analysis showed that many colonies stopped their growth during the very beginning of incubation with biphenyl.
MATERIALS AND METHODS
Bacterial strains and culture condition.
A PCB degrader, Comamonas testosteroni TK102, was used. TK102 was cultivated on a 1/3-diluted Luria-Bertani (1/3 LB) agar plate (3.3 g/liter tryptone, 1.6 g/liter yeast extract, 5 g/liter NaCl, 15 g/liter agar) at 30°C with phosphate-buffered minimal salt medium with biphenyl as the sole carbon source, as described previously (17). TK102 was also cultivated on a soil extract plate. The soil extract was prepared as follows.
A sandy loam soil was collected from a quadrangle of Okayama University, Japan. The 1:1 water-soil extract for making agar plates was prepared by mixing 1,000 g of air dried soil with 1,000 ml of distilled water and autoclaved at 121°C for 60 min. The mixture was centrifuged for 10 min at 7,000 × g, and the supernatant was filtrated by Whatman no. 2 filter paper (Whatman, Middlesex, United Kingdom). The filtrated extract was collected and diluted with distilled water to a total volume of 1,000 ml. To make agar plates, 1.5% of agar was added to the soil extract and the mixture was autoclaved at 121°C for 15 min.
Colony formation on the simulated natural environment.
C. testosteroni TK102 was cultivated on 1/3 LB plates at 30°C overnight. The cells were harvested by being scraped with a wire loop and were then suspended in 1 ml of sterilized phosphate-buffered saline (PBS) buffer (150 mM NaCl, 7.2 mM Na2HPO4, 2.8 mM NaH2PO4, pH 7.2). The suspensions were diluted with PBS to give a final cell concentration of approximately 103 cells/ml. One milliliter of the diluted cell suspension was filtered through a 0.2-μm-pore-size black-colored polycarbonate membrane filter (25 mm in diameter) (Toyo Roshi Kaisha, Tokyo, Japan). The membrane filters were soaked in distilled water and autoclaved at 121°C for 15 min before use. The filters with TK102 cells were then put on the soil extract plate and incubated for 3 to 21 h at 30°C.
Effect of biphenyl and its intermediate metabolites on colony growth of C. testosteroni TK102.
The filters described above were placed on the soil extract plates with or without vapor-phase biphenyl placed on the plate lid. Intermediate metabolites of biphenyl, which are 2-hydroxybiphenyl (2-OHBP), 3-hydroxybiphenyl (3-OHBP), 2,3-dihydroxybiphenyl (2,3-DHBP), and 2-hydroxy-6-oxo-6-phenylhexa-2,4-dienoic acid (HOPDA), were added into the soil extract medium to a final concentration of 25 or 50 μg/ml. All media contained 10 μg/ml of ascorbic acid to prevent the oxidation of substrates. The TK102 cells collected on the filters were placed on the soil extract plates with intermediate metabolites or 1/3 LB plates as a control and incubated at 30°C for 18 h. HOPDA was prepared as follows.
Analysis of biphenyl dose dependence.
C. testosteroni TK102 was cultivated on an agar plate of phosphate-buffered minimal salt medium containing 0.1% of disodium succinate at 30°C for 24 h. The cells were harvested, suspended in PBS, and collected on membrane filters as described above. The filters were placed on agar plates of minimal salt medium containing 0.1% of disodium succinate, 10 μg/ml of ascorbic acid, and biphenyl. Biphenyl was dissolved in ethanol and added to a final concentration of 10, 25, and 50 μg/ml. The agar plates were incubated at 30°C for 24 h.
Biosynthesis of HOPDA.
A plasmid carrying the 2,3-DHBP dioxygenase gene of TK102 was introduced into Escherichia coli strain MV1184 and used to make HOPDA from 2,3-DHBP. The transformant was cultivated in 200 ml of LB medium containing 100 μg/ml of ampicillin at 30°C overnight. The cells were harvested by centrifugation at 5,000 × g for 10 min at 4°C and washed three times with PBS. The washed cells were resuspended in 100 ml of PBS and divided into equal halves (27). Then, 2,3-DHBP was added to one-half volume of cell suspension to a final concentration of 500 μg/ml and incubated at 30°C for 30 min with shaking. After incubation, the remaining half of the suspension was added and incubated at 30°C. The reaction was monitored at 434 nm until no further increase in absorbance was observed. After the reaction was stopped, the suspension was centrifuged and the supernatant extracted three times with one-fifth volume of ethyl acetate under an acidic condition. The extract was evaporated to dryness and resuspended in ethanol. The solution was neutralized with sodium hydroxide, and the concentration of HOPDA was calculated by absorbance at 434 nm by using the extinction coefficient of 19.8 mM−1 cm−1 (34).
Staining and slide preparation.
Double staining with Oregon Green 488 carboxylic acid diacetate succinimidyl ester (carboxy-DFFDA SE) (Molecular Probes, Eugene, OR) and propidium iodide (PI) was performed to detect the viability of the cells in the colony. The incubated filter was floated on 150 μl of PBS containing 5 μM of carboxy-DFFDA SE and 4 μM of PI and incubated in the dark at 30°C for 30 min. After incubation, the filter was taken up from the stain solution, placed on a slide, and air dried. Immersion oil was then dropped on the filter, and a cover glass was placed on it.
Colony imaging.
Bacterial colonies were observed with a BX50 Olympus microscope equipped with a 100-W Hg lamp (Olympus, Tokyo, Japan). Charge-coupled-device (CCD) images were taken with an Olympus DP70 digital camera. A 470- to 490-nm band-pass filter and a 520- to 550-nm band-pass filter were used to excite carboxy-DFFDA SE and PI, respectively. The image of carboxy-DFFDA SE (green) was collected with a 510- to 550-nm band-pass filter and PI fluorescence (red) with a 580-nm interference filter. The green fluorescence image was superposed on the red fluorescence image by using DP Manager software (Olympus).
LSC analysis.
Fluorescence of individual colonies was measured by a laser scanning cytometer (LSC2; Olympus) equipped with a BX50 Olympus microscope. The slides were scanned by a 10-mW, 488-nm argon ion laser with a 10× lens objective. The green fluorescence from carboxy-DFFDA SE was measured using a 530/30-nm band-pass filter and amplified using a photomultiplier, and the red fluorescence from PI was measured using a 650-nm long-pass filter and amplified using a photomultiplier. The threshold level was set such that each colony was contoured above the background fluorescence. Cells exhibiting green and red fluorescence were collected from all colonies on the filter (at least 600 colonies). Gate T corresponds to tiny colonies which emit low green and red fluorescence; the percentage of events in the total colonies was calculated by use of WinCyte software (CompuCyte, Cambridge, MA). Gate G corresponds to growth colonies which emit high green and red fluorescence; the data collected from the signals of fluorescence intensities were converted to text files and analyzed by Microsoft Excel software to calculate the ratio of red integral of the colonies. All events detected by the LSC were checked with microscopic observation to verify whether these were colonies or not. All experiments were repeated three times.
RESULTS
Colony formation on the simulated natural environment.
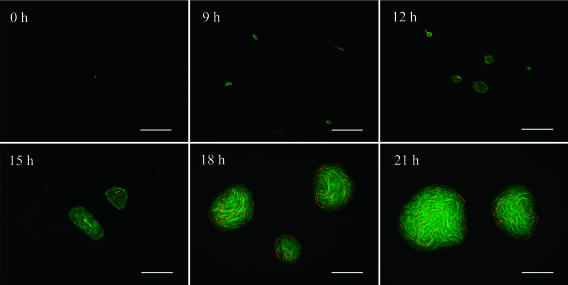
Figure 1 shows CCD images of the formation of microcolonies on the soil extract plate. The green fluorescence derived from Oregon Green 488 carboxy-DFFDA SE indicates the presence of live cells, and the red fluorescence derived from PI indicates the presence of dead ones. A single cell of TK102 began cell division and multiplied to the monolayer cells during 9 h of incubation. The monolayer cells gradually built up a multilayer microcolony after 15 h of incubation, and the microcolony became visible to the eye at 21 h of incubation, when the size of the colony was around 100 μm. The mature colonies showed yellow color, which derived from meta cleavage of a metabolite of biphenyl, suggesting that the colonies have biphenyl degradation activity.
FIG. 1.
CCD image of microcolony formation. Cells were stained with carboxy-DFFDA SE and PI. Bar, 50 μm.
Effect of biphenyl on colony growth of C. testosteroni TK102.
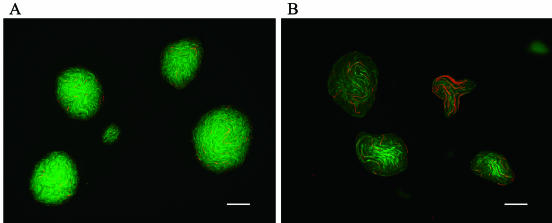
The change in morphology of mature colonies was observed with a fluorescent microscope with or without the addition of biphenyl at 21 h of incubation (Fig. 2A and B). Filamentous dead cells were clearly observed in mature colonies with biphenyl (Fig. 2B).
FIG. 2.
Physiological change upon addition of biphenyl. CCD images of 21 h of incubation were observed without (A) or with (B) biphenyl addition. Cells were stained with carboxy-DFFDA SE and PI. Bar, 50 μm.
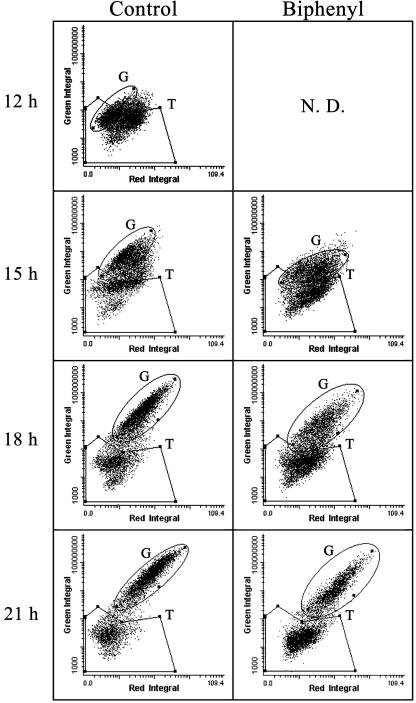
Figure 3 shows cytometric analysis at 12 to 21 h of incubation with or without biphenyl. The size of the colonies was approximately 10 μm at 12 h of incubation, and the cells were clustered in the region of low intensity of green and red fluorescence upon cytometric analysis (Fig. 3, gate T). They continuously multiplied into visibly detectable colonies, and the fluorescent integrals were increased (Fig. 3, gate G). After 21 h of incubation, however, tiny colonies in gate T were still detected by cytometric analysis (Fig. 3). The number of tiny colonies in gate T was higher upon biphenyl exposure than for the control experiment, while the green fluorescent integral of the growth colonies in gate T was lower upon biphenyl exposure (Fig. 3).
FIG. 3.
Scattergram of cytometric analysis from 12 to 21 h of incubation with or without biphenyl. Integrated values of fluorescence intensities from PI (x axes) and carboxy-DFFDA SE (y axes) were plotted. Two specified gates, gate T and gate G, are demarked areas and are described in Materials and Methods. The fluorescence of colonies incubated for 12 h with biphenyl could not be measured with an LSC because of the small size of the microcolonies and low intensity of fluorescence. N.D., not determined.
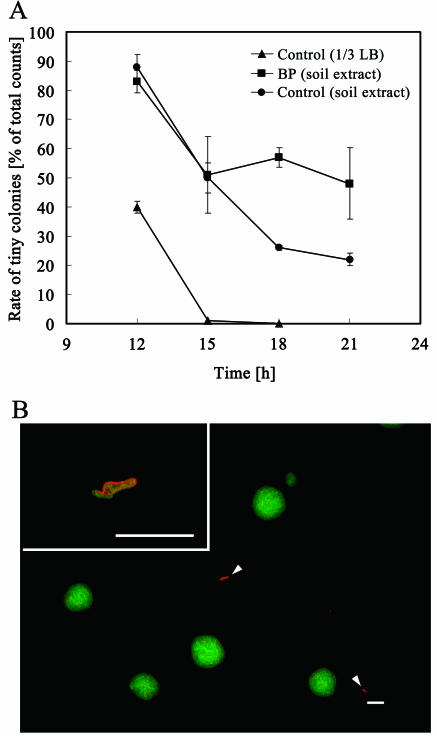
The percentage of tiny colonies, which was approximately 20% of the colonies, was not changed after 21 h of incubation on the soil extract plate without biphenyl (Fig. 4A). The cells in these small colonies became red fluorescence emitters, suggesting that the cells died at the monolayer stage (defined as the growth arrest of the microcolony). The dead colonies were composed of a few dead cells which exhibited filamentous morphology when observed by microscopy (Fig. 4B). In the presence of biphenyl, the growth arrest of microcolonies increased to about 50% from 15 h of incubation (Fig. 4A). A control experiment using 1/3-diluted LB did not show the growth arrest of the microcolonies (Fig. 4A).
FIG. 4.
Formation of tiny colonies. (A) The percentage of tiny colonies was calculated from dot plots, with the number of events in gated area T on Fig. 3 divided by the total events. Filters were incubated on solid agar containing soil extract with (▪) or without (•) biphenyl (BP) and 1/3-diluted LB (▴). Error bars represent standard deviations. (B) CCD image of typical growth-arrested colonies (highlighted by arrowheads and enlarged in inset). The colonies were cultivated on a soil extract plate for 21 h. Bar, 50 μm.
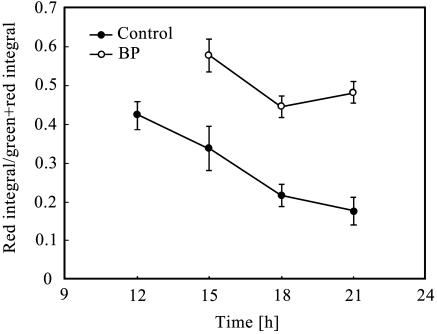
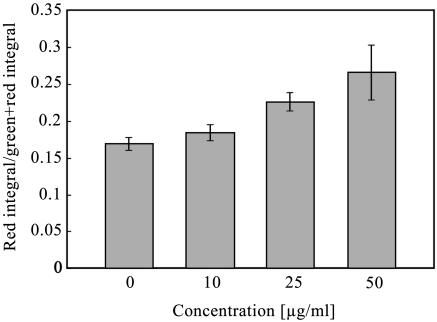
Figure 5 shows the ratio of dead cells (red fluorescent integral) in growth colonies. The ratio increased with the biphenyl exposure. Dependence of this ratio increase on level of biphenyl exposure was measured, and the result showed that the ratio of dead cells became higher due to the increase in biphenyl concentration (Fig. 6).
FIG. 5.
Ratio of red integral of the colonies. The ratio of red integral was measured by determining the intensities of the red and green signals on microcolonies at 21 h of incubation. The ratio at 12 h of incubation on biphenyl (BP) could not be calculated because of the small size of the microcolonies and low intensity of fluorescence.
FIG. 6.
Biphenyl dose dependence of ratio of red integral of the colonies. The ratio of red integral was measured by determining the intensities of the red and green signals on microcolonies at 24 h of incubation at different concentrations of biphenyl.
Effect of biphenyl metabolites on colony growth of C. testosteroni TK102.
The upper degradation pathway of biphenyl is a four-step process, with the initial oxygenase crucially responsible for recognition and binding of the substrate. The biphenyl 1,2-dioxygenase (BphA) initiates the process by inserting two atoms of oxygen at carbon positions 2 and 3 of the aromatic ring, and the resulting dihydrodiol is dehydrogenated by dihydrodiol dehydrogenase (BphB) to generate 2,3-dihyhydroxybiphenyl. The 2,3-dihyhydroxybiphenyl 1,2-dioxygenase (BphC) cleaves 2,3-dihydroxybiphenyl at the meta position to give HOPDA. This is hydrolyzed by HOPDA hydrolase (BphD) into 2-hydrodroxypenta-2,4-dienoate and benzoate.
To determine the relationship between the change of viability and the production of intermediate metabolites, strain TK102 was cultivated on soil extract agar plates with 2-OHBP, 3-OHBP, 2,3-DHBP, and HOPDA. Two monohydroxybiphenyls, 2-OHBP and 3-OHBP, were dehydrated by-products of dihydrodiol metabolite (17).
The percentage of dead cells in colonies increased 2.4-fold with the addition of 25 μg/ml of 2,3-DHBP, and the dead cells formed red filamentous morphology (data not shown). Growth of colonies was not observed with the addition of 50 μg/ml of 2,3-DHBP, and the addition of 50 μg/ml of 2-OHBP, 3-OHBP, and HOPDA did not result in marked increase of the dead cells, suggesting that the toxic effect of these metabolites is low.
DISCUSSION
In this study, we devised a method for evaluating the morphological and physiological changes of bacteria during the degradation of toxic compounds. We successfully stained cells in a colony and measured their fluorescence with an LSC. Growth-arrested microcolonies were observed when TK102 cells were cultivated on soil extract medium. The cells in these colonies formed a filamentous morphology and eventually died. Growth arrest at the monolayer stage suggests that the CFU may not reflect the number of bacterial cells in the original cell suspension. In our results, the formation of a colony on solid medium containing soil extract might have been interrupted in the beginning of cell division. Cell division might be interrupted by environmental or chemical factors, and filamentous cells were observed after the first or second cell division. When the cells were not damaged during the first cell division, live cells continued to multiply and build up microcolonies. Filamentous cells of TK102 were also observed with the addition of nalidixic acid, suggesting that the formation of filamentous cells may be caused by the inhibition of DNA synthesis (data not shown).
In general, a single cell initiates cell division on an agar plate and monolayer cells gradually form a microcolony, finally becoming a colony which can be observed by the naked eye (35). The steps involved in colony formation are similar to the those involved in initiation of biofilm formation, and a previous study showed that various environmental signals influence the initiation of biofilm formation (7, 28, 39). A recent study suggested that microcolony formation after the monolayer stage is thought to be important for mature biofilm formation and that dynamic attachment-deficient mutants showed biofilm-delayed characterization (32). Using our new method, physiological change during the early stage of colony formation could be estimated and change in viability during the building up of mature forms clarified.
Biphenyl increased the red fluorescence derived from dead cells in growth colonies. These data suggested that toxic compounds such as biphenyl may decrease not only CFU but also the viability of the cells in the colony. We also confirmed the toxicities of biphenyl intermediate metabolites to TK102. When 2,3-dihydroxybiphenyl was contained in medium, elongate cells were observed in the colony and the percentage of dead cells increased. Toxic metabolites of PCBs were also reported to cause the decrease of cell viability and lysis of cells (6). In our previous study, the monohydroxy by-products of biphenyl metabolism (2-hydroxybiphenyl and 3-hydroxybiphenyl) inhibited cell division, but the effect was not observed with 2,3-dihydroxybiphenyl (17). In this study, a change of viability in the early stage of colony formation was not observed with monohydroxy compounds. Recent papers suggested that the 2-phenyl-y′-chloro-1,4-benzoquinone derived from dihydroxy-PCBs forms DNA adducts (30, 41). These observations suggested that the decrease in viability could be caused by adducting paraquinone metabolites of biphenyl to the DNA molecule and that the adduction inhibits important gene expression. It should be noted that the arrest of colony formation of strain TK102 was not observed when cultivated on 1/3-diluted LB (Fig. 3A). A soil isolate, Pseudomonas putida PpY101 (a derivative of P. putida mt2) (11), grown on a soil extract plate also showed growth arrest (3.5% of the original cells), suggesting that this phenomenon occurs in a natural environment to some extent. A toxic effect may not be detected by the nutrient-rich medium on which bacteria readily grow. This result also suggests that the change in viability may not be detectable on nutrient medium. The factors affecting bacterial viability in nature will be selectively estimated by cultivation in a simulated natural condition in a future study.
A huge number of microorganisms live in the natural habitat. Almost none of them could be cultured on nutrient medium (2). Some of them, however, were found to form microcolonies, but no growth of these microcolonies was seen. Some proof has been obtained in recent studies showing that the culturability of soil bacteria can be increased by using media which simulate the natural environment (2, 8, 18, 40). In our study, the monolayer stage of microcolonies was found to be important for forming mature colonies, and toxic metabolites of hazardous materials may change the viability of the bacteria in the very early stage of colony formation. This result also suggests that physiological changes to bacteria might occur in a natural habitat and that cell division was inhibited.
In conclusion, physiological changes in bacterial cells at the beginning of colony formation are very important for bacterial life in the natural environment. This type of change was caused at a subtoxic level, and the effect was not observed to occur in all cells. The reason for the differences in the effects is still unknown, but analyzing the physiological change in the very early stage of multiplication may be a new avenue for understanding bacterial life.
Acknowledgments
This work was performed as one of the technology development projects of the “Green Biotechnology Program” supported by NEDO (New Energy and Industrial Technology Development Organization).
REFERENCES
- 1.Ahmed, M., and D. D. Focht. 1973. Degradation of polychlorinated biphenyls by two species of Achromobacter. Can. J. Microbiol. 19:47-52. [DOI] [PubMed] [Google Scholar]
- 2.Barer, M. R., and C. R. Harwood. 1999. Bacterial viability and culturability. Adv. Microb. Physiol. 41:93-137. [DOI] [PubMed] [Google Scholar]
- 3.Baudart, J., A. Olaizola, J. Coallier, V. Gauthier, and P. Laurent. 2005. Assessment of a new technique combining a viability test, whole cell hybridization and laser-scanning cytometry for the direct counting of viable Enterobacteriaceae cells in drinking water. FEMS Microbiol. Lett. 243:405-409. [DOI] [PubMed] [Google Scholar]
- 4.Bedard, D. L., M. L. Haberl, R. J. May, and M. J. Brennan. 1987. Evidence for novel mechanism of polychlorinated biphenyl metabolism in Alcaligenes eutrophus H850. Appl. Environ. Microbiol. 53:1103-1112. [DOI] [PMC free article] [PubMed] [Google Scholar]
- 5.Brehm-Stecher, B. F., and E. A. Johnson. 2004. Single-cell microbiology: tools, technologies, and applications. Microbiol. Mol. Biol. Rev. 68:538-559. [DOI] [PMC free article] [PubMed] [Google Scholar]
- 6.Camara, B., C. Herrera, M. Gonzalez, E. Couve, B. Hofer, and M. Seeger. 2004. From PCBs to highly toxic metabolites by the biphenyl pathway. Environ. Microbiol. 6:842-850. [DOI] [PubMed] [Google Scholar]
- 7.Davey, M. E., and G. A. O'Toole. 2000. Microbial biofilms: from ecology to molecular genetics. Microbiol. Mol. Biol. Rev. 64:847-867. [DOI] [PMC free article] [PubMed] [Google Scholar]
- 8.Davis, K. E. R., S. J. Joseph, and P. H. Janssen. 2005. Effects of growth medium, inoculum size, and incubation time on culturability and isolation of soil bacteria. Appl. Environ. Microbiol. 71:826-834. [DOI] [PMC free article] [PubMed] [Google Scholar]
- 9.Denef, V. J., J. Park, T. V. Tsoi, J. M. Rouillard, H. Zhang, J. A. Wibbenmeyer, W. Verstraete, E. Gulari, S. A. Hashsham, and J. M. Tiedje. 2004. Biphenyl and benzoate metabolism in a genomic context: outlining genome-wide metabolic networks in Burkholderia xenovorans LB400. Appl. Environ. Microbiol. 70:4961-4970. [DOI] [PMC free article] [PubMed] [Google Scholar]
- 10.Entcheva-Dimitrov, P., and A. M. Spormann. 2004. Dynamics and control of biofilms of the oligotrophic bacterium Caulobacter crescentus. J. Bacteriol. 186:8254-8266. [DOI] [PMC free article] [PubMed] [Google Scholar]
- 11.Fukuda, M., and K. Yano. 1985. Construction of broad host range vectors for Gram-negative bacteria. Agric. Biol. Chem. 49:2719-2724. [Google Scholar]
- 12.Furukawa, K., N. Tomizawa, and A. Kamibayashi. 1979. Effect of chlorine substitution on the bacterial metabolism of various polychlorinated biphenyls. Appl. Environ. Microbiol. 38:301-310. [DOI] [PMC free article] [PubMed] [Google Scholar]
- 13.Harkness, M. R., J. B. McDermott, D. A. Abramowicz, J. J. Salvo, W. P. Flanagan, M. L. Stephens, F. J. Mondello, R. J. May, J. H. Lobos, K. M. Carroll, M. J. Brennan, A. A. Bracco, K. M. Fish, G. L. Warner, P. R. Wilson, D. K. Dietrich, D. T. Lin, C. B. Morgan, and W. L. Gately. 1993. In situ stimulation of aerobic PCB degradation in Hudson River sediments. Science 259:503-507. [DOI] [PubMed] [Google Scholar]
- 14.Heim, S., M. D. M. Lleo, B. Bonato, C. A. Guzman, and P. Canepari. 2002. The viable but nonculturable state and starvation are different stress responses of Enterococcus faecalis, as determined by proteome analysis. J. Bacteriol. 184:6739-6745. [DOI] [PMC free article] [PubMed] [Google Scholar]
- 15.Heipieper, H. J., F. J. Weber, J. Sikkema, H. Keweloh, and J. A. M. de Bont. 1994. Mechanism of resistance of whole cells to toxic organic solvents. Trends Biotechnol. 12:409-415. [Google Scholar]
- 16.Hiraoka, Y., and K. Kimbara. 2002. Rapid assessment of the physiological status of the polychlorinated biphenyl degrader Comamonas testosteroni TK102 by flow cytometry. Appl. Environ. Microbiol. 68:2031-2035. [DOI] [PMC free article] [PubMed] [Google Scholar]
- 17.Hiraoka, Y., T. Yamada, K. Tone, Y. Futaesaku, and K. Kimbara. 2002. Flow cytometry analysis of changes in the DNA content of the polychlorinated biphenyl degrader Comamonas testosteroni TK102: effect of metabolites on cell-cell separation. Appl. Environ. Microbiol. 68:5104-5112. [DOI] [PMC free article] [PubMed] [Google Scholar]
- 18.Kaeberlein, T., K. Lewis, and S. S. Epstein. 2002. Isolating “uncultivable” microorganisms in pure culture in a simulated natural environment. Science 296:1127-1129. [DOI] [PubMed] [Google Scholar]
- 19.Kamentsky, L. A., and L. D. Kamentsky. 1991. Microscope-based multiparameter laser scanning cytometer yielding data comparable to flow cytometry data. Cytometry 12:381-387. [DOI] [PubMed] [Google Scholar]
- 20.Koch, A. L. 1997. Microbial physiology and ecology of slow growth. Microbiol. Mol. Biol. Rev. 61:305-318. [DOI] [PMC free article] [PubMed] [Google Scholar]
- 21.Lisle, J. T., M. A. Hamilton, A. R. Willse, and G. A. McFeters. 2004. Comparison of fluorescence microscopy and solid-phase cytometry methods for counting bacteria in water. Appl. Environ. Microbiol. 70:5343-5348. [DOI] [PMC free article] [PubMed] [Google Scholar]
- 22.Lu, Y., T. Lueders, M. W. Friedrich, and R. Conrad. 2005. Detecting active methanogenic populations on rice roots using stable isotope probing. Environ. Microbiol. 7:326-336. [DOI] [PubMed] [Google Scholar]
- 23.Lunau, M., A. Lemke, K. Walther, W. Martens-Habbena, and M. Simon. 2005. An improved method for counting bacteria from sediments and turbid environments by epifluorescence microscopy. Environ. Microbiol. 7:961-968. [DOI] [PubMed] [Google Scholar]
- 24.Michalet, X., F. F. Pinaud, L. A. Bentolila, J. M. Tsay, S. Doose, J. J. Li, G. Sundaresan, A. M. Wu, S. S. Gambhir, and S. Weiss. 2005. Quantum dots for live cells, in vivo imaging, and diagnostics. Science 307:538-544. [DOI] [PMC free article] [PubMed] [Google Scholar]
- 25.Mignon-Godefroy, K., J. G. Guillet, and C. Butor. 1997. Solid phase cytometry for detection of rare events. Cytometry 27:336-344. [PubMed] [Google Scholar]
- 26.Miyazawa, D., G. Mukerjee-Dhar, M. Shimura, T. Hatta, and K. Kimbara. 2004. Genes for Mn(II)-dependent NahC and Fe(II)-dependent NahH located in close proximity in the thermophilic naphthalene and PCB degrader, Bacillus sp. JF8: cloning and characterization. Microbiology 150:993-1004. [DOI] [PubMed] [Google Scholar]
- 27.Ohtsubo, Y., Y. Nagata, K. Kimbara, M. Takagi, and A. Ohta. 2000. Expression of the bph genes involved in biphenyl/PCB degradation in Pseudomonas sp. KKS102 induced by the biphenyl degradation intermediate, 2-hydroxy-6-oxo-6-phenylhexa-2,4-dienoic acid. Gene 256:223-228. [DOI] [PubMed] [Google Scholar]
- 28.O'Toole, G. A., and R. Kolter. 1998. Initiation of biofilm formation in Pseudomonas fluorescens WCS365 proceeds via multiple, convergent signaling pathways: a genetic analysis. Mol. Microbiol. 28:449-461. [DOI] [PubMed] [Google Scholar]
- 29.Pazos, F., A. Valencia, and V. De Lorenzo. 2003. The organization of the microbial biodegradation network from a systems-biology perspective. EMBO Rep. 4:994-999. [DOI] [PMC free article] [PubMed] [Google Scholar]
- 30.Pereg, D., L. W. Robertson, and R. C. Guputa. 2002. DNA adduction by polychlorinated biphenyls: adducts derived from hepatic microsomal activation and from synthetic metabolites. Chem.-Biol. Interact. 139:129-144. [DOI] [PubMed] [Google Scholar]
- 31.Pina-Vaz, C., S. Costa-Oliveria, A. G. Rodrigues, and A. Salvador. 2004. Novel method using a laser scanning cytometer for detection of Mycobacteria in clinical samples. J. Clin. Microbiol. 42:906-908. [DOI] [PMC free article] [PubMed] [Google Scholar]
- 32.Ramsey, M. M., and M. Whiteley. 2004. Pseudomonas aeruginosa attachment and biofilm development in dynamic environments. Mol. Microbiol. 53:1075-1087. [DOI] [PubMed] [Google Scholar]
- 33.Rudi, K., B. Moen, S. M. Dromtorp, and A. L. Hock. 2005. Use of ethidium monoazide and PCR in combination for quantification of viable and dead cells in complex samples. Appl. Environ. Microbiol. 71:1018-1024. [DOI] [PMC free article] [PubMed] [Google Scholar]
- 34.Seah, S. Y. K., G. Terracina, J. T. Bolin, P. Riebel, V. Snieckus, and L. D. Eltis. 1998. Purification and preliminary characterization of a serine hydrolase involved in the microbial degradation of polychlorinated biphenyls. J. Biol. Chem. 273:22943-22949. [DOI] [PubMed] [Google Scholar]
- 35.Shapiro, J. A. 1998. Thinking about bacterial populations as multicellular organisms. Annu. Rev. Microbiol. 52:81-104. [DOI] [PubMed] [Google Scholar]
- 36.Shimura, M., T. Hayakawa, G. Mukerjee-Dhar, M. Fukuda, and K. Kimbara. 1998. Characterization of polychlorinated biphenyl degradation in a fermentor by Comamonas testosteroni strain TK102. Jpn. J. Water Treat. Biol. 34:57-65. [Google Scholar]
- 37.Sikkema, J., J. A. M. de Bont, and B. Poolman. 1995. Mechanisms of membrane toxicity of hydrocarbons. Microbiol. Rev. 59:201-222. [DOI] [PMC free article] [PubMed] [Google Scholar]
- 38.Stanley, N. R., and B. A. Lazazzera. 2004. Environmental signals and regulatory pathways that influence biofilm formation. Mol. Microbiol. 52:917-924. [DOI] [PubMed] [Google Scholar]
- 39.Whiteley, M., M. G. Bangera, R. E. Bumgarner, M. R. Parsek, G. M. Teitzel, S. Lory, and E. P. Greenberg. 2001. Gene expression in Pseudomonas aeruginosa biofilms. Nature 413:860-864. [DOI] [PubMed] [Google Scholar]
- 40.Zengler, K., G. Toledo, M. Rappe, J. Elkins, E. J. Mathur, J. M. Short, and M. Keller. 2002. Cultivating the uncultured. Proc. Natl. Acad. Sci. USA 99:15681-15686. [DOI] [PMC free article] [PubMed] [Google Scholar]
- 41.Zhao, S., A. Narang, X. Ding, and G. Eadon. 2004. Characterization and quantitative analysis of DNA adducts formed from lower chlorinated PCB-derived quinones. Chem. Res. Toxicol. 17:502-511. [DOI] [PubMed] [Google Scholar]


