

Abstract
Members of the Planctomycetes, which were once thought to occur primarily in aquatic environments, have been discovered in soils on five continents, revealing that these Bacteria are a widespread and numerically abundant component of microbial communities in soil. We examined the diversity of Planctomycetes in soil samples obtained from experimental plots at an agricultural site in order to assess the extent of Planctomycetes diversity in soil, to determine whether management effects such as past land cover and compost addition affected the composition of the Planctomycetes community, and to determine whether the observations made could provide insight into the ecological distribution of these organisms. Analysis of Planctomycetes 16S rRNA gene sequences revealed a total of 312 ± 35 unique phylotypes in the soil at the site examined. The majority of these Planctomycetes sequences were unique, and the sequences had phylogenetic affiliations that included all major lineages in the Planctomycetaceae, as well as several novel groups of deeply divergent Planctomycetes. Both soil management history and compost amendment had significant effects on the Planctomycetes diversity, and variations in soil organic matter, Ca2+ content, and pH were associated with variations in the Planctomycetes community composition. In addition, Planctomycetes richness increased in proportion to the area sampled and was correlated with the spatial heterogeneity of nitrate, which was associated with the soil management history at the orchard site examined. This report provides the first systematic assessment of the diversity of Planctomycetes in soil and also provides evidence that the diversity of this group increases with area as defined by the general power law description of the taxon-area relationship.
The Planctomycetes are a widespread and numerically abundant microbial group that represents one of the main lines of descent in the domain Bacteria (62). Prior to their discovery in an Australian soil in 1992 (35), members of the Planctomycetes were thought to occur primarily in aquatic environments. Since then, Planctomycetes have been found in bacterial 16S rRNA libraries generated from an array of soils on five continents and from a range of habitats, including cultivated, pasture, forest, tundra, and even thermal soils (2, 6, 7, 9, 14, 15, 33, 35, 46, 56, 65-67). Fluorescent in situ hybridization with Planctomycetes-specific probes has revealed that Planctomycetes account for between 4% and 7% of the cells in agricultural and forest soils (9, 65). Planctomycetes also account for 7% ± 5% of the total rRNA extracted from agricultural soils, and their rRNA abundance was second only to that of the alpha-Proteobacteria in a survey that included eight of the main lines of bacterial descent (8). Using an estimate of 7% rRNA abundance for Planctomycetes in arable soils and the estimates of Whitman et al. (64) for the total number of microorganisms in such soils, the global population of Planctomycetes in arable soils may be 1.8 × 1028 cells. Despite their abundance in the biosphere, very little is known about the ecological significance of these organisms or about the environmental factors that affect their diversity and abundance in soil.
Our understanding of Planctomycetes is limited by the fact that only a few these organisms have been characterized sufficiently to permit formal classification and by the fact that more than 92% of the 1,344 Planctomycetes 16S rRNA gene sequences currently archived in Ribosomal Database Project II, release 9.0, are sequences from noncultivated organisms (12). What we know of the few species that have been described has revealed that Planctomycetes have a range of unusual characteristics that set them apart from other Bacteria (62). For example, the Planctomycetes form one of the only bacterial groups that lack peptidoglycan in their cell walls (62), they divide by budding, they can have various forms of cellular compartmentalization (22, 36, 37), their genomes tend to be large (52), and their lipid profiles have many similarities to those of eukaryotic taxa (22, 48). Most of the isolates that have been obtained are slowly growing, aerobic or facultative chemoorganotrophs that specialize in carbohydrate metabolism (22, 48, 62), but there is evidence that the metabolic capability of this group is much more diverse than is indicated by its cultivated representatives. For example, a deeply divergent lineage within the Planctomycetes has been shown to be capable of chemolithoautotrophic growth through anaerobic oxidation of ammonium (58). Certain Planctomycetes have also been shown to contain genes in the tetrahydromethanopterin-linked C1 transfer pathway (3, 10, 28, 29), suggesting the potential for methylotrophy in members of this group. Another interesting observation is that terminal restriction fragment length polymorphism analysis of 16S rRNA genes from rice soil revealed that the Planctomycetes diversity is higher in anoxic bulk soil than in the oxic rhizosphere (15), suggesting that changes in soil oxygen distribution affect the Planctomycetes community.
The remarkable diversity of soil microbial communities has been the focus of numerous studies, but the magnitude of the diversity in soil communities has limited progress toward understanding the general ecological principles that apply to these systems. One solution to this problem is to focus diversity studies on particular phylogenetic or functional groups rather than to attempt to simultaneously characterize all microorganisms in a given ecosystem (5, 53). This approach has two advantages; it reduces the complexity of the target group that must be sampled, and it reduces the range of ecological strategies that are likely used by species belonging to the target group. The scarcity of information currently available about the biology and ecology of Planctomycetes, the ubiquity and abundance of Planctomycetes in soils, and the unusual characteristics of these organisms among the Bacteria all make this group a compelling target for soil microbial diversity research. We examined the diversity of the Planctomycetes community in soil samples obtained from plots in an experimental orchard in order to (i) assess the diversity of this microbial group in soil, (ii) determine whether management effects, such as past soil cover and compost addition, had an impact on the richness or the structure of the Planctomycetes community, and (iii) determine whether the observations made can provide insight into the ecological distribution of the organisms.
MATERIALS AND METHODS
Site description.
Soils samples were obtained in May 2003 from a research orchard managed by Ian Merwin of the Cornell University Department of Horticulture in Ithaca, NY. The site, occupying approximately 3,000 m2, was originally planted in 1910 and then replanted in 1981 and 2001 and has been described previously (50). In 2001, old trees and roots were removed. The soil was ripped repeatedly with a chisel plow to a depth of 40 cm parallel to the old tree rows, and two treatments, representing soil history, were created by planting new trees perpendicular to the previous tree rows with one half of the trees planted in the old tree rows and the other half planted in the previous grass drive lanes. The previous grass lane and old row treatments were divided into blocks with each treatment replicated five times across the site. These replicate blocks were further subdivided, and additional treatments were applied in a latin square design. Two of these treatments were used in this study; one was a compost treatment (consisting of 40% [vol/vol] ground leaves and wood chips, 40% vegetable material, and 20% precomposted cattle and horse manure in wood shavings) mixed into the top 30 cm of soil at a rate of 69 tons ha−1, and the other was a control treatment that consisted of only mineral fertilizer. The nutrient content of the compost was determined, and the amount of fertilizer added to the control plots was designed to match the amount of nutrients supplied in the compost (318 kg ha−1 of N-P-K 22-4-10) as described previously (50). Thus, a total of four treatments were examined in this study: old row with compost, old row control, previous grass lane with compost, and previous grass lane control.
Soil physical and chemical properties.
Soil cores (diameter, 2.5 cm; depth, 30 cm) were taken between trees for five replicates of each treatment and were analyzed as described previously (50). Briefly, the soil organic matter (SOM) content was determined by loss on ignition for 2 h at 550°C (57); the soil pH was measured in a 1:1 soil-water solution; Ca2+ concentrations were determined by atomic adsorption following extraction with Morgan's solution (41); and nitrate concentrations were determined colorimetrically (27).
Amplifying and cloning 16S rRNA genes from Planctomycetes.
Four soil cores (diameter, 2.5 cm; depth, 30 cm) were obtained 10 to 15 cm from each tree trunk for five replicates of each treatment, and these cores were combined, sieved, and stored on ice for transport to the laboratory, where they were frozen at −20°C. DNA was extracted as described previously (8). Briefly, cells were lysed by bead beating (Fastprep 120 Beadbeater; Bio 101) 0.5 g of soil and 0.5 g silica/zirconia beads (0.1 mm) in 1 ml of 180 mM phosphate buffer with 1% sodium dodecyl sulfate. DNA was extracted from the soil homogenate using a FastDNA spin kit for soil (Qbiogene, Irvine, CA) as recommended by the manufacturer, and DNA concentrations were determined spectrophotometrically. Planctomycetes 16S rRNA genes were amplified by PCRs with primers Pla37f (5′-TGG CGG CRT GGA TTA G-3′; modified from the primer described by Neef et al. [44]) and Univ1390r (5′-GAC GGG CGG TGT GTA CAA-3′ [1]). Reactions were carried out in 100-μl mixtures containing 20 ng of template DNA, each primer at a concentration of 0.3 μM, each deoxynucleoside triphosphate at a concentration of 50 μM, 0.05% bovine serum albumin, 0.05% Tween 20, 2.5 mM MgCl2, 2.5 U of AmpliTaq Gold DNA polymerase (Applied Biosystems, Foster City, CA), and 1× PCR buffer (supplied with Taq enzyme). The PCR protocol consisted of 95°C for 5 min, followed by 30 cycles of 45 s at 95°C, 30 s at 68°C, and 30 s at 72°C and a final extension for 15 min at 72°C. DNA from Planctomyces limnophilus ATCC 43296 was used as a positive control in PCRs, while DNA from Verrucomicrobium spinosum ATCC 43997 (which has two mismatches with the Pla37f primer) was used as a negative control to ensure the specificity of PCR conditions for 16S rRNA genes from Planctomycetes. One PCR was performed per soil sample for four replicate plots from each treatment, and the products of these reactions were pooled to create composite samples representing the four treatments. The four pooled samples were then cloned into the pCR4.0 vector using a TOPO-TA cloning kit (Invitrogen Corp., Carlsbad, CA) to create four separate libraries. From these four libraries a total of 240 sequences were determined using Pla37f as a sequencing primer. These clones were screened for the presence of chimeras with the Chimera Check algorithm (12) and by examining base pair complementarity in 16S rRNA secondary structure. A total of 223 of the sequences were found to belong to the Planctomycetes, 15 belonged to candidate division WS3, and two belonged to candidate division BRC1. Sequences not belonging to the Planctomycetes were subsequently not included in the analyses of Planctomycetes diversity and community structure. The complete 16S rRNA sequences of several representative clones were determined for phylogenetic analyses.
Diversity estimation and phylogenetic analysis.
The operational taxonomic unit (OTU) classification was based on 16S rRNA sequence similarity values calculated from a distance matrix generated by DNADIST in Phylip (18). A total of 535 aligned 16S rRNA gene positions were used to calculate this diversity matrix, and positions at which the alignment was ambiguous and for which positional homology could not be confirmed were not included in the analysis. A sequence similarity value of 99% was used for the definition of an OTU for most diversity calculations, but in several instances other OTU definitions were used for the sake of comparison; we indicate below when these other OTU definitions were used. The use of 99% similarity for the definition of an OTU for comparisons of diversity was deemed appropriate because in this analysis we focused on a single phylogenetic group and this OTU definition provided greater sensitivity to differences in diversity between samples than the use of a lower sequence similarity threshold would have provided and was stringent enough that it was unlikely to be affected by sequencing errors (32). The program EstimateS (version 7.0.1; R. K. Colwell; http://purl.oclc.org/estimates) was used to calculate the nonparametric richness estimator Chao1 and its confidence intervals as described previously (26). The phylogenetic compositions of libraries from the different treatments were compared using ∫-LIBSHUFF (54). This program was used to calculate the probability that the phylogenetic differences observed between the clone libraries were due to chance.
A BLAST search of the 223 Planctomycetes 16S rRNA clone sequences obtained in this study was performed in August 2005 to assess the similarity of these sequences to the 1,344 Planctomycetes 16S rRNA gene sequences identified in public sequence databases. Phylogenetic analyses were performed by using the programs ARB (59) and Phylip 3.64 (18). The sequences were initially aligned by using the ARB automatic aligner and then were verified and corrected manually. Regions where the alignment was ambiguous were identified and were not included in subsequent phylogenetic analyses. Phylogenetic trees were generated by performing neighbor-joining (51), parsimony (60), and maximum likelihood analyses (47). During tree construction, the sequence compositions of trees and outgroups were varied. Bootstrapping was performed using Phylip with 100 randomizations.
PCR-DGGE of 16S rRNA genes from Planctomycetes.
Denaturing gel electrophoresis (DGGE) of 16S rRNA genes was used to examine the Planctomycetes community composition in each of the four replicate plots that received the four field treatments. DGGE of 16S rRNA genes from Planctomycetes was performed using primers Pla46f (5′-GGA TTA GGC ATG CAA GTC-3′ [44]) and PRUN519r-GC (5′-CGC CCG CCG CGC GCG GCG GGC GGG GCG GGG GCA CGG GGG GAT TAC CGC GGC TGC TGG-3′ [42]). Reactions were carried out in 25-μl mixtures containing 20 ng of template DNA, each primer at a concentration of 0.5 μM, each deoxynucleoside triphosphate at a concentration of 50 μM, 3 mM MgCl2, 0.5 U of AmpliTaq Gold polymerase (Applied Biosystems), and 1× PCR buffer (supplied with the enzyme). Each PCR amplification consisted of 95°C for 5 min, followed by 35 cycles of 30 s at 95°C, 45 s at 48°C, and 45 s at 72°C and a final extension for 10 min at 72°C. DGGE polyacrylamide (8%) gels were used with a 35 to 55% gradient of denaturant containing 7 M urea and 40% (vol/vol) formamide. DGGE was performed using 1.5 μg of PCR product in 1× Tris-acetate-EDTA buffer at 60°C at a constant voltage of 100 V for 12 h with a Dcode mutation detection system (Bio-Rad, Hercules, CA). Gels were stained with SYBR Green I (Sigma-Aldrich, St. Louis, MO) and imaged with a Fluor-S multiimager (Bio-Rad), and the Quantity One 4.2 software (Bio-Rad) was used to detect bands and to quantify band intensity. The DGGE results were compared using redundancy analysis to correlate banding patterns with the soil chemical and physical properties of replicate plots. The significance of the correlations was assessed with the Monte Carlo permutation test, based on 499 random permutations of the data using the Canoco v 4.5 software (Microcomputer Power, Ithaca, NY).
Nucleotide sequence accession numbers.
The nucleotide sequences of the 223 Planctomycetes 16S rRNA gene clones described in this study have been deposited in the GenBank database under accession numbers QH334874 to QH335096.
RESULTS
Planctomycetes diversity in soil.
Rank abundance curves were constructed using three different similarity cutoffs for the definition of OTUs, which revealed nonuniform distributions for each OTU definition (Fig. 1). The reciprocal of the Simpson's index, a measure of community evenness, was 70 at the 97% OTU cutoff, which is considerably lower than the values obtained for the overall bacterial diversity in many surface soils (16, 43). The mean of the nonparametric richness estimator Chao1 and its standard deviation were also calculated, and the data revealed that at 223 sequences the Chao1 estimator appeared to reach an asymptote for each of the OTU cutoff definitions, with 312 ± 35 Planctomycetes OTUs present at the 99% cutoff level and 205 ± 25 OTUs present at the 97% similarity threshold. With the 99% similarity definition for an OTU, 31% of the OTUs were sampled at least two times and represented 53% of the total sequences, and 18 of the 46 OTUs were cosmopolitan (occurring in two or more treatments). In addition, the total number of OTUs observed in the combined libraries accounted for 48% of the Chao1 diversity estimate as defined at the 99% similarity threshold.
FIG. 1.
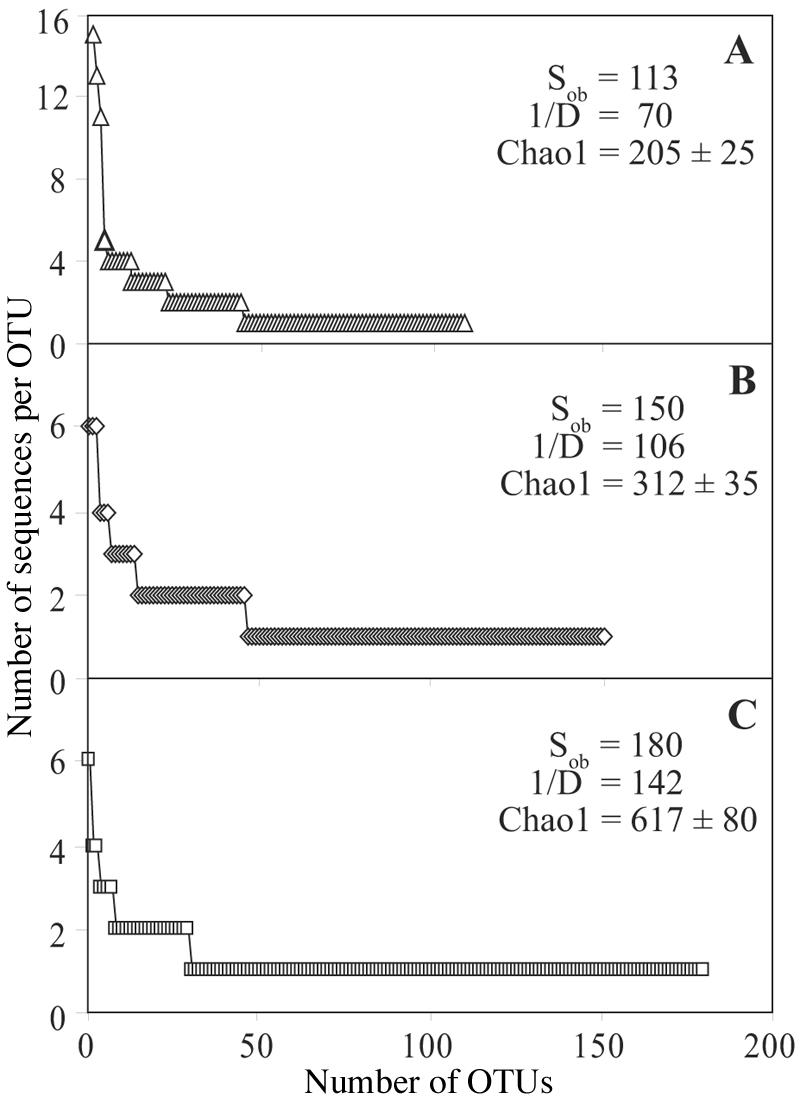
Rank abundance curves and summary statistics for Planctomycetes diversity with OTUs defined at 97% (A), 99% (B), and 100% (C) similarity of 16S rRNA gene sequences. Note that for the sake of clarity the scales on the y axes are not the same. Sob, total number of OTUs observed; 1/D, reciprocal of the Simpson's index.
Parametric models were also evaluated to provide an estimate of total Planctomycetes richness at the site. The reciprocal of the Simpson's index and the total number of OTUs observed for each of the OTU cutoffs are consistent with the R10 and R11 lognormal models of species abundance described by Narang and Dunbar (43) for 200-member surveys. Based on the frequency of the most abundant OTU class observed in the libraries (4% at the 99% threshold and 13% at the 97% threshold), these models predicted that the site contained from 4,000 to 6,000 Planctomycetes OTUs at the 99% similarity threshold and less than 2,000 OTUs at the 97% similarity threshold. Alternatively, it was possible to use the assumption of a uniform distribution to place a lower boundary on community richness, as described by Lunn et al. (38). This method generated a lower confidence interval of 1,000 OTUs at the 99% similarity threshold for Planctomycetes richness at the site.
Phylogenetic characterization of noncultivated Planctomycetes.
A total of 209 of the sequences were less than 99% similar to previously characterized sequences present in public databases, 141 of the sequences were less than 97% similar to previously characterized sequences, and 19 of the sequences were less than 90% similar to previously characterized sequences. Phylogenetic analysis revealed that all but five of the sequences fell in the family Planctomycetaceae; 88 sequences clustered in the genus Pirellula, 62 sequences clustered in the genus Planctomyces, 24 sequences clustered in the genus Isosphaera, 38 sequences clustered in the genus Gemmata, and 6 sequences fell in the Planctomycetaceae but were not associated with any previously described genus (Fig. 2). The remaining five sequences formed an independent cluster in the phylum Planctomycetes (Fig. 3).
FIG. 2.

Neighbor-joining tree calculated from 535 nucleotide positions showing Planctomycetaceae 16S rRNA sequences described in this study. Sequences are indicated by symbols indicating their origins, as follows: ▪, old row with compost; •, old row control; □, grass lane with compost; ○, grass lane control. Other Planctomycetaceae sequences are included for reference; species or strain designations are indicated for cultivated isolates, while sequences from noncultivated organisms are indicated by their Ribosomal Database Project identification code numbers (beginning with S000). Pla., Planctomyces; Iso., Isosphaera. The scale bar indicates a 10% difference between nucleotide sequences. The arrow indicates a subgroup of the genus Pirellula as discussed in the text.
FIG. 3.
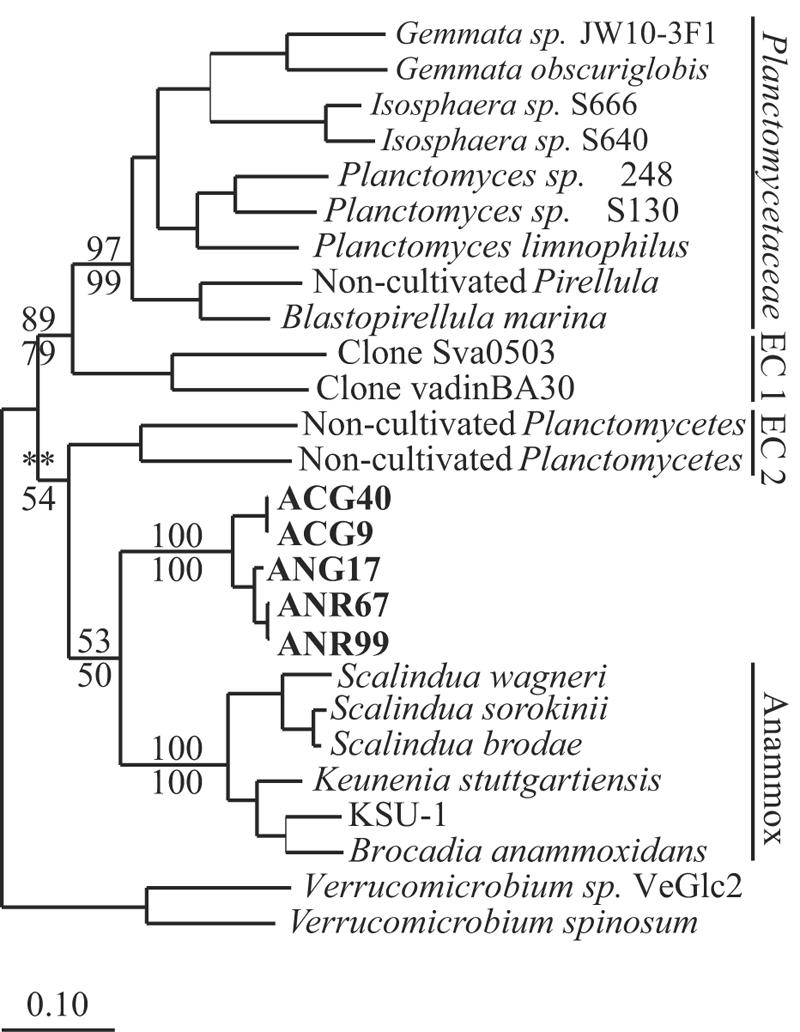
Phylogenetic tree showing the relationship of the deeply divergent Planctomycetes 16S rRNA gene sequences obtained in this study (boldface type) to other deeply divergent sequences in the Planctomycetes. The tree was calculated using 1,235 aligned nucleotide positions and maximum likelihood analysis. The numbers at nodes indicate bootstrap support; the numbers above the lines are values obtained from the maximum likelihood analysis, and the numbers below the lines were obtained from the parsimony analysis. The asterisks indicate that fewer than 50% of the trees supported a node. EC, environmental cluster. The scale bar indicates a 10% difference between nucleotide sequences.
The five sequences that were not members of the family Planctomycetaceae formed a coherent group that was deeply divergent in the Planctomycetes and did not associate strongly with any previously identified Planctomycetes 16S rRNA gene sequences (Fig. 3). Phylogenetic trees demonstrated consistently that this novel sequence cluster and the anammox group had a proximate common ancestor, but bootstrap values only weakly supported the hypothesis that these sequences formed a monophyletic group with the anammox Planctomycetes (Fig. 3).
Evidence for a taxon-area relationship for Planctomycetes in soil.
Richness estimates were calculated for nested subsets of treatments in order to test if a taxon-area relationship was apparent for Planctomycetes at the New York orchard site. Chao1 estimates were calculated for libraries for individual treatments (n = 4) and for all possible groups of two (n = 6) or three (n = 4) treatments (Fig. 4A). The clone libraries generated for each individual treatment were created from DNA extracted from pooled soil cores representing a combined area of 36 m2, and thus groups of two or three treatments represented 72 and 108 m2, respectively. Since, with small sample sizes the value obtained for richness estimates can correlate with sequencing intensity, the richness estimates for nested subsets of treatments were compared to a null model generated from similar numbers of sequences drawn at random from all treatments (Fig. 4B). There was a significant correlation (r2 = 0.998, P = 0.0007) between diversity and area for the nested data, and analysis of covariance revealed that there was a significant interaction between the nested treatments and the null model [F(1,6) = 89.7, P = 0.0007], demonstrating that the slope of the line for the taxon-area relationship was significantly greater than would be predicted if sampling intensity was the only factor affecting richness estimates. In addition, the mean richness of the nested treatments was significantly lower than the mean richness found when sequences were sampled at random [F(1,6) = 114.9, P = 0.0004]. These results demonstrate that the Planctomycetes richness at the site increased proportionally with the size of the area sampled, and this effect was not an artifact of sampling intensity. The taxon-area curve was best fit to a line on a log-log plot (Fig. 4B) conforming to the general power law, S = cAz, where S is the number of species, A is the area sampled, c is the intercept, and z is the slope on a log-log plot, as has been observed for a range of ecological systems (34). After correcting for the effects of sample size by subtracting the line generated from random samples from the line generated from the spatially organized nested samples, we determined that the value for z was 0.52.
FIG. 4.

Spatially explicit scaling of Planctomycetes diversity with respect to treatment (calculated with OTUs defined at a 99% 16S rRNA sequence similarity cutoff). (A) Average Chao1 estimates and standard deviations calculated for individual treatments (n = 4) (line 1), for all two-way treatment combinations (n = 6) (line 2), for all three-way treatment combinations (n = 4) (line 3), and for all treatments (n = 1) (line 4). (B) Log of Chao1 as a function of the log of area calculated for sequences sampled in a spatially explicit manner as described above (⧫) and for corresponding numbers of sequences selected at random from the collection of all sequences (▪).
Effect of soil history and compost amendment on Planctomycetes community composition.
Soil history had a significant impact on the richness of the Planctomycetes community (Fig. 5 and Table 1). Chao1 estimates indicated that Planctomycetes richness was higher for the old row treatments (255 ± 43 OTUs [mean ± standard deviation]) than for the grass lane treatments (131 ± 18 OTUs) when sequences were pooled based on soil history, and these differences are significant (Table 1). The influence of soil history was also apparent when the sequences were split based on compost treatment (Table 2). Old row communities that received compost had significantly greater richness than grass lane communities that received compost (Fig. 5 and Table 2), and old row control treatments also had more richness than grass lane control treatments, although the differences are not significant (Table 2). ∫-LIBSHUFF analysis was used to compare the phylogenetic compositions of the libraries based on soil history. The phylogenetic composition of the old row communities differed significantly from that of the grass lane communities (P < 0.001), while the Planctomycetes in the grass lane communities were shown to be a subset of the Planctomycetes in the old row communities (P = 0.046). In addition, 25 of the 32 doubletons observed occurred within treatments instead of across treatments, a frequency that is three times greater than that expected by chance (P < 0.001, as determined by a chi-square test), and this indicates that treatment effects were associated with significant changes in the Planctomyetes community composition at the site. Thus, richness estimates and ∫-LIBSHUFF analysis, taken together, revealed that a common core of Planctomycetes sequences was present in both the grass lane and old row soils but that the old rows contained additional sequences that were not found in the grass lanes.
FIG. 5.

Chao1 diversity estimates for Planctomycetes 16S rRNA sequences with OTUs defined at 99% similarity. (A) Chao1 curves for each of the four individual libraries. (B) Results when the libraries were pooled based on compost amendment or soil history.
TABLE 1.
Diversity statistics for 16S rRNA gene libraries pooled to represent the main effects of either soil history or compost additiona
| Parameter | Soil history
|
Compost addition
|
All | ||
|---|---|---|---|---|---|
| Grass lane | Old row | Control | Compost | ||
| Total no. of sequences | 111 | 112 | 110 | 113 | 223 |
| Observed no. of OTUs | 75 | 87 | 82 | 82 | 150 |
| Chao1 (mean ± SD) | 131 ± 18 | 255 ± 43 | 175 ± 26 | 186 ± 29 | 312 ± 35 |
| Lower 95% confidence interval | 106 | 189 | 136 | 143 | 257 |
| Upper 95% confidence interval | 179 | 362 | 242 | 260 | 395 |
OTUs were defined by 99% 16S rRNA gene similarity.
TABLE 2.
Diversity statistics for 16S rRNA gene libraries from individual treatmentsa
| Parameter | Grass lane
|
Old row
|
||
|---|---|---|---|---|
| Control | Compost | Control | Compost | |
| Total no. of sequences | 56 | 55 | 54 | 58 |
| Observed no. of OTUs | 42 | 37 | 42 | 49 |
| Chao1 (mean ± SD) | 82 ± 16 | 60 ± 11 | 108 ± 25 | 152 ± 34 |
| Lower 95% confidence interval | 60 | 47 | 74 | 103 |
| Upper 95% confidence interval | 127 | 93 | 177 | 243 |
OTUs were defined by 99% 16S rRNA gene similarity.
Compost amendment did not affect the richness of the Planctomycetes community (Fig. 5 and Table 1), but it did affect the phylogenetic composition. ∫-LIBSHUFF analysis revealed that the phylogenetic composition of treatments that received compost differed significantly from the phylogenetic composition of the control treatments (P < 0.001). In addition, analysis of Planctomycetes 16S rRNA gene DGGE profiles showed that there was a shift in community composition in response to compost amendment (Fig. 6). Chi-square analysis was used to test whether clones belonging to certain phylogenetic subgroups originated from particular treatments more frequently than would be expected by chance. This analysis revealed that a subgroup in the genus Pirellula (Fig. 2) was dominated by sequences originating from compost treatments. The frequency with which compost-associated clones occurred in this group (17 of 21 recovered sequences [Fig. 2]) was unlikely to have occurred by chance (P = 0.006, as determined by a chi-square test), suggesting that there was an association between these organisms and the compost amendment treatment.
FIG. 6.
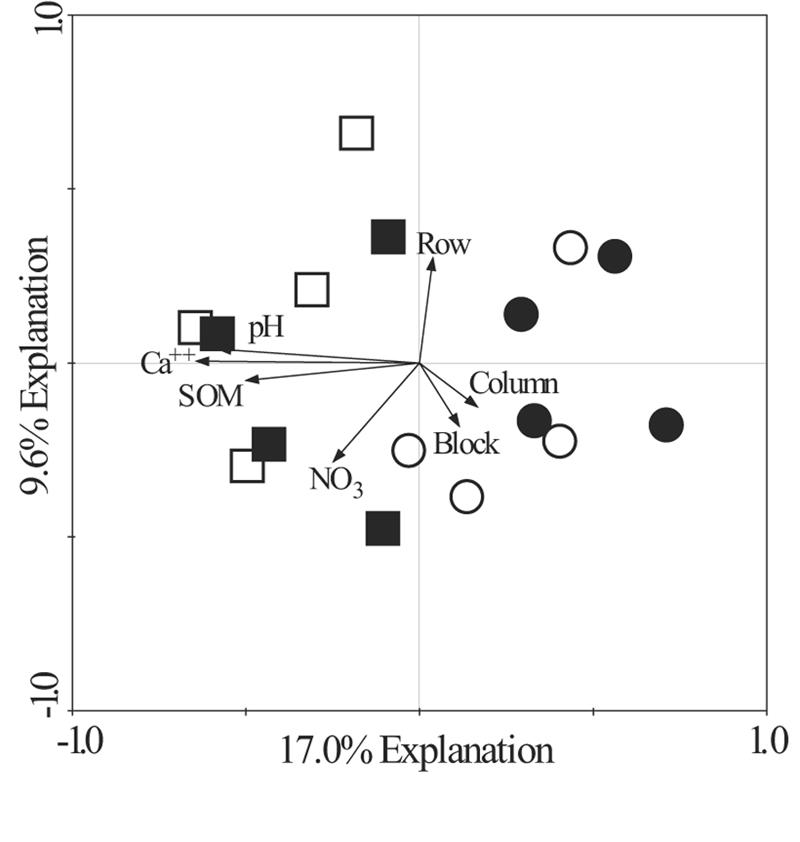
Redundancy analysis plot of the differences in Planctomycetes community composition as assessed by PCR-DGGE of 16S rRNA genes based on treatment effects and the environmental variables pH, NO3 N content (NO3), organic matter content (SOM), and Ca2+ content (Ca++). Each symbol represents a PCR-DGGE pattern for one replicate plot from one treatment. The treatments are indicated by symbols as follows: ▪, old row with compost; •, old row control; □, grass lane with compost; ○, grass lane control.
Influence of soil characteristics on Planctomycetes community composition.
Redundancy analysis of Planctomycetes DGGE profiles revealed that the measured environmental variables had a significant effect on Planctomycetes community composition (P = 0.002) (Fig. 6). The vectors row, column, and block refer to the spatial position within the site, and these variables explained only 18% of the variability in the redundancy analysis model; in contrast, the environmental variables pH, Ca2+ content, SOM content, and soil NO3 N content together explained 47% of the variability in the DGGE profiles. With the exception of soil NO3 N content, all of the environmental variables reported (Table 3), were determined by analysis of variance to be significantly greater in compost-amended soils than in control soils [for pH, F(1,16) = 29.3 and P < 0.001; for Ca2+, F(1,16) = 41.6 and P < 0.001; and for SOM, F(1,16) = 29.3 and P < 0.001]. In contrast, the only significant change in soil characteristics associated with soil history was the change in the SOM content [5.5% ± 2.0% SOM in the previous grass lanes and 4.2% ± 0.8% SOM in the old rows; F(1,16) = 7.0 and P = 0.018].
TABLE 3.
Means and standard deviations for selected soil characteristics for individual treatments
| Treatment | Ca2+ (kg ha−1) | pH | SOM (%) | NO3 N (kg ha−1) |
|---|---|---|---|---|
| Grass lane with compost | 2,644 ± 836 | 7.0 ± 0.4 | 6.9 ± 1.8 | 18.9 ± 13.0 |
| Grass lane control | 1,101 ± 258 | 6.0 ± 0.6 | 4.0 ± 0.8 | 20.6 ± 15.0 |
| Old row with compost | 2,585 ± 652 | 7.1 ± 0.3 | 4.8 ± 0.5 | 18.7 ± 18.6 |
| Old row control | 953 ± 141 | 5.9 ± 0.4 | 3.6 ± 0.5 | 12.8 ± 20.6 |
Environmental values were also examined in relation to the richness of the Planctomycetes community by looking for correlations between richness and the means and coefficients of variation (CV) for these variables. The CV for each variable provided a measure of the environmental heterogeneity for that variable within each treatment (40). The variables most strongly influenced by compost amendment (pH, Ca2+, and SOM) showed no association with differences in the richness of the Planctomycetes community. However, a significant positive correlation was found between the CV of soil NO3 N and the richness of the Planctomycetes community (Fig. 7).
FIG. 7.
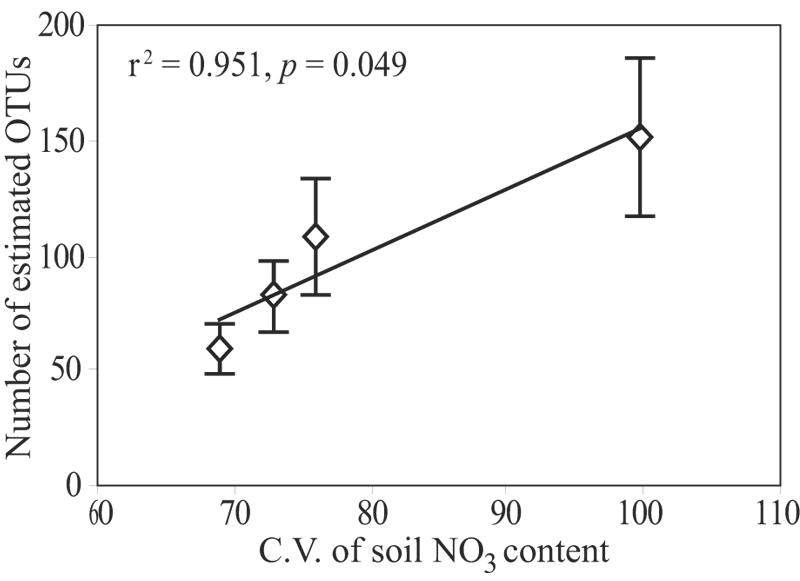
Relationship between the Chao1 estimate of diversity and the coefficients of variation (C.V.) for the NO3 N content in the four treatments analyzed. The error bars indicate the standard deviations of the Chao1 estimates.
DISCUSSION
Soil microbial communities are known to be remarkably complex, and the estimates of soil diversity are as high as 8.3 × 10⁶ unique genomes per 30 g of soil (23). Surveys of rRNA gene diversity that target all Bacteria simultaneously are likely to underestimate diversity greatly as a result of undersampling, unless thousands or tens of thousands of sequences are determined (43, 53). As a result, it has been argued that efforts to characterize microbial diversity should focus on individual phylogenetic or functional groups in order to reduce the complexity (5, 53). For example, a review of 15 studies of soil bacterial diversity (30) which examined fewer than 350 16S rRNA sequences found a bacterial diversity of 376 ± 223 (mean ± standard deviation) OTUs in soils (Chao1 estimates; 97% sequence similarity OTU definition). In contrast, the richness of Planctomycetes that we found (Chao1 estimates; 205 ± 25 OTUs [mean ± standard deviation]; 97% sequence similarity OTU definition) would account for more than 50% of this total soil bacterial diversity. Given the large number of phylogenetic groups present in soil, it is unlikely that the Planctomycetes account for such a large fraction of the total diversity of soil communities. This anomaly is not a function of the diversity estimator used as a parametric model, which assumed a lognormal distribution of organisms, provided an estimate of 4,000 to 6,000 Bacteria in soil (43), and generated an estimate of 1,000 to 2,000 Planctomycetes in soil at the orchard site (with all calculations based on the 97% 16S rRNA sequence similarity OTU definition). While differences in the spatial scale at which these surveys were conducted may have contributed to the observed discrepancies, a more important factor was likely the phylogenetic scale at which the studies were conducted. Studies which decrease complexity by targeting particular phylogenetic or functional groups are less likely to suffer from problems of undersampling and should provide more robust and ecologically meaningful estimates of diversity.
Nonparametric and parametric techniques for estimating diversity provide values for Planctomycetes diversity that vary by as much as an order of magnitude. Parametric models assume an underlying distribution of sequences within the community, and their veracity depends on the degree to which the model distribution matches the actual distribution of species in the community. Discrepancies between these different methods for estimating diversity are based on the assumptions made by the different techniques and have been observed previously and discussed elsewhere (5). While nonparametric estimators can provide artificially low values for richness, they allow unbiased relative comparisons of diversity between communities provided that the communities compared are sampled with equal intensity (26).
Analyses of 16S rRNA gene libraries and DGGE profiles revealed that the structure of Planctomycetes communities in soil were affected by both soil history and compost amendment, but each of these factors affected different aspects of the community structure. Soil history had a significant effect on the composition and richness of the Planctomycetes community (as revealed by ∫-LIBSHUFF and Chao1 estimates), while compost amendment changed the phylogenetic composition of the community but did not result in a significant change in richness (as revealed by ∫-LIBSHUFF, Chao1 estimates, and DGGE analysis). Previous research has shown that the bacterial community composition in the tree rows of an orchard differs significantly from the bacterial community composition in adjacent uncropped soil (39). In addition, in a companion study we demonstrated that the overall bacterial community compositions in the orchard differed significantly for soils with different histories (50). It is interesting, however, that bacterial community composition in the orchard soil was not observed to change when different compost amendments were used (50). This result, which contrasts with our conclusion that Planctomycetes are clearly affected by compost amendment, can be explained by the fact that the general bacterial primers used in the previous study did not amplify 16S rRNA genes from Planctomycetes, and thus changes in Planctomycetes community composition would not have been detected. The most apparent change in Planctomycetes community structure associated with compost amendment is the overrepresentation of clones in a subgroup of the genus Pirellula, as indicated in Fig. 2. The overrepresentation of these clones in compost treatments could have been due to increases in soil Ca2+, SOM, or pH, all of which changed significantly as a result of compost amendment (Table 2) (50). An alternative explanation is that the Pirellula may have been introduced into the site in the compost itself. This explanation, however, would also require that the introduced organisms replaced indigenous Planctomycetes since the net richness did not increase in response to compost addition.
It is worth noting that while 16S rRNA gene DGGE profiles were able to reveal changes in Planctomycetes community composition in response to compost amendment, these profiles were not sensitive to the effect of soil history on Planctomycetes 16S rRNA gene richness. There are two possible explanations for why the DGGE analysis was not sensitive to changes in richness. First, it is possible that the DGGE analysis was not responsive to rare taxa, and second, comigration of bands with similar denaturing characteristics may have masked changes in richness. The number of bands that are typically identified by DGGE analysis of 16S rRNA genes is far fewer than the actual number of 16S rRNA genes present in the community, and this method, like any community fingerprinting method, primarily identifies only the most abundant members in the community (21). Thus, it is possible that rare taxa accounted for the majority of the change in richness due to soil history and that these taxa were not detected in the DGGE analysis. An alternative explanation is that most of the differences in richness occurred as a result of small differences in 16S rRNA gene sequences that were detectable at the 99% similarity threshold but were not detectable as separate bands by DGGE. This possibility is supported by the observations that bands on a DGGE gel can be composed of different 16S rRNA genes with similar melting profiles (55) and that the difference in richness associated with soil history was most pronounced at the 99% OTU cutoff definition and was less pronounced if either a 95% or 90% OTU cutoff was used (see below).
The Planctomycetes communities in the old rows were significantly more diverse than the Planctomycetes communities in the grass lanes when OTUs were defined at the 99% sequence similarity threshold (Fig. 5 and Table 1) but not when either a 95% threshold was used (126 ± 28 and 84 ± 14 OTUs, respectively [mean ± standard deviation]) or when a 90% threshold was used (62 ± 14 and 55 ± 10 OTUs, respectively). In addition, as mentioned above, ∫-LIBSHUFF analysis revealed that the Planctomycetes communities in the grass lanes were a subset of the communities in the old rows. Taken together, these observations suggest that the same major lineages of Planctomycetes were present in both the old row and grass lane communities and that the major differences in diversity between these communities occurred primarily at the tips of the phylogenetic tree. The observation that heterogeneity in soil NO3 N levels correlated with Planctomycetes richness (Fig. 7) suggests that environmental heterogeneity was a possible factor driving this pattern of microbial diversity. Nitrate N levels in soil are a function of fertilizer input and the rates of nitrification, denitrification, immobilization, and mineralization. Thus, the diversity of the Planctomycetes community may be a function of either heterogeneity in the NO3 N levels themselves or heterogeneity in soil processes or characteristics correlated with soil NO3 N levels. Environmental heterogeneity has previously been implicated as a determinant of microbial diversity (25, 40), and it may underlie observations of the taxon-area relationships in ecological communities (34, 49).
The Planctomycetes community in soil was observed to conform to the classic power law description of the taxon-area relationship, S = cAz (Fig. 4B). In order to assess the change in Planctomycetes richness as a function of area, the community composition was examined in a nested fashion with the Planctomycetes sequences from each treatment combined into all possible sets of treatments representing areas of that were different sizes (Fig. 4A). An important consideration in this approach is that diversity is typically underestimated when small numbers of sequences are drawn from highly diverse communities, and when this occurs, diversity estimates correlate strongly with sequencing effort (13, 16, 43). It is possible to control for this effect by comparing the diversity estimate calculated for each successive area to a diversity estimate calculated from an equal number of sequences drawn at random from the entire set (Fig. 4B). It is clear that Planctomycetes diversity increased with increasing area at the orchard site and that the magnitude of the increase was greater than the magnitude that could be explained by sampling effort alone. Another consideration in interpreting this evidence for a taxon-area relationship is that treatment effects clearly influenced the richness of the Planctomycetes community at the orchard site, and so the value obtained for z may be higher than the value expected for a natural landscape.
While the diversity of plant and animal communities generally increases with the size of the area sampled, as described by the taxon-area power law (49), there has been some debate concerning whether this relationship applies to microbial communities (19, 20). However, an increasing body of evidence has demonstrated that microbial community composition is affected by spatial separation in a range of ecosystems and at a range of scales (11, 17, 31, 63, 68), with z values reported to range between 0.02 and 0.47 (4, 24, 25, 45, 61). The highest z value reported (0.47) was observed for bacterial communities in soil (45), which agrees most closely with the z value observed for the Planctomycetes community in the current study (0.52). It is interesting that these two studies were conducted at similar spatial scales, with the bacterial and Planctomycetes communities assessed for 64 m2 and 108 m2, respectively.
In this study, Planctomycetes community diversity increased in proportion to the area sampled and was correlated with the spatial heterogeneity of nitrate, which was associated with soil management history at the orchard site. The abundance of Planctomycetes in soils has previously been shown to be sensitive to soil history (8), but this is the first report of changes in Planctomycetes diversity related to soil history. Soils in old fields that have never been cultivated or have been cultivated and then abandoned for more than 50 years have been shown to have a significantly higher abundance of Planctomycetes rRNA (10.7% ± 4.3%) than soils from actively managed agricultural fields (4.5% ± 3.6%) or soils abandoned for fewer than 10 years (2.2% ± 2.2%) (8). The differences in Planctomycetes abundance and diversity appear to occur over fairly long time scales and as a result are likely linked to changes in soil characteristics that are slow to recover from the effects of production agriculture.
Acknowledgments
This study was based on work supported by the National Science Foundation under grant 0405073. This research was also supported in part by USDA-IREE project NYC-125560 and by Cornell University Agricultural Experiment Station Federal Formula Funds project NYC-125429 from USDA-CSREES. The field site used in this study was supported by grants from the USDA-IREE Methyl Bromide Alternatives program (grant 2002-5110-201923) and from the New York State IPM program.
REFERENCES
- 1.Amann, R. I., W. Ludwig, and K.-H. Schleifer. 1995. Phylogenetic identification and in situ detection of individual microbial cells without cultivation. Microbiol. Rev. 59:143-169. [DOI] [PMC free article] [PubMed] [Google Scholar]
- 2.Axelrood, P. E., M. L. Chow, C. C. Radomski, J. M. McDermott, and J. Davies. 2002. Molecular characterization of bacterial diversity from British Columbia forest soils subjected to disturbance. Can. J. Microbiol. 48:655-674. [DOI] [PubMed] [Google Scholar]
- 3.Bauer, M., T. Lombardot, H. Teeling, N. L. Ward, R. Amann, and F. Glockner. 2004. Archaea-like genes for C-1-transfer enzymes in Planctomycetes: phylogenetic implications of their unexpected presence in this phylum. J. Mol. Evol. 59:571-586. [DOI] [PubMed] [Google Scholar]
- 4.Bell, T., D. Ager, J. I. Song, J. A. Newman, I. P. Thompson, A. K. Lilley, and C. J. van der Gast. 2005. Larger islands house more bacterial taxa. Science 308:1884. [DOI] [PubMed] [Google Scholar]
- 5.Bohannan, B. J. M., and J. Hughes. 2003. New approaches to analyzing microbial biodiversity data. Curr. Opin. Microbiol. 6:282-287. [DOI] [PubMed] [Google Scholar]
- 6.Borneman, J., P. W. Skroch, K. M. O'Sullivan, J. A. Palus, N. G. Rumjanek, J. L. Jansen, J. Nienhuis, and E. W. Triplett. 1996. Molecular microbial diversity of an agricultural soil in Wisconsin. Appl. Environ. Microbiol. 62:1935-1943. [DOI] [PMC free article] [PubMed] [Google Scholar]
- 7.Borneman, J., and E. W. Triplett. 1997. Molecular microbial diversity in soils from eastern Amazonia: evidence for unusual microorganisms and microbial population shifts associated with deforestation. Appl. Environ. Microbiol. 63:2647-2653. [DOI] [PMC free article] [PubMed] [Google Scholar]
- 8.Buckley, D. H., and T. M. Schmidt. 2003. Diversity and dynamics of microbial communities in soils from agroecosystems. Environ. Microbiol. 5:441-452. [DOI] [PubMed] [Google Scholar]
- 9.Chatzinotas, A., R. A. Sandaa, W. Schonhuber, R. Amann, F. L. Daae, V. Torsvik, J. Zeyer, and D. Hahn. 1998. Analysis of broad-scale differences in microbial community composition of two pristine forest soils. Syst. Appl. Microbiol. 21:579-587. [DOI] [PubMed] [Google Scholar]
- 10.Chistoserdova, L., C. Jenkins, M. G. Kalyuzhnaya, C. J. Marx, A. Lapidus, J. A. Vorholt, J. T. Staley, and M. E. Lidstrom. 2004. The enigmatic Planctomycetes may hold a key to the origins of methanogenesis and methylotrophy. Mol. Biol. Evol. 21:1234-1241. [DOI] [PubMed] [Google Scholar]
- 11.Cho, J. C., and J. M. Tiedje. 2000. Biogeography and degree of endemicity of fluorescent Pseudomonas strains in soil. Appl. Environ. Microbiol. 66:5448-5456. [DOI] [PMC free article] [PubMed] [Google Scholar]
- 12.Cole, J. R., B. Chai, R. J. Farris, Q. Wang, S. A. Kulam, D. M. McGarrell, G. M. Garrity, and J. M. Tiedje. 2005. The Ribosomal Database Project (RDP-II): sequences and tools for high-throughput rRNA analysis. Nucleic Acids Res. 33:D294-D296. [DOI] [PMC free article] [PubMed] [Google Scholar]
- 13.Curtis, T. P., W. T. Sloan, and J. W. Scannell. 2002. Estimating prokaryotic diversity and its limits. Proc. Natl. Acad. Sci. USA 99:10494-10499. [DOI] [PMC free article] [PubMed] [Google Scholar]
- 14.Davis, K. E. R., S. J. Joseph, and P. H. Janssen. 2005. Effects of growth medium, inoculum size, and incubation time on culturability and isolation of soil bacteria. Appl. Environ. Microbiol. 71:826-834. [DOI] [PMC free article] [PubMed] [Google Scholar]
- 15.Derakshani, M., T. Lukow, and W. Liesack. 2001. Novel bacterial lineages at the (sub)division level as detected by signature nucleotide-targeted recovery of 16S rRNA genes from bulk soil and rice roots of flooded rice microcosms. Appl. Environ. Microbiol. 67:623-631. [DOI] [PMC free article] [PubMed] [Google Scholar]
- 16.Dunbar, J., S. M. Barns, L. O. Ticknor, and C. R. Kuske. 2002. Empirical and theoretical bacterial diversity in four Arizona soils. Appl. Environ. Microbiol. 68:3035-3045. [DOI] [PMC free article] [PubMed] [Google Scholar]
- 17.Fawley, M. W., K. P. Fawley, and H. A. Owen. 2005. Diversity and ecology of small coccoid green algae from Lake Itasca, Minnesota, USA, including Meyerella planktonica, gen. et sp nov. Phycologia 44:35-48. [Google Scholar]
- 18.Felsenstein, J. 2005. PHYLIP (Phylogeny Inference Package), 3.64 ed. Department of Genome Sciences, University of Washington, Seattle.
- 19.Finlay, B. J. 2002. Global dispersal of free-living microbial eukaryote species. Science 296:1061-1063. [DOI] [PubMed] [Google Scholar]
- 20.Finlay, B. J., E. B. Monaghan, and S. C. Maberly. 2002. Hypothesis: the rate and scale of dispersal of freshwater diatom species is a function of their global abundance. Protist 153:261-273. [DOI] [PubMed] [Google Scholar]
- 21.Forney, L. J., X. Zhou, and C. J. Brown. 2004. Molecular microbial ecology: land of the one-eyed king. Curr. Opin. Microbiol. 7:210-220. [DOI] [PubMed] [Google Scholar]
- 22.Fuerst, J. A. 1995. The Planctomycetes—emerging models for microbial ecology, evolution and cell biology. Microbiology 141:1493-1506. [DOI] [PubMed] [Google Scholar]
- 23.Gans, J., M. Wolinsky, and J. Dunbar. 2005. Computational improvements reveal great bacterial diversity and high metal toxicity in soil. Science 309:1387-1390. [DOI] [PubMed] [Google Scholar]
- 24.Green, J. L., A. J. Holmes, M. Westoby, I. Oliver, D. Briscoe, M. Dangerfield, M. Gillings, and A. J. Beattie. 2004. Spatial scaling of microbial eukaryote diversity. Nature 432:747-750. [DOI] [PubMed] [Google Scholar]
- 25.Horner-Devine, M. C., M. Lage, J. B. Hughes, and B. J. M. Bohannan. 2004. A taxa-area relationship for bacteria. Nature 432:750-753. [DOI] [PubMed] [Google Scholar]
- 26.Hughes, J. B., J. J. Hellman, T. H. Ricketts, and B. J. M. Bohannan. 2001. Counting the uncountable: statistical approaches to estimating microbial diversity. Appl. Environ. Microbiol. 67:4399-4406. [DOI] [PMC free article] [PubMed] [Google Scholar]
- 27.Jackson, M. L. 1958. Soil chemical analysis. Prentice-Hall, Englewood Cliffs, N.J.
- 28.Kalyuzhnaya, M. G., N. Korotkova, G. Crowther, C. J. Marx, M. E. Lidstrom, and L. Chistoserdova. 2005. Analysis of gene islands involved in methanopterin-linked C-1 transfer reactions reveals new functions and provides evolutionary insights. J. Bacteriol. 187:4607-4614. [DOI] [PMC free article] [PubMed] [Google Scholar]
- 29.Kalyuzhnaya, M. G., O. Nercessian, M. E. Lidstrom, and L. Chistoserdova. 2005. Development and application of polymerase chain reaction primers based on fhcD for environmental detection of methanopterin-linked C-1-metabolism in bacteria. Environ. Microbiol. 7:1269-1274. [DOI] [PubMed] [Google Scholar]
- 30.Kemp, P. F., and J. Y. Aller. 2004. Bacterial diversity in aquatic and other environments: what 16S rDNA libraries can tell us. FEMS Microbiol. Ecol. 47:161-177. [DOI] [PubMed] [Google Scholar]
- 31.Kim, E., L. Wilcox, L. Graham, and J. Graham. 2004. Genetically distinct populations of the dinoflagellate Peridinium limbatum in neighboring northern Wisconsin lakes. Microb. Ecol. 48:521-527. [DOI] [PubMed] [Google Scholar]
- 32.Klepac-Ceraj, V., M. Bahr, B. C. Crump, A. P. Teske, J. E. Hobbie, and M. F. Polz. 2004. High overall diversity and dominance of microdiverse relationships in salt marsh sulphate-reducing bacteria. Environ. Microbiol. 6:686-698. [DOI] [PubMed] [Google Scholar]
- 33.Kuske, C. R., S. M. Barns, and J. D. Busch. 1997. Diverse uncultivated bacterial groups from soils of the arid southwestern United States that are present in many geographic regions. Appl. Environ. Microbiol. 63:3614-3621. [DOI] [PMC free article] [PubMed] [Google Scholar]
- 34.Lawton, J. H. 1999. Are there general rules in ecology? Oikos 84:177-192. [Google Scholar]
- 35.Liesack, W., and E. Stackebrandt. 1992. Occurrence of novel groups of the domain Bacteria as revealed by analysis of genetic material isolated from an Australian terrestrial environment. J. Bacteriol. 174:5072-5078. [DOI] [PMC free article] [PubMed] [Google Scholar]
- 36.Lindsay, M. R., R. I. Webb, and J. A. Fuerst. 1997. Pirellulosomes: a new type of membrane-bounded cell compartment in planctomycete bacteria of the genus Pirellula. Microbiology 143:739-748. [DOI] [PubMed] [Google Scholar]
- 37.Lindsay, M. R., R. I. Webb, M. Strous, M. S. Jetten, M. K. Butler, R. J. Forde, and J. A. Fuerst. 2001. Cell compartmentalisation in Planctomycetes: novel types of structural organisation for the bacterial cell. Arch. Microbiol. 175:413-429. [DOI] [PubMed] [Google Scholar]
- 38.Lunn, M., W. T. Sloan, and T. P. Curtis. 2004. Estimating bacterial diversity from clone libraries with flat rank abundance distributions. Environ. Microbiol. 6:1081-1085. [DOI] [PubMed] [Google Scholar]
- 39.Mazzola, M. 1999. Transformation of soil microbial community structure and Rhizoctonia-suppressive potential in response to apple roots. Phytopathology 89:920-927. [DOI] [PubMed] [Google Scholar]
- 40.McArthur, J. V., D. A. Kovacic, and M. H. Smith. 1988. Genetic diversity in natural populations of a soil bacterium across a landscape gradient. Proc. Natl. Acad. Sci. USA 85:9621-9624. [DOI] [PMC free article] [PubMed] [Google Scholar]
- 41.McIntosh, J. L. 1969. Bray and Morgan soil test extractants modified for testing acid soils from different parent materials. Agron. J. 61:259-265. [Google Scholar]
- 42.Muyzer, G., E. C. Dewaal, and A. G. Uitterlinden. 1993. Profiling of complex microbial populations by denaturing gradient gel electrophoresis analysis of polymerase chain reaction amplified genes coding for 16S ribosomal RNA. Appl. Environ. Microbiol. 59:695-700. [DOI] [PMC free article] [PubMed] [Google Scholar]
- 43.Narang, R., and J. Dunbar. 2004. Modeling bacterial species abundance from small community surveys. Microb. Ecol. 47:396-406. [DOI] [PubMed] [Google Scholar]
- 44.Neef, A., R. Amann, H. Schlesner, and K. H. Schleifer. 1998. Monitoring a widespread bacterial group: in situ detection of Planctomycetes with 16S rRNA-targeted probes. Microbiology 144:3257-3266. [DOI] [PubMed] [Google Scholar]
- 45.Noguez, A. M., H. T. Arita, A. E. Escalante, L. J. Forney, F. Garcia-Oliva, and V. Souza. 2005. Microbial macroecology: highly structured prokaryotic soil assemblages in a tropical deciduous forest. Global Ecol. Biogeogr. 14:241-248. [Google Scholar]
- 46.Norris, T. B., J. M. Wraith, R. W. Castenholz, and T. R. McDermott. 2002. Soil microbial community structure across a thermal gradient following a geothermal heating event. Appl. Environ. Microbiol. 68:6300-6309. [DOI] [PMC free article] [PubMed] [Google Scholar]
- 47.Olsen, G. J., H. Matsuda, R. Hagstrom, and R. Overbeek. 1994. FastDNAml: a tool for construction of phylogenetic trees of DNA sequences using maximum likelihood. Comput. Applic. Biosci. 10:41-48. [DOI] [PubMed] [Google Scholar]
- 48.Pearson, A., M. Budin, and J. J. Brocks. 2004. Phylogenetic and biochemical evidence for sterol synthesis in the bacterium Gemmata obscuriglobus. Proc. Natl. Acad. Sci. USA 101:3991. [DOI] [PMC free article] [PubMed] [Google Scholar]
- 49.Rosenzweig, M. L. 1995. Species diversity in space and time. Cambridge University Press, Cambridge, United Kingdom.
- 50.Rumberger, A., S. R. Yao, I. A. Merwin, E. B. Nelson, and J. E. Thies. 2004. Rootstock genotype and orchard replant position rather than soil fumigation or compost amendment determine tree growth and rhizosphere bacterial community composition in an apple replant soil. Plant Soil 264:247-260. [Google Scholar]
- 51.Saitou, N., and M. Nei. 1987. The neighbor-joining method: a new method for constructing phylogenetic trees. Mol. Biol. Evol. 4:406-425. [DOI] [PubMed] [Google Scholar]
- 52.Schlesner, H., C. Rensmann, B. J. Tindall, D. Gade, R. Rabus, S. Pfeiffer, and P. Hirsch. 2004. Taxonomic heterogeneity within the Planctomycetales as derived by DNA-DNA hybridization, description of Rhodopirellula baltica gen. nov., sp nov., transfer of Pirellula marina to the genus Blastopirellula gen. nov. as Blastopirellula marina comb. nov and emended description of the genus Pirellula. Int. J. Syst. Evol. Microbiol. 54:1567-1580. [DOI] [PubMed] [Google Scholar]
- 53.Schloss, P. D., and J. Handelsman. 2004. Status of the microbial census. Microbiol. Rev. 68:686-691. [DOI] [PMC free article] [PubMed] [Google Scholar]
- 54.Schloss, P. D., B. R. Larget, and J. Handelsman. 2004. Integration of microbial ecology and statistics: a test to compare gene libraries. Appl. Environ. Microbiol. 70:5485-5492. [DOI] [PMC free article] [PubMed] [Google Scholar]
- 55.Sekiguchi, H., N. Tomioka, T. Nakahara, and H. Uchiyama. 2001. A single band does not always represent single bacterial strains in denaturing gradient gel electrophoresis analysis. Biotechnol. Lett. 23:1205-1208. [Google Scholar]
- 56.Stackebrandt, E., W. Liesack, and B. M. Goebel. 1993. Bacterial diversity in a soil sample from a subtropical Australian environment as determined by 16S rDNA analysis. FASEB J. 7:232-236. [DOI] [PubMed] [Google Scholar]
- 57.Storer, D. A. 1984. A simple high sample volume ashing procedure for determination of soil organic matter. Commun. Soil Sci. Plant Anal. 15:759-772. [Google Scholar]
- 58.Strous, M., J. A. Fuerst, E. H. M. Kramer, S. Logemann, G. Muyzer, K. T. van de Pas-Schoonen, R. Webb, J. G. Kuenen, and M. S. M. Jetten. 1999. Missing lithotroph identified as new planctomycete. Nature 400:446-449. [DOI] [PubMed] [Google Scholar]
- 59.Strunk, O., and W. Ludwig. 1997. ARB: a software environment for sequence data, 2.5 ed. Department of Microbiology, Technical University of Munich, Munich, Germany.
- 60.Swofford, D. L. 1991. PAUP, 3.0 ed. Illinois Natural History Survey, Champaign.
- 61.van der Gast, C. J., A. K. Lilley, D. Ager, and I. P. Thompson. 2005. Island size and bacterial diversity in an archipelago of engineering machines. Environ. Microbiol. 7:1220-1226. [DOI] [PubMed] [Google Scholar]
- 62.Ward, N., J. T. Staley, J. A. Fuerst, S. Giovannoni, H. Schlesner, and E. Stackebrandt. 2005, posting date. The order Planctomycetales, including the genera Planctomyces, Pirellula, Gemmata and Isosphaera and the Candidatus genera Brocadia, Kuenenia and Scalindua, 3rd ed. [Online.] Springer-Verlag, Berlin, Germany. http://link.springer-ny.com/link/service/books/10125/.
- 63.Whitaker, R. J., D. W. Grogan, and J. W. Taylor. 2003. Geographic barriers isolate endemic populations of hyperthermophilic Archaea. Science 301:976-978. [DOI] [PubMed] [Google Scholar]
- 64.Whitman, W. B., D. C. Coleman, and W. J. Wiebe. 1998. Prokaryotes: the unseen majority. Proc. Natl. Acad. Sci. USA 95:6578-6583. [DOI] [PMC free article] [PubMed] [Google Scholar]
- 65.Zarda, B., D. Hahn, A. Chatzinotas, W. Schonhuber, A. Neef, R. I. Amann, and J. Zeyer. 1997. Analysis of bacterial community structure in bulk soil by in situ hybridization. Arch. Microbiol. 168:185-192. [Google Scholar]
- 66.Zhou, J., B. Xia, H. Huang, D. S. Treves, L. J. Hauser, R. J. Mural, A. V. Palumbo, and J. M. Tiedje. 2003. Bacterial phylogenetic diversity and a novel candidate division of two humid region, sandy surface soils. Soil Biol. Biochem. 35:915-924. [Google Scholar]
- 67.Zhou, J. Z., M. E. Davey, J. B. Figueras, E. Rivkina, D. Gilichinsky, and J. M. Tiedje. 1997. Phylogenetic diversity of a bacterial community determined from Siberian tundra soil DNA. Microbiology 143:3913-3919. [DOI] [PubMed] [Google Scholar]
- 68.Zhou, J. Z., B. C. Xia, D. S. Treves, L. Y. Wu, T. L. Marsh, R. V. O'Neill, A. V. Palumbo, and J. M. Tiedje. 2002. Spatial and resource factors influencing high microbial diversity in soil. Appl. Environ. Microbiol. 68:326-334. [DOI] [PMC free article] [PubMed] [Google Scholar]