Abstract
In the present study artemisinin (ART) was found to have potent anti-inflammatory effects in animal models of sepsis induced by CpG-containing oligodeoxy-nucleotides (CpG ODN), lipopolysaccharide (LPS), heat-killed Escherichia coli 35218 or live E. coli. Furthermore, we found that ART protected mice from a lethal challenge by CpG ODN, LPS, or heat-killed E. coli in a dose-dependent manner and that the protection was related to a reduction in serum tumor necrosis factor alpha (TNF-α). More significantly, the administration of ART together with ampicillin or unasyn (a complex of ampicillin and sulbactam) decreased mortality from 100 to 66.7% or 33.3%, respectively, in mice subjected to a lethal live E. coli challenge. Together with the observation that ART alone does not inhibit bacterial growth, this result suggests that ART protection is achieved as a result of its anti-inflammatory activity rather than an antimicrobial effect. In RAW264.7 cells, pretreatment with ART potently inhibited TNF-α and interleukin-6 release induced by CpG ODN, LPS, or heat-killed E. coli in a dose- and time-dependent manner. Experiments utilizing affinity sensor technology revealed no direct binding of ART with CpG ODN or LPS. Flow cytometry further showed that ART did not alter binding of CpG ODN to cell surfaces or the internalization of CpG ODN. In addition, upregulated levels of TLR9 and TLR4 mRNA were not attenuated by ART treatment. ART treatment did, however, block the NF-κB activation induced by CpG ODN, LPS, or heat-killed E. coli. These findings provide compelling evidence that ART may be an important potential drug for sepsis treatment.
Sepsis is a potentially lethal condition that results from a harmful or damaging host response to infection (1, 3, 8, 11). Sepsis is triggered by bacteria and bacterial components, such as bacterial DNA (bDNA) and lipopolysaccharide (LPS) (26, 28, 29). Delivery of CpG-containing oligodeoxy-nucleotides (CpG ODN) can trigger sepsis by mimicking the immunostimulatory effects of bDNA and therefore has provided a useful animal model of the sepsis condition (21, 23, 26).
Recent surveys conducted in the United States and in Europe have indicated that approximately 2 to 11% of all hospital and intensive care unit admissions can be attributed to severe sepsis. Despite improvements in supportive care and the increased availability of effective antibacterial agents, hospital mortality rates from severe sepsis and septic shock (50 to 60%) have not improved over recent decades (1, 28). Unfortunately, many experimental inflammatory antagonist-based therapies have failed in sepsis trials, and currently there is only one adjuvant therapy in clinical use, e.g., activated protein C, which targets the coagulation system (28). Thus, it is important to investigate additional inflammatory antagonist-based treatments with the aim of developing a clinically effective antisepsis drug.
Antimalarial drugs such as chloroquine (CQ) and artemisinin (ART) are promising candidates for sepsis treatment. CQ has been demonstrated to protect mice from CpG ODN and LPS challenges in vivo via a mechanism that involves a reduction of proinflammatory cytokine release (14, 18). The protective effects afforded by CQ may be tightly related to interrupting endosome maturation (14, 18). The antimalarial drug ART inhibits the endocytosis of macromolecular tracers by up to 85% in Plasmodium falciparum (15) and may suppress tumor necrosis factor alpha (TNF-α) and interleukin-6 (IL-6) release by inhibiting endocytosis of CpG ODN. ART has traditionally been used to treat malaria (20, 22). It is the active ingredient in the Chinese herb sweet wormwood, and its derivatives include dihydroartemisinin, artesunate, artemether, and arteethe. ART has many applications in addition to treatment of severe malaria, including use as an antitumor agent (22).
In the present study we examined whether ART provides protection against animal models of sepsis. Specifically, we investigated the effects of ART on CpG ODN, LPS, and heat-killed Escherichia coli- or live E. coli-challenged mice in vitro and in vivo and further examined the possible molecular mechanisms involved in ART inhibition of proinflammatory cytokine release.
MATERIALS AND METHODS
Materials.
LPS from E. coli O111:B4, CQ, d-galactosamine (d-GalN), dimethyl sulfoxide (DMSO), and 3-(4,5-dimethylthiazol-2-yl)-2,5-diphenyltetrazolium (MTT) were purchased from Sigma (St. Louis, MO). Ampicillin (AMP) and unasyn (a 2:1 mixture of AMP sodium and sulbactam sodium) were purchased from the North China Pharmaceutical Group Corp. (Shijiazhuang, China). ART was purchased from Wulingshan Pharm (Chongqing, China). For in vitro experiments, ART was dissolved in DMSO to make a stock solution of 320 μg/ml, and the final concentrations of DMSO were 0.5% (vol/vol) in each cell culture plate well. For in vivo experiments, ART was ground down to a fine powder and then added to carboxymethyl cellulose (CMC; China Chengdu Kelong Chemical Reagent Factory) solution. The final concentration of CMC used in the experiments was 0.5% (wt/vol).
Mouse TNF-α and IL-6 enzyme-linked immunosorbent assay (ELISA) kits were purchased from Biosource International (Camarillo, CA). The RNAeasy kit was obtained from QIAGEN (Chatsworth, CA). Avian myeloblastosis virus (AMV) reverse transcriptase and T4 polynucleotide kinase were obtained from Promega (Madison, WI), and [γ-32P]dATP (5,000 Ci/mmol) was purchased from Furui (Beijing, China). CpG ODN 1826 (5′-TCCATGACGTTCCTGATGCT-3′)with a nuclease-resistant phosphorothioate backbone, 6-FAM fluorescein-labeled CpG ODN (6-FAM CpG ODN), and 5′ biotinylated CpG ODN, and all primers were synthesized by Bioasia Biotechnology, Ltd. (Shanghai, China), and were determined to be endotoxin negative by Limulus assays.
Bacterial strain and culture.
E. coli ATCC 35218 cells maintained in our laboratory were used for the murine sepsis model. Single colonies from viable, growing LB agar plates were transferred to sterile liquid LB medium (10 g of tryptone, 10 g of NaCl, and 5 g of yeast extract per liter) and cultivated in 50-ml volumes aerobically at 37°C in a heated, shaking environmental chamber for 12 h. These cultures were then transferred to 500 ml of fresh LB medium for another 12 h. The cells were collected by centrifugation at 9,391 × g for 5 min at 4°C; the pellet was then washed with sterile saline, and the suspension was centrifuged (9,391 × g for 5 min at 4°C). After resuspending the pellet, cell densities were measured by using UV-visible spectrophotometry (absorbency at 600 nm) and adjusted to optical density values of 0.5 (ca. 2.5 × 10⁸ CFU/ml). Finally, bacterial suspensions were incubated in a water bath at 100°C for 10 min in order to inactivate the cells.
MIC determinations.
An overnight strain of E. coli ATCC 35218 was tested against different concentrations of antibiotics and ART in LB medium. The ranges of concentration assayed for drugs were 0.5 to 512 μg/ml. MIC was assayed at 5.0 × 10⁵ CFU/ml by the broth microdilution method according to procedures outlined by the Clinical and Laboratory Standards Institute (formerly National Committee for Clinical Laboratory Standards) (25). Inoculated broth samples in polypropylene 96-well plates (Sigma-Aldrich) were then incubated at 37°C for 24 h. The MIC was taken at the lowest drug concentration at which observable growth was inhibited.
Cell line and culture.
Murine macrophage RAW264.7 cells were purchased from the American Type Culture Collection (Manassas, VA) and cultured in Dulbecco modified Eagle medium (DMEM) supplemented with 10% low endotoxin fetal calf serum (HyClone, Logan, UT), 2 μM glutamine, 100 U of penicillin/ml, and 100 μg of streptomycin/ml in a 37°C humid atmosphere with 5% CO2. The cells were diluted with 0.4% trypan blue in phosphate-buffered saline (PBS; 0.1 mM [pH 7.2]), and live cells were counted with a hemacytometer. In each experiment, 106 cells/ml were used, except where otherwise indicated.
Mouse sepsis model and in vivo cytokine assays.
BALB/c mice (4 to 8 weeks old) were obtained from the Experimental Animal Center of The Chongqing Medical University (Chongqing, People's Republic of China). All experiments were conducted in accordance with the National Guidelines for the Care and Use of Laboratory Animals. Equal numbers of male and female mice were used. During experiments, d-GalN sensitization is used to reduce the amount of bDNA or CpG ODN (13). ART (5% [wt/vol]) was administered orally in all animal experiments; the total volume was 0.4 ml per 20 g of body weight; and 0.2 ml per 20 g of body weight of CpG ODN, LPS, heat-killed E. coli, or live E. coli and antibiotics was injected intravenously.
In the first series of experiments, mice were challenged with CpG ODN, LPS, or heat-killed E. coli. A total of 175 mice were weighed on the day of the experiment, and their average weight was 19.2 ± 2.1 g. For the CpG ODN challenge, mice were randomly divided into five groups (n = 10 animals per group), and all mice except for those in the control group were preinoculated with d-GalN (intraperitoneally, 600 mg/kg [weight]) 1 h before the experiment. Mice were divided into the following treatment groups: (i) saline injection only, (ii) CpG ODN (10 mg/kg), (iii) low dose of ART (50 mg/kg, orally) and immediate subsequent CpG ODN injection, (iv) medium dose of ART (100 mg/kg) and immediate subsequent CpG ODN injection, and (v) high dose of ART (200 mg/kg) and immediate subsequent CpG ODN injection.
For the LPS challenge, mice were randomly divided into the following five treatment groups (n = 15 animals per group): (i) saline injection only; (ii) LPS (10 mg/kg); (iii) low dose of ART (50 mg/kg, orally) and immediate subsequent LPS injection; (iv) medium dose of ART (100 mg/kg) and immediate subsequent LPS injection; and (v) high dose of ART (200 mg/kg) and immediate subsequent LPS injection. For the heat-killed E. coli challenge, mice were randomly divided into the following five treatment groups (n = 10 animals per group): (i) saline injection only; (ii) heat-killed E. coli (1.5 × 10¹¹ CFU/kg); (iii) low dose of ART (50 mg/kg, orally) and immediate subsequent injection of heat-killed E. coli; (iv) medium dose of ART (100 mg/kg) and immediate subsequent injection of heat-killed E. coli; and (5) high dose of ART (200 mg/kg) and immediate subsequent injection with heat-killed E. coli. All mice were observed for 7 days posttreatment, and general health and mortality were noted.
In the second series of experiments, 48 mice were weighed on the day of the experiment, and the average weight was 18.9 ± 2.0 g. Mice were randomly divided into the following eight treatment groups (n = 6 animals per group): (i) saline injection only; (ii) orally administered ART (200 mg/kg) and saline injection; (iii) CpG ODN (10 mg/kg); (iv) ART (200 mg/kg) and immediate subsequent injection of CpG ODN; (v) LPS (10 mg/kg); (vi) ART (200 mg/kg) and immediate subsequent LPS injection; (vii) heat-killed E. coli (1.5 × 10¹¹ CFU/kg); and (viii) ART (200 mg/kg) and immediate subsequent injection of heat-killed E. coli. At 4 h after stimulator injection, 0.5 ml of blood was collected from each mouse. The serum was separated and stored at −80°C for subsequent TNF-α assay using mouse ELISA kits.
In the third series of experiments, mice were challenged with live E. coli. A total of 48 mice were weighed on the day of the experiment, and their average weight was 19.8 ± 1.2 g. Seven groups (n = 6 animals per group) of mice were challenged with live E. coli as follows: (i) saline injection only; (ii) live E. coli (2.5 × 10⁸ CFU/kg); (iii) orally administered ART (100 mg/kg) and immediate subsequent injection of live E. coli; (iv) 400 mg of AMP/kg and immediate subsequent injection of live E. coli; (v) ART (100 mg/kg), with immediate subsequent injection of both 400 mg of AMP/kg and live E. coli; (vi) 600 mg of unasyn/kg (400 mg of AMP/kg) and immediate injection of live E. coli; and (vii) 600 mg of unasyn/kg and immediate injection of both live E. coli and ART (100 mg/kg).
In vitro cytokine release assays.
In dose-dependent experiments, RAW264.7 cells (106 cells/m, 0.4 ml) plated in 48-well plates were preincubated with 5 to 80 μg of ART/ml for 2 h and then stimulated with LPS (0.1 μg/ml), CpG ODN (10 μg/ml), or heat-killed E. coli (3.5 × 10⁷ CFU/ml) for 4 or 6 h. In time-dependent experiments, RAW264.7 cells were either preincubated with 40 μg of ART/ml 2 or 4 h prior to the addition of the specified stimulator, simultaneously treated with ART and stimulators, or treated with ART 1 or 2 h after the addition of the specified stimulating agent: LPS (0.1 μg/ml), CpG ODN (10 μg/ml), or heat-killed E. coli (3.5 × 10⁷ CFU/ml). After incubation for another 4 or 6 h, the cells were centrifuged, and 0.1 ml of supernatant was collected for TNF-α or IL-6 assay.
MTT assay.
RAW264.7 cells (5 × 10⁴ cells/ml, 0.2 ml) plated in 96 wells were incubated overnight and then further incubated for 4 h with ART in the range of 0 to 320 μg/ml. Cells were then washed twice in PBS, and 180 μl of fresh medium and 20 μl of MTT (5 mg/ml) was added to each well, followed by incubation for another 4 h. The cells were then centrifuged at 138 × g for 5 min at 4°C, the supernatant was removed, and 150 μl of DMSO was added to each well. MTT crystals were completely solubilized with libration for 10 min. Optical density values were determined at 490 nm.
Affinity assessment.
Lipid A was immobilized on the surface of a hydrophobic cuvette (Thermo Labsystem) as described previously (17). Biotinylated CpG ODN was then immobilized on the surface of a streptavidin-coated biotin cuvette according to the manufacturer's instructions. Briefly, 5 μl of biotinylated CpG ODN and 45 μl of PBST (PBS containing 0.05% Tween 20 [pH 7.4]) were added to the cuvette and allowed to bind for about 5 min. The cuvette was then washed three times with 50 μl of PBST, and baseline data were collected for approximately 3 min. After lipid A or CpG ODN molecules were immobilized on the surface of the hydrophobic cuvette, 5 to 40 μg of ART/ml was added and a binding curve was generated. Kd values were measured with an Affinity Sensors IAsys cuvette system. Additional analyses were performed with the FASTplot and FASTfit software packages (Thermo Labsystem).
Binding and internalization of 6-FAM CpG ODN.
Cell surface DNA binding and internalization experiments were performed as described previously (30). Briefly, RAW264.7 cells (106 cells/ml, 0.5 ml) were preincubated with a range of concentrations of ART (5 to 40 μg/ml) or CQ (50 μg/ml) for 2 h, and 10 μg of 6-FAM CpG ODN/ml was added. Cells were further cultured in the dark at 4°C for 0.5 h (for binding) or for 1 h at 37°C (for internalization). After incubation, the cells were washed twice with PBS and resuspended in 500 μl of PBS. Cells were analyzed with a FACScan flow cytometer (Becton Dickinson, San Jose, CA). The fluorescence intensity was analyzed with CELLQuest software (Becton Dickinson).
TLR9 and TLR4 mRNA expressions.
RAW264.7 cells (2 × 10⁶/ml, 2 ml) plated in 24-well polystyrene plates were incubated in the absence or presence of 40 μg of ART/ml for 2 h at 37°C. Cells were then recultured for 4 h with CpG ODN (10 μg/ml), LPS (0.1 μg/ml), or heat-killed E. coli (3.5 × 10⁷ CFU/ml). After removal of the medium and washing the cells once with sterile PBS, total RNA was purified with an RNAeasy kit according to the manufacturer's instructions (QIAGEN, Valencia, CA). After DNase I treatment, 2 μg of RNA was reverse transcribed with AMV reverse transcriptase, and 2 μl of cDNA was subjected to 33 cycles of PCR. A master mix containing reaction buffer, deoxynucleoside triphosphates, Taq polymerase, and 2 μl of cDNA per 25 μl of reaction mixture was distributed into PCR tubes. Forward and reverse primers corresponding to different individual genes were added to the PCR tubes and subjected to PCR amplification using primer sets designed against β-actin, TLR9, and TLR4. The reactions were run for 34 cycles. Temperatures and times were 51°C for 30 s for annealing and 94°C for 30 s for denaturing, followed by extension at 72°C for 20 s. The PCR products were determined by using 1.5% agarose gel electrophoresis and ethidium bromide staining. Images of the gels were analyzed by Quantity One software (Bio-Rad, California), which compares the relative density of objective strap and β-actin. The PCR primers were designed by Primer Premier 5 software (PREMIER Biosoft International, California) and synthesized by Bioasia Biotechnology, Ltd. (Shanghai, People's Republic of China). The primers used were as follows: for TLR4 (285-bp product), forward (5′-TTTATTCAGAGCCGT TGG-3′) and reverse (5′-TGCCGT TTC TTG TTC-3′); for TLR9 (287-bp product), forward (5′-TGGACGGGAACT GCTACT-3′) and reverse (5′-GCCACATTCTATACA GGGATT-3′); and for mouse β-actin (455-bp product), forward (5′-CCCTGTATG CCTCTGGTC-3′) and reverse (5′-TTTACGGATGTCAACG-3′).
EMSA of NF-κB.
RAW264.7 cells (2 × 10⁶ cells/ml, 2 ml) were plated in six-well plates for 6 h, and then the supernatants were discarded and 2 ml of fresh DMEM without fetal calf serum was added. The cells were harvested after a 24-h incubation with CpG ODN (10 μg/ml), LPS (0.1 μg/ml), or heat-killed E. coli (3.5 × 10⁷ CFU/ml). Nuclear proteins were then extracted, and an electrophoretic mobility shift assay (EMSA) was performed as previously described (14).
Statistics and presentation of data.
The chi-squared test was used to analyze the significance of mouse mortality differences among groups. Cytokine concentrations are expressed as means ± the standard deviation. Each experiment was repeated a minimum of three times, and each datum point represents the mean of at least three parallel samples. The Student t test was used to examine the differences in cytokine concentrations in the cell supernatants and fluorescence intensity. A P value of <0.05 was considered significant, and a value of <0.01 was considered very significant; values of >0.05 were considered not significant.
RESULTS
ART protects mice from challenge by CpG ODN, LPS, or heat-killed E. coli by decreasing proinflammatory cytokine release.
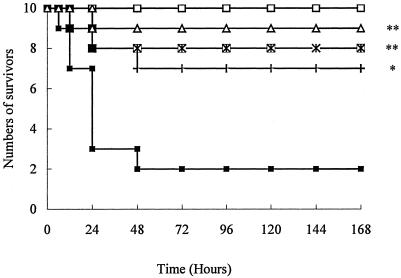
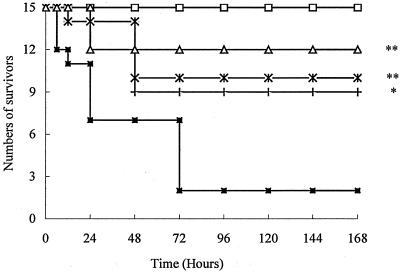
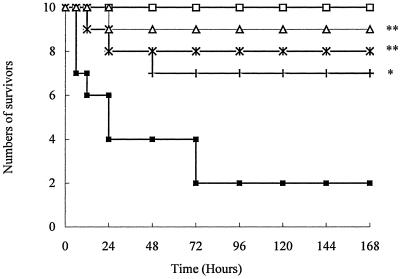
About 80% of the mice challenged with CpG ODN, LPS, or heat-killed E. coli died within the first 24 h. In contrast, only 30 to 40% of mice in the groups treated with 50 mg of ART/kg prior to challenge died within 48 h. The larger doses of ART, 100 and 200 mg/kg, provided even as high as 90% protection from the lethal challenges (Fig. 1, 2, and 3).
FIG. 1.
Survival of mice challenged with CpG ODN. Mice were randomly divided into five groups (n = 10 animals per group) and preinoculated with d-GalN (i.p., 600 mg/kg [weight]) 1 h before the experiment. Treatment groups are indicated by symbols as follows: □, saline alone; ▪, CpG ODN (10 mg/kg); +, CpG ODN and ART (50 mg/kg); ×, CpG ODN and ART (100 mg/kg); and ▵, CpG ODN and ART (200 mg/kg). *, P < 0.01; **, P < 0.05 versus the CpG ODN group.
FIG. 2.
Survival of mice challenged with LPS. The mice were randomly divided into five groups (n = 15 animals per group): □, saline alone; ▪, LPS (10 mg/kg); +, LPS and ART (50 mg/kg); ×, LPS and ART (100 mg/kg); and ▵, LPS and ART (200 mg/kg). *, P < 0.01; **, P < 0.05 versus the LPS group.
FIG. 3.
Survival of mice challenged with heat-killed E. coli. The mice were randomly divided into five groups (n = 10 animals per group): □, saline alone; ▪, heat-killed E. coli (1.5 × 10¹¹ CFU/kg); +, ART (50 mg/kg) and heat-killed E. coli; ×, ART (100 mg/kg) and heat-killed E. coli; and ▵, ART (200 mg/kg) and heat-killed E. coli. *, P < 0.01; **, P < 0.05 versus heat-killed E. coli.
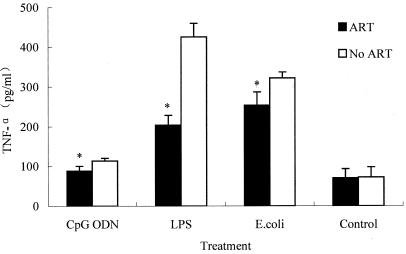
The release of a combination of several cytokines acts as a good indicator of sepsis and SIRS (28, 30). For example, TNF-α is thought to be an early-released cytokine during sepsis. Thus, serum levels were tested to determine whether the protective effects of ART may be related to decreased cytokine release in mice. We found that TNF-α levels were higher in serum from mice challenged with CpG ODN, LPS, or heat-killed E. coli than in the control group. However, pretreatment with 200 mg of ART/kg significantly reduced TNF-α release (Fig. 4).
FIG. 4.
ART decreased the serum TNF-α release (pg/ml) after CpG ODN, LPS, and heat-killed E. coli challenge. Mice were intravenously injected with CpG ODN (10 mg/kg), LPS (10 mg/kg), or heat-killed E. coli (1.5 × 10¹¹ CFU/kg) in the absence or presence of 200 mg of ART/kg orally administered, and 0.5 ml of blood per mouse was drawn after challenge for 4 h. The serum was stored at −80°C for subsequent TNF-α assays using mouse ELISA kits. *, P < 0.05 versus groups receiving no ART treatment. The datum points are presented as means ± the standard deviation. The experiment was repeated three times.
ART with antibiotics has synergistic protective effects on mice challenged by live E. coli.
To further confirm ART's apparent ability to protect mice challenged with live bacteria, mice were injected with live E. coli. In this live bacterial sepsis model mortality was significantly reduced from 100% to 66.7% or 33.3% when mice were treated with ART (100 mg/kg) in combination with AMP or unasyn, respectively. Mice treated with ART alone or AMP alone did not exhibit a decrease in mortality after a live E. coli challenge. Unasyn treatment alone could, however, protect mice challenged with live E. coli, and mortality in this group was 33.3% (Table 1).
TABLE 1.
Survival of mice challenged with live E. colia
| Treatment | No. of animals
|
Survival (%)b | |
|---|---|---|---|
| Total | Deaths | ||
| Saline | 6 | 0 | 100 |
| E. coli | 6 | 6 | 0 |
| AMP + E. coli | 6 | 6 | 0 |
| ART + E. coli | 6 | 6 | 0 |
| ART + E. coli + AMP | 6 | 4 | 33.3* |
| Unasyn + E. coli | 6 | 4 | 33.3* |
| ART + E. coli + unasyn | 6 | 2 | 66.7*† |
In a concurrent experiment seven groups of mice (n = 6 animals per group) were challenged with live E. coli as follows: (i) saline control; (ii) live E. coli (2.5× 10⁸ CFU/kg, intravenously); (iii) ART (100 mg/kg) and live E. coli; (iv) 400 mg of AMP/kg and live E. coli; (v) 400 mg of AMP/kg, ART at 100 mg/kg, and live E. coli; (vi) 600 mg of unasyn/kg and live E. coli; or (vii) 600 mg of unasyn/kg, live E. coli, and ART at 100 mg/kg. The total injection volume was 0.2 ml per 20 g of body weight.
*, P < 0.05 versus E. coli; †, P < 0.05 versus unasyn plus E. coli.
ART has no antibacterial activity in vitro.
The MICs of AMP and unasyn for E. coli were 64 and 8 μg/ml, respectively. ART had no antibacterial activity even at the concentration more than 512 μg/ml. The combination of ART (0.5 to 512 μg/ml) with AMP or unasyn could not increase the antibacterial activities of either antibacterial agent.
ART reduces cytokine releases in vitro.
RAW264.7 cells were stimulated with CpG ODN, LPS, or heat-killed E. coli, and the TNF-α and IL-6 levels in the supernatant were measured. RAW264.7 cells produced abundant amounts of TNF-α and IL-6 in response to CpG ODN, LPS, and heat-killed E. coli. When ART was added prior to the stimulators, cytokine release was potently attenuated in response to the three stimulators in a dose-dependent manner (Tables 2 and 3). Furthermore, when ART was added after the stimulators, cytokine release was also suppressed, albeit to a lesser degree than when it was added before stimulation. These data indicate that ART suppresses CpG ODN- and LPS-induced cytokine release in vitro in a dose- and time-dependent manner.
TABLE 2.
Dose-dependent ART effects on TNF-α and IL-6 release from RAW264.7 cells induced by CpG ODN, LPS, or heat-killed E. colia
| Treatment | Concn (μg/ml) | Mean cytokine release (pg/ml) ± SD
|
|||||
|---|---|---|---|---|---|---|---|
| CpG ODN
|
LPS
|
Heat-killed E. coli
|
|||||
| TNF-α | IL-6 | TNF-α | IL-6 | TNF-α | IL-6 | ||
| ART | 0 | 3,363.1 ± 192.3 | 1,630.7 ± 15.2 | 1,770.0 ± 87.0 | 1,528.7 ± 55.8 | 3,951.0 ± 60.5 | 1,054.8 ± 72.1 |
| 5 | 1,948.2 ± 110.8* | 1,040.5 ± 75.5* | 1,709.0 ± 35.1 | 820.4 ± 100.8* | 2,801.8 ± 268.1* | 488.5 ± 56.5* | |
| 10 | 1,905.6 ± 140.5** | 950.2 ± 26.5** | 1,469.7 ± 109.4** | 530.9 ± 140.1** | 2,345.3 ± 183.4** | 295.4 ± 45.5** | |
| 20 | 1,884.6 ± 60.1* | 890.7 ± 68.2** | 1,279.6 ± 98.3** | 411.9 ± 110.7** | 2,203.9 ± 45.1** | 293.0 ± 48.2** | |
| 40 | 1,554.6 ± 161.6** | 810.1 ± 105.6** | 928.0 ± 102.5** | 370.3 ± 130.5** | 2,037.0 ± 48.9** | 230.7 ± 24.5** | |
| 80 | 907.5 ± 140.4** | 710.1 ± 150.1** | 829.5 ± 31.8** | 358.0 ± 14.1** | 1,578.4 ± 122.5** | 184.8 ± 13.8** | |
| Medium only | 40.2 ± 32.0 | 74.2 ± 10.1 | 42.6 ± 6.4 | 46.6 ± 3.1 | 377 ± 29.0 | 24.6 ± 3.9 | |
RAW264.7 cells (106/ml) were pretreated for 2 h with the indicated concentrations of ART and then incubated with 10 μg of CpG ODN/ml or LPS (0.1 μg/ml) and heat-killed E. coli (3.5 × 10⁷ CFU/ml) or medium only for another 2 or 4 h. The relative concentrations of TNF-α and IL-6 in the cell-free supernatants were determined by a quantitative ELISA assay. The experiment was repeated three times. *, P < 0.05; **, P < 0.01 versus ART = 0.
TABLE 3.
Time-dependent ART effects on TNF-α and IL-6 release from RAW264.7 cells induced by CpG ODN, LPS, or heat-killed E. colia
| Treatment | Time (h) | Mean cytokine release (pg/ml) ± SDb
|
|||||
|---|---|---|---|---|---|---|---|
| CpG ODN
|
LPS
|
Heat-killed E. coli
|
|||||
| TNF-α | IL-6 | TNF-α | IL-6 | TNF-α | IL-6 | ||
| ART addition | −4 | 1,231.5 ± 272.1** | 233.5 ± 29.5** | 1,314.5 ± 212.4** | 100.6 ± 19.9** | 1,376.9 ± 24.1** | 258.8 ± 26.8** |
| −2 | 1,648.1 ± 17.2** | 349.5 ± 39.5** | 1,096.6 ± 117.9** | 93.4 ± 15.9** | 847.0 ± 134.9** | 292.7 ± 74.2** | |
| 0 | 1,450.6 ± 61.9** | 429.6 ± 11.5** | 1,288.9 ± 104.3** | 104.8 ± 7.2** | 2,020.1 ± 57.0** | 893.2 ± 75.7* | |
| 1 | 1,802.6 ± 21.2* | 584.7 ± 49.6** | 959.8 ± 71.3* | 96.4 ± 12.3* | 2,004.0 ± 76.5* | 877.2 ± 86.7* | |
| 2 | 1,848.8 ± 222.3 | 873.2 ± 92.8* | 1,657.9 ± 23.0 | 155.5 ± 43.8 | 2,734.4 ± 41.5* | 925.3 ± 32.5 | |
| No ART | 2,491.4 ± 141.5 | 861.5 ± 90.5 | 2,136.2 ± 23.4 | 379.5 ± 55.7 | 2,562.9 ± 155.0 | 942.1 ± 11.0 | |
| Medium | 77.6 ± 31.5 | 241.5 ± 29.6 | 53.3 ± 10.6 | 90.7 ± 6.8 | 49.1 ± 11.5 | 240.8 ± 28.2 | |
RAW264.7 cells (106/ml) were preincubated with 40 μg of ART/ml 2 or 4 h prior to, coincident with (0 h), or 1 or 2 h after the addition of the stimulator LPS (0.1 μg/ml), CpG ODN (10 μg/ml), or heat-killed E. coli (3.5 × 10⁷ CFU/ml). After incubation for another 2 or 4 h, the cells were centrifuged, and 0.1 ml of supernatant was collected for TNF-α or IL-6 assay with the corresponding ELISA kits. The experiment was repeated three times. *, P < 0.05; **, P < 0.01 versus no ART.
ART cannot directly bind to CpG ODN or LPS.
ART can reduce cytokine release induced by CpG ODN and LPS; however, it remains unclear whether ART's effects are related to its binding to CpG ODN or LPS. If binding occurs in vitro, LPS or CpG ODN are neutralized and cytokine release is inhibited. Using biosensor technology, we found that ART did not directly bind CpG ODN or lipid A (data not shown), indicating that ART-mediated inhibition of proinflammatory cytokine release is not related to its ability to bind to CpG ODN or LPS.
ART has no influence on CpG ODN binding to the cell surface or accumulation within RAW264.7 cells.
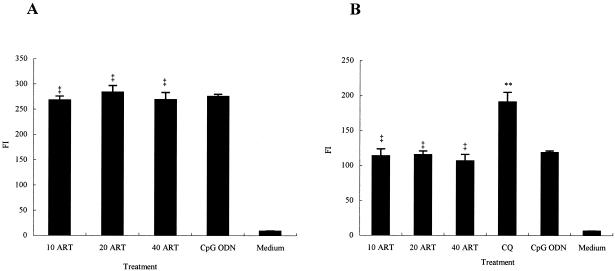
Uptake of CpG ODN into endosomes is required for TLR9 recognition in macrophages and monocytes (10, 12, 21). Before TLR9 recognizes CpG ODN, CpG ODN binding and internalization processes are required (5). Our flow cytometry results showed that ART had no effect on the binding of 6-FAM CpG ODN to the cell surface or on accumulation within RAW264.7 cells (Fig. 5), which indicated that ART-induced inhibition of proinflammatory cytokine release was not related to inhibition of binding and accumulation of CpG ODN.
FIG. 5.
Binding (A) and internalization (B) of CpG ODN 1826 to RAW264.7 cells treated with ART. RAW264.7 cells (2 × 10⁶/ml) were pretreated for 2 h with ART (10, 20, or 40 μg/ml) or 50 μg of CQ/ml in 12-well plates and then incubated with 10 μg of CpG ODN 1826/ml in the dark at 4°C for 30 min (A) or at 37°C for 1 h (B). Cells left untreated served as controls (medium). After incubation, the cells were washed twice with ice-cold PBS and then resuspended in PBS for assay. Fluorescence intensity (FI) was analyzed by FACScan. ‡, P > 0.05; **, P < 0.05 versus the CpG ODN. Error bars indicate the mean ± the standard deviation. Each experiment was repeated at least three times.
ART doesn't reduce the expression of TLR9 and TLR4 mRNA.
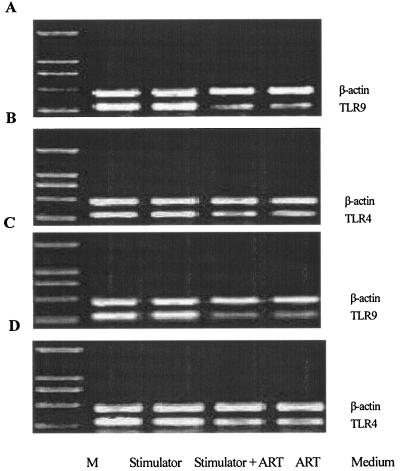
Signaling by TLR family members is required for CpG ODN and LPS to induce cytokine release (13, 16). In macrophages and monocytes, TLR9 is a pattern recognition receptor for CpG ODN (13, 27), whereas TLR4 is a pattern recognition receptor for LPS (16). Because several lines of evidence suggest that the molecular recognition of CpG ODN occurs within the cell, we investigated the mRNA expression of TLR9 and TLR4 in ART-treated cells. In agreement with previous results (14), TLR9 or TLR4 mRNA in nonstimulated RAW264.7 cells were expressed at low levels. CpG ODN and LPS elevated TLR9 and TLR4 mRNA expression significantly, and pretreatment of the cells with ART did not change the expression levels. In addition, heat-killed E. coli stimulated TLR4 and TLR9 expression levels, and these were not attenuated markedly by pretreatment with ART (Fig. 6).
FIG. 6.
Effect of ART on TLR4 and TLR9 mRNA expression in stimulated RAW264.7 cells. RAW264.7 cells (106/ml) were pretreated for 2 h with 40 μg of ART/ml and then incubated with 10 μg of CpG ODN 1826/ml (A), 0.1 μg of LPS/ml (B), or 3.5 × 10⁷ CFU of heat-killed E. coli/ml (C and D). Total RNA was prepared with the RNAeasy kit. After DNase I treatment, 2 μg of RNA was reverse transcribed with AMV reverse transcriptase, and 2 μl of cDNA was subjected to 33 cycles of PCR with suitable primers; β-actin, TLR9, and TLR4 were amplified. Molecular weight markers (M) were 2,000, 1,000, 750, 500, and 250 bp from upper to lower.
ART blocks NF-κB activation.
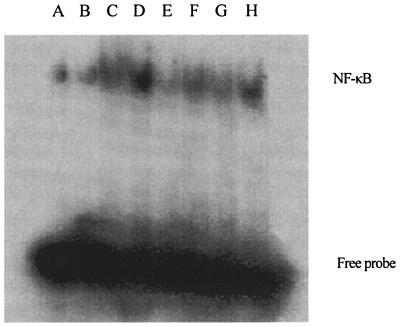
By EMSA, we found that CpG ODN, LPS, and heat-killed E. coli activated NF-κB (Fig. 7), suggesting that the nuclear transcription factor is involved in the observed cytokine release. Pretreatment with ART uniformly blocked activation of NF-κB induced by CpG ODN, LPS, or heat-killed E. coli. These results suggest that the observed inhibition of proinflammatory cytokine release may be associated with the ART-induced block of NF-κB.
FIG. 7.
Inhibition of ART on NF-κB activation induced by CpG ODN, LPS, and heat-killed E. coli. RAW264.7 cells (106/ml) were left untreated (medium only [lane A]), incubated with 40 μg of ART/ml for 2 h (ART [lane B]), or pretreated with the indicated concentration of ART and then incubated with 10 μg of CpG ODN 1826/ml (lane C), 0.1 μg of LPS/ml (lane E), or 3.5 × 10⁷ CFU/ml of heat-killed E. coli (lane G) or else treated with only CpG ODN 1826 (lane D), 0.1 μg of LPS/ml (lane F), or 3.5 × 10⁷ CFU of heat-killed E. coli/ml (lane H) for another 4 h. The cells were collected, and nuclear protein extracts were examined for NF-κB p65 activation by EMSA.
ART has little cellular toxicity in vitro.
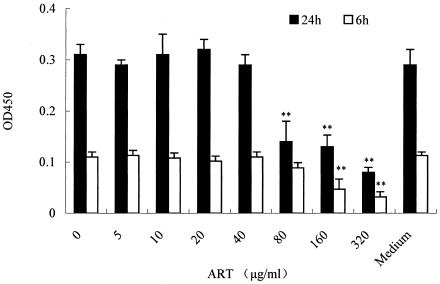
MTT assay revealed that the concentration of DMSO (0.5% [vol/vol]) in which ART was dissolved did not affect the morphological features or growth of RAW264.7 cells. Although in a concentration range of 5 to 80 μg/ml and incubated for 6 h or 24 h, ART did not influence cell viability, at more than 80 μg of ART/ml and with a 24-h incubation ART may be cytotoxic (Fig. 8). The concentration of ART used in our in vitro experiments was less than 80 μg/ml, and the results suggest there is no correlation between the ART-induced inhibition of cytokine release and cytotoxicity.
FIG. 8.
Cytotoxicity of ART on RAW264.7 cells. After overnight culture in a 96-well culture plate, cells (104 cells/well in DMEM) were washed and incubated with various concentrations of ART for 6 or 24 h. Subsequently, 20 μl of MTT solution (5 mg/ml in PBS) were added in a total volume of 200 μl of medium. Cells were incubated for 4 h at 37°C and 5% CO2; the supernatant was then removed, and 150 μl of DMSO was added to each well to dissolve the produced formazan crystals. The extinction was measured at 490 nm by using a microplate reader. *, P < 0.05; **, P < 0.01 versus medium only group. The datum points are presented as means ± the standard deviation. The experiment was repeated three times. OD450, optical density at 450 nm.
DISCUSSION
We have shown here for the first time, to our knowledge, that ART can act in synergy with antibiotics to protect against a lethal live E. coli challenge by decreasing the release of proinflammatory cytokines.
In the present study, mice were challenged by pure LPS or CpG ODN or by heat-killed E. coli. Heat-killed E. coli lacks viability, but bDNA and LPS still exist in the cells. Therefore, the sepsis model made using heat-killed E. coli represents the ability of E. coli to induce sepsis. We found that mice pretreated with ART had a higher survival rate no matter whether they were challenged with LPS or CpG ODN or heat-killed E. coli. This protection is correlated with the ability of ART to inhibit the release of proinflammatory cytokines, such as serum TNF-α, which are known to be involved in sepsis.
Indeed, since sepsis is mostly caused by live bacteria, a sepsis model using live E. coli is a better approximation of the septic patient in the clinic. In the present study, E. coli ATCC 35218 was used. E. coli ATCC 35218 was well known for a β-lactamase-producing isolate (6). In vitro, the MICs of AMP and unasyn for the strain were 32 and 8 μg/ml, respectively. The difference in antibacterial activity between AMP and unasyn might result from the inactivation of AMP by β-lactamase from E. coli. In vivo, although AMP or ART alone did not protect mice challenged with live E. coli, the combination of ART and AMP did lead to a decrease in acute sepsis mortality. Unasyn alone could protect mice challenged with live E. coli because of its strong bactericidal activity, but ART also could increase the protection of unasyn. The findings that ART did not inhibit bacterial growth at an even higher concentration (>512 μg/ml), even in combination with AMP or unasyn, suggest that the synergistic protection for sepsis by ART combination with antibiotics is more likely to be closely related to the anti-inflammatory effects of ART rather than an antibacterial effect.
In all experiments, the prestimulation with oral administration of ART provided some level of protection from the challenges. When administered after stimulation, however, the drug's potency was not manifest (data not shown). Obviously, in the clinic the occurrence of infection cannot be predicted. In the present study we only examined a single postinfection administration protocol; however, if ART was administered many times it may work well postinfection. Indeed, our preliminary results (data not shown) of ongoing follow-up studies examining postinfection protocols are encouraging.
Previous studies have shown that ART shares with other sesquiterpene lactones the ability to inhibit nitric oxide synthesis in cytokine-stimulated human astrocytoma T67 cells (1). However, there have been no prior reports on the effects of ART on proinflammatory cytokines. As demonstrated in our in vitro experiments, ART exhibits powerful inhibition potency on proinflammatory cytokines in a dose-dependent manner in murine macrophage RAW264.7 cells. In the present study, the dose was selected according to studies on cancer and malaria (7, 19). Although the lowest dose of ART (5 μg/ml) is higher than the peak concentration of ART in plasma (402 ng/ml from mice in our lab and 500 ng/ml from humans in a previous study [4]), we think there is a difference between the in vitro and in vivo results. The results from in vitro studies cannot completely represent the in vivo truth. The cells in the human body may be more sensitive to the drug.
In addition, although ART added after the stimulators inhibited less cytokine release than that added prior to the stimulators, our results indicate that ART suppresses CpG ODN- and LPS-induced cytokine release in vitro in a time-dependent manner. Although there are several stimulators in the suspension of heat-killed E. coli, ART also inhibits TNF-α and IL-6 releases induced by heat-killed E. coli. Thus, our results suggest that ART is a strong inhibitor of many stimulators and may provide an important means for treating sepsis.
Endocytosis or internalization is a fundamental process of eukaryotic cells and fulfills numerous functions. Malaria parasites invade red blood cells and during their intracellular development endocytose large amounts of host cytoplasm for digestion in a specialized lysosomal compartment called the food vacuole. Heinrich et al. demonstrated that ART inhibits endocytosis of macromolecular tracers by up to 85% in Plasmodium falciparum (15).
Uptake of CpG ODN into endosomes is required for the recognition of TLR9. TLR9 recognizes CpG ODN in the mature endosomes of macrophages and monocytes, and CpG ODN binding and internalization processes are required for cell activation (14). Increased cell surface DNA binding and internalization could increase RAW264.7 macrophage cytokine release (24) and vice versa. Therefore, it is possible that ART-induced suppression of TNF-α and IL-6 release might be related to the inhibition of cell surface DNA binding and the internalization of CpG ODN. However, in contrast to the findings in P. falciparum, our results showed that ART does not influence binding and internalization of CpG ODN in RAW264.7 cells.
CpG ODN activates the TLR9-mediated signal transduction pathway to regulate the release of cytokines. Although previous studies showed a correlation among cytokine release, the uptake of CpG ODN, and TLR9 expression (30), our data indicate that decreased cytokine release by ART is not associated with decreased CpG ODN uptake and TLR9 expression. LPS-induced signal transduction in macrophages is mediated by TLR4 on the cell surface (16). Our data demonstrate that ART can inhibit LPS-induced proinflammatory cytokine release; however, ART cannot block LPS-induced TLR4 mRNA expression.
NF-κB is an important downstream regulator of the expression of various proinflammatory cytokines induced by CpG ODN and LPS (1, 2, 9, 11, 31). In 2003, Aldieri et al. reported that ART blocks a mix containing LPS and cytokine-induced activation of NF-κB in human astrocytoma T67 cells (1). By EMSA, we found that CpG ODN, LPS, and heat-killed E. coli activated NF-κB (Fig. 7), whereas little NF-κB was activated in the absence of stimulators, suggesting that a nuclear transcription factor is involved in the observed cytokine release. Pretreatment with ART uniformly blocked NF-κB activation induced by CpG ODN, LPS, or heat-killed E. coli. These results suggest that inhibition of proinflammatory cytokine release may be associated with the ART-induced blockade of NF-κB in RAW264.7 cells.
The inhibitory effects of ART on CpG ODN- and LPS-induced cytokine release are unlikely due to its nonspecific cellular toxicity. ART treatment did not affect RAW264.7 cell viability as measured by MTT assay. More importantly, in mice treated with ART, we did not observe any side effects, such as liver or kidney dysfunction (data not shown). We have shown in our laboratory that the concentration of ART in plasma at 1 h (402 ng/ml after a single dose of ART treatment [100 mg/kg]) is similar to that (500 ng/ml) reported in healthy adult males given ART (4). Thus, the doses of ART used in our study are comparable to that used for malaria treatment. Therefore, ART should be considered a safe putative candidate for development into a sepsis treatment.
Acknowledgments
This study was supported by grant 30572365 from the National Natural Science Foundation of China and a grant from Sci-Tech of Chongqing.
REFERENCES
- 1.Aldieri, E., D. Atragene, L. Bergandi, C. Riganti, C. Costamagna, A. Bosia, and D. Ghigo. 2003. Artemisinin inhibits inducible nitric oxide synthase and nuclear factor NF-κB activation. FEBS Lett. 552:141-144. [DOI] [PubMed] [Google Scholar]
- 2.An, H., H. Xu, Y. Yu, M. Zhang, R. Qi, X. Yan, S. Liu, W. Wang, Z. Guo, Z. Qin, and X. Cao. 2002. Up-regulation of TLR9 gene expression by LPS in mouse macrophages via activation of NF-κB, ERK and p38 MAPK signal pathways. Immunol. Lett. 81:165-169. [DOI] [PubMed] [Google Scholar]
- 3.Angus, D. C., W. T. Linde-Zwirble, J. Lidicker, G. Clermont, J. Carcillo, and M. R. Pinsky. 2001. Epidemiology of severe sepsis in the United States: analysis of incidence, outcome, and associated costs of care. Crit. Care Med. 29:1303-1310. [DOI] [PubMed] [Google Scholar]
- 4.Ashton, M., T. Gordi, N. H. Trinh, V. H. Nguyen, D. S. Nguyen, T. N. Nguyen, X. H. Dinh, M. Johansson, and D. C. Le. 1998. Artemisinin pharmacokinetics in healthy adults after 250, 500, and 1000 mg single oral doses. Biopharm. Drug Dispos. 19:245-250. [DOI] [PubMed] [Google Scholar]
- 5.Bennett, R. M., G. T. Gabor, and M. M. Merritt. 1985. DNA binding to human leukocytes: evidence for a receptor-mediated association, internalization, and degradation of DNA. J. Clin. Investig. 76:2182-2190. [DOI] [PMC free article] [PubMed] [Google Scholar]
- 6.Butler, D. L., C. J. Jakielaszek, L. A. Miller, and J. A. Poupard. 1999. Escherichia coli ATCC 35218 as a quality control isolate for susceptibility testing of Haemophilus influenzae with haemophilus test medium. Antimicrob. Agents Chemother. 43:283-286. [DOI] [PMC free article] [PubMed] [Google Scholar]
- 7.Chen, H. H., H. J. Zhou, and X. Fang. 2003. Inhibition of human cancer cell line growth and human umbilical vein endothelial cell angiogenesis by artemisinin derivatives in vitro. Pharmacol. Res. 48:231-236. [DOI] [PubMed] [Google Scholar]
- 8.Cohen, J. 2002. The immunopathogenesis of sepsis. Nature 420:885-891. [DOI] [PubMed] [Google Scholar]
- 9.Hacker, H. 2000. Signal transduction pathways activated by CpG-DNA. Curr. Top. Microbiol. Immunol. 247:77-92. [DOI] [PubMed] [Google Scholar]
- 10.Hacker, H., H. Mischak, T. Miethke, S. Liptay, R. Schmid, T. Sparwasser, K. Heeg, G. B. Lipford, and H. Wagner. 1998. CpG-DNA-specific activation of antigen-presenting cells requires stress kinase activity and is preceded by nonspecific endocytosis and endosomal maturation. EMBO J. 17:6230-6240. [DOI] [PMC free article] [PubMed] [Google Scholar]
- 11.Hacker, H., R. M. Vabulas, O. Takeuchi, K. Hoshino, S. Akira, and H. Wagner. 2000. Immune cell activation by bacterial CpG-DNA through myeloid differentiation marker 88 and tumor necrosis factor receptor-associated factor (TRAF)6. J. Exp. Med. 192:595-600. [DOI] [PMC free article] [PubMed] [Google Scholar]
- 12.He, H., and M. H. Kogut. 2003. CpG-ODN-induced nitric oxide production is mediated through clathrin-dependent endocytosis, endosomal maturation, and activation of PKC, MEK1/2 and p38 MAPK, and NF-κB pathways in avian macrophage cells (HD11). Cell Signal 15:911-917. [DOI] [PubMed] [Google Scholar]
- 13.Hemmi, H., O. Takeuchi, T. Kawai, T. Kaisho, S. Sato, H. Sanjo, M. Matsumoto, K. Hoshino, H. Wagner, K. Takeda, and S. Akira. 2000. A Toll-like receptor recognizes bacterial DNA. Nature 408:740-745. [DOI] [PubMed] [Google Scholar]
- 14.Hong, Z., Z. Jiang, W. Liangxi, D. Guofu, L. Ping, L. Yongling, P. Wendong, and W. Minghai. 2004. Chloroquine protects mice from challenge with CpG ODN and LPS by decreasing proinflammatory cytokine release. Int. Immunopharmacol. 4:223-234. [DOI] [PubMed] [Google Scholar]
- 15.Hoppe, H. C., D. A. van Schalkwyk, U. I. Wiehart, S. A. Meredith, J. Egan, and B. W. Weber. 2004. Antimalarial quinolines and artemisinin inhibit endocytosis in Plasmodium falciparum. Antimicrob. Agents Chemother. 48:2370-2378. [DOI] [PMC free article] [PubMed] [Google Scholar]
- 16.Hoshino, K., O. Takeuchi, T. Kawai, H. Sanjo, T. Ogawa, Y. Takeda, K. Takeda, and S. Akira. 1999. Cutting edge: Toll-like receptor 4 (TLR4)-deficient mice are hyporesponsive to lipopolysaccharide: evidence for TLR4 as the Lps gene product. J. Immunol. 162:3749-3752. [PubMed] [Google Scholar]
- 17.Jiang, Z., Z. Hong, W. Guo, G. Xiaoyun, L. Gengfa, L. Yongning, and X. Guangxia. 2004. A synthetic peptide derived from bactericidal/permeability-increasing protein neutralizes endotoxin in vitro and in vivo. Int. Immunopharmacol. 4:527-537. [DOI] [PubMed] [Google Scholar]
- 18.Karres, I., J. P. Kremer, I. Dietl, U. Steckholzer, M. Jochum, and W. Ertel. 1998. Chloroquine inhibits proinflammatory cytokine release into human whole blood. Am. J. Physiol. 274:R1058-R1064. [DOI] [PubMed] [Google Scholar]
- 19.Kim, J. T., J. Y. Park, H. S. Seo, H. G. Oh, J. W. Noh, J. H. Kim, D. Y. Kim, and H. J. Youn. 2002. In vitro antiprotozoal effects of artemisinin on Neospora caninum. Vet. Parasitol. 103:53-63. [DOI] [PubMed] [Google Scholar]
- 20.Klayman, D. L. 1985. Qinghaosu (artemisinin): an antimalarial drug from China. Science 228:1049-1055. [DOI] [PubMed] [Google Scholar]
- 21.Krieg, A. M. 2002. CpG motifs in bacterial DNA and their immune effects. Annu. Rev. Immunol. 20:709-760. [DOI] [PubMed] [Google Scholar]
- 22.Li, Y., and Y. L. Wu. 2003. An over four millennium story behind qinghaosu (artemisinin): a fantastic antimalarial drug from a traditional chinese herb. Curr. Med. Chem. 10:2197-2230. [DOI] [PubMed] [Google Scholar]
- 23.Lipford, G. B., T. Sparwasser, M. Bauer, S. Zimmermann, E. S. Koch, K. Heeg, and H. Wagner. 1997. Immunostimulatory DNA: sequence-dependent production of potentially harmful or useful cytokines. Eur. J. Immunol. 27:3420-3426. [DOI] [PubMed] [Google Scholar]
- 24.McCoy, S. L., S. E. Kurtz, F. A. Hausman, D. R. Trune, R. M. Bennett, and S. H. Hefeneider. 2004. Activation of RAW264.7 macrophages by bacterial DNA and lipopolysaccharide increases cell surface DNA binding and internalization. J. Biol. Chem. 279:17217-17223. [DOI] [PubMed] [Google Scholar]
- 25.National Committee for Clinical Laboratory Standards. 2003. Methods for dilution antimicrobial susceptibility tests for bacteria that grow aerobically, 6th ed. Approved standard. NCCLS document M7-A6. National Committee for Clinical Laboratory Standards, Wayne, Pa.
- 26.Sparwasser, T., T. Miethke, G. Lipford, K. Borschert, H. Hacker, K. Heeg, and H. Wagner. 1997. Bacterial DNA causes septic shock. Nature 386:336-337. [DOI] [PubMed] [Google Scholar]
- 27.Takeshita, F., C. A. Leifer, I. Gursel, K. J. Ishii, S. Takeshita, M. Gursel, and D. M. Klinman. 2001. Cutting edge: role of Toll-like receptor 9 in CpG DNA-induced activation of human cells. J. Immunol. 167:3555-3558. [DOI] [PubMed] [Google Scholar]
- 28.Vincent, J. L., Q. Sun, and M. J. Dubois. 2002. Clinical trials of immunomodulatory therapies in severe sepsis and septic shock. Clin. Infect. Dis. 34:1084-1093. [DOI] [PubMed] [Google Scholar]
- 29.Yao, Y. M., H. Redl, S. Bahrami, and G. Schlag. 1998. The inflammatory basis of trauma/shock-associated multiple organ failure. Inflamm. Res. 47:201-210. [DOI] [PubMed] [Google Scholar]
- 30.Yi, A. K., R. Tuetken, T. Redford, M. Waldschmidt, J. Kirsch, and A. M. Krieg. 1998. CpG motifs in bacterial DNA activate leukocytes through the pH-dependent generation of reactive oxygen species. J. Immunol. 160:4755-4761. [PubMed] [Google Scholar]
- 31.Yi, A. K., J. G. Yoon, S. C. Hong, T. W. Redford, and A. M. Krieg. 2001. Lipopolysaccharide and CpG DNA synergize for tumor necrosis factor-alpha production through activation of NF-κB. Int. Immunol. 13:1391-1404. [DOI] [PubMed] [Google Scholar]


