

Abstract
PURPOSE
Hyperinsulinemia is a common feature of many obesity syndromes. We investigated whether suppression of insulin secretion, without dietary or exercise intervention, could promote weight loss and alter food intake and preference in obese adults.
METHODS
Suppression of insulin secretion was achieved using octreotide-LAR 40 mg IM q28d for 24 weeks in 44 severely obese adults (89% female, 39% minority). Oral glucose tolerance testing was performed before and after treatment, indices of β-cell activity (CIRgp), insulin sensitivity (CISI), and clearance (CP/I AUC) were computed, and leptin levels, 3-day food records and carbohydrate-craving measurements were obtained. DEXA evaluations were performed pre- and post-therapy in an evaluable subgroup.
RESULTS
For the entire cohort, significant insulin suppression was achieved with simultaneous improvements in insulin sensitivity, weight loss, and body mass index (BMI). Leptin, fat mass, total caloric intake, and carbohydrate craving significantly decreased. When grouped by BMI response, high responders (HR; ΔBMI < −3 kg/m2) and low responders (LR; ΔBMI between −3 and −0.5) exhibited higher suppression of CIRgp and IAUC than nonresponders (NR; ΔBMI > −0.5). CISI improved and significant declines in leptin and fat mass occurred only in HR and LR. Conversely, both leptin and fat mass increased in NR. Carbohydrate intake was markedly suppressed in HR only, while carbohydrate-craving scores decreased in HR and LR. For the entire cohort, ΔBMI correlated with ΔCISI, Δfat mass, and Δleptin. ΔFat mass also correlated with ΔIAUC and ΔCISI.
CONCLUSIONS
In a subcohort of obese adults, suppression of insulin secretion was associated with loss of body weight and fat mass and with concomitant modulation of caloric intake and macronutrient preference.
Keywords: obesity, insulin, somatostatin, octreotide, weight loss
Introduction
Obesity has reached epidemic proportions throughout the world. The prevalence of obesity as determined by body mass index (BMI>30 kg/m2) in the US has risen from 12.8 to 22.5% during the last 20 y.1,2 Diet and exercise alone are frequently unsuccessful in ameliorating the obesity long-term,3–5 stressing the importance of metabolic and genetic components to this syndrome.
Most obese patients exhibit hyperinsulinemia;6,7 however, it is unclear whether this is a cause or effect of the obesity, and whether excessive insulin secretion, decreased plasma insulin clearance, or insulin resistance is the crucial insulin defect. Insulin is the primary hormonal mediator of energy storage in humans.8 Within the adipocyte, insulin regulates: (a) Glut4 expression; (b) acetyl-CoA carboxylase; (c) fatty acid synthase; and (d) lipoprotein lipase.9 The role of insulin in the pathogenesis of obesity has been previously suggested.10–12 Studies link hyperinsulemia to carbohydrate craving,13 hyperphagia,13 and decreased fat oxidation and physical activity.14–16
Acute glucose-stimulated insulin hypersecretion in insulin-sensitive adults predicts weight gain.11 In children, an augmented early postprandial insulin response precedes the development of obesity.12 Conversely, fasting hyperinsulinemia has also been shown to be a predictor of weight gain.17,18
In a rat model of obesity, lesions of the ventromedial hypothalamus (VMH) cause excessive insulin secretion, hyperphagia, and intractable weight gain, which can be blocked by pancreatic vagotomy.19–22 Children who develop obesity secondary to cranial insult23 exhibit excessive insulin secretion, and suppression of insulin release using octreotide (a somatostatin analog) promotes weight and BMI loss.24 The present study was conducted to determine whether insulin suppression could promote weight loss in obese adults. Additionally, we investigated whether insulin suppression could alter carbohydrate craving and intake, and macro-nutrient preference.
Patients and methods
Patients and recruitment
This study prospectively evaluated the effect of insulin suppression on weight and BMI in a cohort of healthy obese adults referred for weight management. The study protocol was approved by the University of Tennessee Institutional Review Board, and all subjects gave written informed consent prior to eligibility confirmation. Study inclusion criteria were ages 18–65 y and BMI ≥ 35. Subjects who met the inclusion criteria underwent a screening evaluation consisting of a complete history and physical examination, and the following studies: comprehensive metabolic panel (CMP), serum glucose 2 h after a 75 g oral glucose load, gallbladder ultrasound, and urine pregnancy test (if female). Subjects were excluded from study participation if the screening evaluation revealed the presence of gallstones, hypertension, diabetes mellitus (by ADA criteria), renal or liver disease, or the use of chronic medications except for thyroid or estrogen supplementation.
Procedures
Prior to study initiation, subjects underwent a physical examination and measures of body composition, dietary intake and physical activity, glycemic control, insulin suppression, thyroid function (and free T4), and leptin levels (as a surrogate marker of fat mass)25 were collected. Physical examination and study measures were repeated every 4 weeks for 24 weeks between the hours 0800 and 1030. All examinations were conducted by the same individual throughout the study period. Thyroid function was assessed monthly to ensure subjects remained euthyroid, as octreotide may suppress pituitary TSH secretion.
Body composition measures
BMI and waist-to-hip ratio
At each visit, measurement of total body weight was obtained using a calibrated electronic scale with a precision of ±0.02 kg. Height was measured using standard anthropometry and expressed in centimeters. BMI was calculated using the standard formula (weight in kilograms divided by height in meters squared). Waist and hip circumference measurements were obtained using a metal tape measure by the same individual at each visit.
Dual-energy X-ray absorptiometry (DEXA)
Subjects were analyzed for total tissue, fat mass, and lean mass at weeks 0 and 24 by DEXA, using a Lunar DPX-L machine (Madison, WI, USA). Evaluation weight was limited to 137 kg, the upper limit for the table. Subjects received 0.06 mrem of radiation during the 40 min scan. Auto width and length settings were utilized to reduce scan time and radiation exposure. The appropriate energy level was determined individually based on each subject’s body habitus. The week 24 scan was analyzed by comparison of regions of interest to the reference (week 0) scan.
Dietary assessment
Caloric intake and diet composition
Subjects completed a 3-day food record diary prior to each visit after receiving individual instruction from the nutritionist. Each study subject met with the nutritionist who, using food models, determined the amounts and proportions of food eaten over the previous 72-h period. Macro- and micronutrient analyses of energy intake were determined by using the software program Ohio Distinctive Software (Columbus, OH, USA).
Carbohydrate craving
Carbohydrate craving was measured using the carbohydrate addiction scale developed by Heller and Heller.26 The questionnaire consists of 17 weighted questions with a total score of 60. Based on scores, individuals were classified as being a doubtful carbohydrate craver (score < 21), having mild carbohydrate addition (score 22–30), moderate carbohydrate addiction (score 31–44) or severe carbohydrate addiction (score >45).
Laboratory Measures
A 3-h oral glucose tolerance test (OGTT) was performed at weeks 0 and 24,27 after an overnight fast. Subjects drank 75 g dextrose (Allegiance, MacGaw Park, IL, USA), and blood samples were obtained at 0, 15, 30, 60, 90, 120, 150, and 180 min. The 1997 ADA diagnostic guidelines28 were used to distinguish normal vs impaired glucose tolerance (IGT).
Chemical analyses
Serum glucose during OGTT was measured by the glucose oxidase method.29 Serum immunoreactive insulin (pM) and C-peptide (ng/ml) levels from each OGTT sample were measured by standard double-antibody radioimmunoassay (RIA) (Linco Research; St Louis, MO, USA) for use in calculation of insulin indices. Leptin (nM) was measured by double antibody RIA (Linco Research; St Louis, MO, USA). All other laboratory studies were performed by Memphis Pathology Laboratory (Memphis, TN, USA).
Insulin indices
From each OGTT, the following indices were computed using established formulas validated using conventional units. (a) Insulin area under the curve (IAUC) is an index of the magnitude of the insulinemia during the OGTT.30 The trapezoid method was used to calculate IAUC.31 (b) The corrected insulin release at the glucose peak (CIRgp) is an index of β-cell activity.32 (c) Composite insulin sensitivity index (CISI) is a measure of peripheral insulin sensitivity.33 (d) The molar ratio of area under the c-peptide curve/IAUC (CP/I AUC) as an index of insulin clearance during the OGTT.34
Glycemic control measures
At each visit, patients were examined and interviewed regarding signs and symptoms of glucose intolerance. A fasting blood sample was taken for HbA1c to evaluate glucose control. Subjects checked their capillary blood glucose (CBG; Precision QID, Medisense, Needham, MA, USA) three times a week, both before and 2 h after a meal. Individual values were downloaded, and monthly averages of CBG were calculated at each visit to evaluate excursions of glucose in response to normal dietary intake.
Intervention
To suppress insulin secretion, subjects were treated with six injections of octreotide-LAR (Sandostatin-LAR® Depot; No-vartis, East Hanover, NJ, USA) 40 mg i.m. q28d from weeks 0–20, given as two intragluteal 20 mg injections. Subjects were also treated with ursodeoxycholic acid (Actigall®; Novartis) 600 mg p.o. qd to prevent cholelithiasis.35 Subjects were allowed to eat ad libitum, and neither dietary nor exercise interventions were recommended.
Statistics
All data analyses were performed using the SAS system (Cary, NC, USA). Descriptive statistics are reported as mean and standard error of the mean (s.e.m.) for continuous data and frequency and percent for categorical data. Change scores for continuous data were computed by subtracting measures at week 0 from week 24. Data were grouped post hoc into three categories of response based on BMI change: eight subjects with high response (HR; ΔBMI < −3), 25 with low response (LR; −3≤ΔBMI≤−0.5), and 11 subjects with no response (NR; ΔBMI>−0.5). Statistical analyses applied to the data consisted of Pearson χ2, Pearson correlation, t-test, analysis of variance, and ANOVA with repeated measures. P-values less than or equal to 0.05 were considered significant, although trends (0.05 < P < 0.1) are also listed.
Results
Demographics
Of the 53 subjects recruited, 44 subjects completed the entire study. Nine subjects (17%) dropped out during the study; four because of lack of weight loss during the first 4–20 weeks, and five for other reasons. Of the 44 subjects who completed the study, the majority were female (89%) and Caucasian (61%) with a mean age of 39±1.3 y. Seven subjects (16%) were receiving thyroxine supplementation. For the entire cohort (n = 44), insulin suppression occurred and insulin sensitivity improved. CIRgp decreased by 59% (−0.84±0.01, P < 0.001) and IAUC decreased by 30% (−5423±1019, P < 0.001) from baseline, while insulin sensitivity, measured by CISI, increased by 33% (+0.96±0.28, P = 0.02) (Table 1). Concomitant improvements in body composition occurred with insulin suppression. Weight and BMI decreased during the 24-week study period. ΔWeight was −3.6±0.9 kg (P < 0.001), and ΔBMI was −1.2±0.1 kg/m2 (P < 0.001) (Table 1). WHR decreased by 0.02±0.01 (P = 0.04), while waist circumference decreased by 7.3±1.3 cm (P < 0.001). The magnitude of weight response was very broad. Both leptin and fat mass decreased, consistent with changes in weight and BMI (Table 1). Total caloric intake, carbohydrate intake, fat intake, and protein intake decreased despite the absence of a dietary intervention (P < 0.001). Carbohydrate craving was also significantly decreased in the entire cohort (P < 0.001) (Table 1). Self-reported physical activity was unchanged during the study period.
Table 1.
Baseline and post-treatment body composition measures, insulin indices, and dietary variables for the entire cohort
| Baseline (week 0) | Post-treatment (week 24) | |
|---|---|---|
| Weight (kg) | 122.7±4.1 | 119.2±3.9** |
| BMI (kg m2) | 44.3±1.0 | 43.1±1.0** |
| Leptin (nM) | 3.49±0.22 | 2.62±0.17** |
| CIRgp | 1.43±0.16 | 0.62±0.09** |
| IAUC | 18383±2041 | 12355±1662* |
| CISI | 2.93±0.23 | 3.85±0.36** |
| CP/I AUC | 0.1±0.01 | 0.1±0.01 |
| Total calories (kcal/day) | 2280±107.6 | 1614±82.8** |
| Calories from carbohydrates | 1059±60.6 | 697±42.2** |
| Calories from protein | 354±19.8 | 275±15.2** |
| Calories from fat | 854±48.3 | 663±39.2** |
| Carbohydrate craving | 27.3±1.54 | 19.2±1.78** |
All values expressed as mean±s.e.m.
P<0.01,
P<0.05 from baseline (week 0) to post-treatment (week 24).
During the study period, mean HbA1c increased from 5.65%±0.06 at baseline to 5.88%±0.07 after 24 weeks of insulin suppression (P < 0.001). However, the HbA1c increment was not associated with clinical or biochemical deterioration. No subject reported symptoms suggesting diabetes mellitus or required treatment for blood glucose control. Free T4 levels were maintained within normal values throughout the study. One subject developed cholelithiasis, but admitted to non-compliance with the preventative ursodeoxycholic acid therapy.
Weight loss and insulin suppression by response strata
There was a large range and standard deviation of Δweight and ΔBMI within this cohort. Therefore, data were grouped post hoc into three categories of response based on BMI change: eight subjects with high response (HR; ΔBMI < −3), 25 with low response (LR; −3≤ΔBMI≤−0.5), and 11 subjects with no response (NR; ΔBMI>−0.5). Responder groups were similar in gender distribution. Although our HR group was slightly younger with higher BMI and weight than LR, there was no significant difference between the HR and NR groups (Table 2). Both the NR and LR groups had a higher percentage of minorities (45 and 44%, respectively) than the HR group (13%).
Table 2.
Changes in body composition measurements by response strata
|
Response group |
||||
|---|---|---|---|---|
| Variable | Time | HR (n=8) | LR (n=25) | NR (n=11) |
| Weight (kg) | Baseline | 139.7±14.0 | 117.5±4.7 | 122.4±6.3 |
| Post | 127.0±13.7** | 113.9±4.7** | 125.4±6.2** | |
| BMI (kg/m2) | Baseline | 47.4±3.3 | 42.4±1.1 | 46.4±2.2 |
| Post | 43.0±3.4** | 41.1±1.1** | 47.8±2.2** | |
| Leptin (nM) | Baseline | 3.82±0.2 | 3.39±0.3 | 3.28±0.5 |
| Post | 2.13±0.2**a | 2.41±0.2**b | 3.45±0.3 | |
| DEXAb | ||||
| Total tissue mass (kg) | Baseline | 109.0±4.9 | 103.1±2.3 | 107.4±3.7 |
| Post | 93.3±4.9** | 100.6±2.3** | 109.3±3.7* | |
| Fat mass (kg) | Baseline | 57.5±4.3 | 54.9±2.0 | 56.9±3.1 |
| Post | 52.6±4.1 | 52.3±2.0c | 60.0±3.1 | |
All values expressed as mean±s.e.m.
P<0.01,
P<0.05 from baseline to post-treatment within response group.
P<0.01.
Response group sample size for DEXA variable: high (n=4), low (n=20), non (n=9).
P<0.05 from nonresponse group at same time point.
Body composition
HR subjects (n = 8) exhibited Δweight of −12.6±1.1 kg and ΔBMI of −4.1±0.4. LR subjects (n = 25) exhibited Δweight of −3.6±0.4 kg and ΔBMI of −1.3±0.2. NR subjects (n = 11) exhibited Δweight of +3.0±0.7 kg and ΔBMI of +0.7±0.3 (P < 0.001). No significant differences were noted in WHR or waist circumference between response groups at week 0 or 24, with all groups exhibiting decreases in waist circumference during the study (P < 0.02).
Serum leptin levels, a surrogate measure of fat mass, were indistinguishable between response strata at week 0. At week 24, only HR and LR subjects exhibited significant declines in leptin (P < 0.001) (Table 2). The Δleptin correlated with ΔBMI (r = 0.59, P = 0.003).
The weight limit of the DEXA table (137 kg) precluded data acquisition in 11 subjects (25%). Our sample included four HR, 20 LR, and nine NR subjects. Total tisssue and fat mass were not different between response strata at week 0. After 24 weeks of octreotide-LAR, total tissue mass decreased in HR and LR (P < 0.001), and increased in NR (P = 0.03). Fat mass also decreased in HR and LR (P = 0.02 and 0.01, respectively), and increased in NR (P = 0.03) (Table 2).
Insulin excursion
The plot of the insulin curves was highly dissimilar between response groups at Week 0 (Figure 1). HR subjects (Figure 1a) had a rapid ascending limb with a sharp peak, followed by a rapid decline. The NR insulin curve (Figure 1c) had a slow ascending limb with a prolonged plateau between 60 and 150 min. The LR insulin curve had components of both HR and NR curves, with one lack of an acute peak, but with a shorter plateau (Figure 1b). Suppression of insulin secretion resulted in an attenuation of the insulin excursion in both HR and LR, but not in NR subjects.
Figure 1.
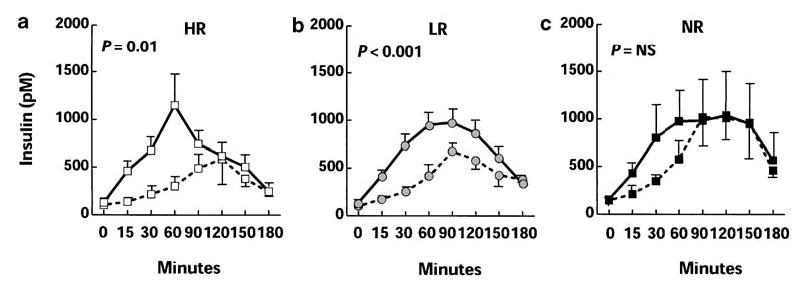
Excursions of insulin (a–c) during oral glucose tolerance testing in 44 subjects with obesity, stratified by BMI response to insulin suppression. Curves for HR (a; white squares), LR (b; gray circles), and NR (c; black squares) are plotted both at Week 0 (solid lines) and at Week 24 (dashed lines). Error bars denote s.e.m. ANOVA with repeated measures document significant differences between the insulin curves at week 0 and 24 for HR (P = 0.001) and LR (P < 0.001), while NR did not have significant differences in insulin excursion following treatment with octreotide.
Insulin indices
When grouped by response strata, CIRgp, IAUC, C-peptide, CISI, and CP/I AUC at week 0 were similar (Table 3). After 24 weeks, CIRgp decreased among all response strata (HR: −1.09±0.17, P < 0.001; LR: −0.86±0.12, P < 0.001; NR: −0.6±0.29, P = 0.005) with HR and LR subjects exhibiting lower β-cell activity (CIRgp) than NR subjects (P = 0.043). IAUC was only suppressed in HR (−7420±1054, P = 0.001) and LR (−6600±1331, P < 0.001) subjects. Similarly, C-peptide suppression was evident only in HR (P = 0.001) and LR (P < 0.001) subjects. CISI was not significantly different among response groups at either study point; however, CISI, a measure of peripheral insulin sensitivity, improved in both HR (+1.73±0.56, P = 0.006) and LR (+1.31±0.33, P = 0.001). Insulin clearance, assessed by CP/I AUC, significantly improved in HR (P = 0.01), and deteriorated in NR (P = 0.01).
Table 3.
Changes in insulin indices and dietary variables by response strata
|
Response group |
||||
|---|---|---|---|---|
| Variable | Time | HR (n=8) | LR (n=25) | NR (n=11) |
| CIRgp | Baseline | 1.54±0.24 | 1.32±0.17 | 1.62±0.51 |
| Post | 0.45±0.11**a | 0.49±0.07**b | 1.01±0.30** | |
| IAUC | Baseline | 16338±2819 | 18015±2222 | 20452±6508 |
| Post | 8918±2432**a | 11149±1618**a | 17759±5108 | |
| CISI | Baseline | 2.76±0.38 | 2.70±0.26 | 3.41±0.65 |
| Post | 4.49±0.85**a | 3.97±0.46**a | 3.15±0.79 | |
| CP/I AUC | Baseline | 0.09±0.01 | 0.10±0.01 | 0.11±0.02 |
| Post | 0.12±0.01** | 0.10±0.01 | 0.09±0.02* | |
| Total calories (kcal/day) | Baseline | 2107±737 | 2223±715 | 2565±684 |
| Post | 1308±404**a | 1600±527** | 1891±580** | |
| Calories from carbohydrate | Baseline | 941±337 | 1045±446 | 1187±318 |
| Post | 491±342*b | 681±220**a | 903±230** | |
| Calories from protein | Baseline | 351±175 | 343±127 | 383±112 |
| Post | 266±100 | 261±114** | 315±72* | |
| Calories from fat | Baseline | 766±344 | 813±284 | 1027±361 |
| Post | 548±235* | 661±258* | 759±260* | |
| Carbohydrate craving | Baseline | 25.7±11.0 | 25.8±11.2 | 28.8±11.1 |
| Post | 19.2±10.4* | 16.1±11.6** | 26.2±10.7 | |
All values expressed as mean±s.e.m.
P<0.01,
P<0.05 from baseline to post-treatment within response group.
P<0.05.
P<0.01, from nonresponse group at same time point.
Dietary change and carbohydrate craving by response strata
Total caloric and macronutrient intake were similar at baseline between response strata group (P = NS). Total caloric intake, fat intake, and protein intake decreased in all response strata (P < 0.01), but there were no interstrata differences (Table 3). Although daily carbohydrate consumption decreased in all strata, only HR exhibited marked suppression, both as absolute carbohydrate intake (941±119 kcal/day vs 383±70 kcal/day from week 0 to 24; P = 0.05) (Figure 2a) and as percent of total calories (from 47 to 35%; P = 0.017) (Figure 2b). Self-reported carbohydrate-craving scores were similar between response strata at baseline (P = NS). After 24 weeks of insulin suppression, the HR and LR groups reported a 25 and 37% decrease in carbohydrate craving, compared to a 2% reduction reported by the NR group. Decreases in carbohydrate craving were only significant for the HR and LR groups (P = 0.01, 0.0007, respectively), while the NR group did not change (Table 3). Self-reported physical activity did not increase during the 24-week period.
Figure 2.
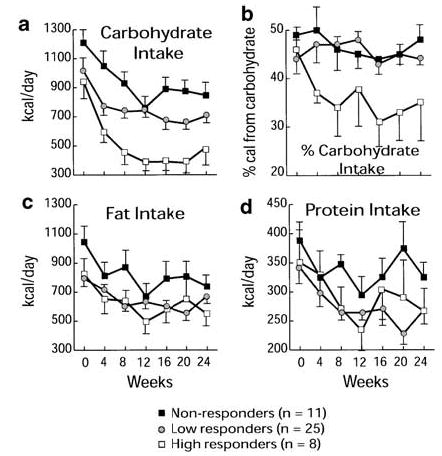
Alterations in macronutrient intake in 44 subjects with obesity, stratified by BMI response to insulin suppression (HR, white squares; LR, gray circles; NR, black squares). (a) Although carbohydrate intake decreased in all subjects (P < 0.001), the suppression of carbohydrate intake was greatest in HR, and was less pronounced in LR and NR. (b) As a percent of daily ingested calories as carbohydrate, only HR demonstrated a decrease from 47% to 35% (P = 0.017). (c) Fat intake decreased in all groups (P < 0.001), but the decrease was indistinguishable among response strata. (d) Protein intake also decreased in all groups (P < 0.001), but the decrease was indistinguishable among response strata.
Correlation between changes in insulin indices, BMI, and fat mass
For the entire cohort, ΔBMI was negatively correlated with ΔCISI and ΔCP/I AUC (r = −0.45, P = 0.003 and r = −0.52, P = 0.001, respectively), and there was a trend toward positive correlation with ΔIAUC (r = +0.32, P = 0.056), while no significant correlation was found with ΔCIRgp (r = + 0.24, P = NS). ΔBMI also correlated with Δfat mass (r = + 0.63, P < 0.001), and Δleptin (r = + 0.59, P < 0.003). ΔFat mass correlated with ΔIAUC (r = + 0.44, P = 0.02) and ΔCISI (r = −0.55, P = 0.001).
Discussion
This study supports the primary role of insulin in the genesis of obesity in some individuals. We suppressed insulin secretion in order to examine differential responsiveness among obese persons. As a result of the exploratory nature of the study, we stratified subjects post hoc based on weight loss and compared changes in the insulin dynamics between subjects who lost weight and those who did not. We chose a post hoc analysis based on BMI response to evaluate our results because, to our knowledge, no previous study had evaluated changes in insulin dynamics and the level of insulin suppression required to induce weight loss. The majority of studies reported in the literature have reviewed the relationship between either fasting insulin, insulin response, or sensitivity and the amount of weight gained during a period of time.6,11–13,15 A previous study reported the efficacy of insulin suppression in promoting weight loss using diazoxide;36 however, the magnitude of the effect of insulin suppression on weight loss was confounded by the concomitant use of a low-calorie formula diet in all patients, limited period of insulin suppression (8 weeks), and failure to examine insulin dynamics. This is the first study that prospectively evaluated the effect of chronic insulin suppression on fat mass and body weight in severely obese adult subjects without dietary or exercise intervention.
In this study, we used octreotide-LAR as an instrument to promote insulin suppression. Octreotide binds to the somatostatin receptor-5 (SSTR5) on the β-cell37,38 to inhibit intracellular calcium influx, which attenuates the early phase of insulin secretion in a dose-dependent fashion.39–41 We cannot rule out other potential mechanisms of octreotide action in the promotion of weight loss, such as: modulation of other GI hormones, such as glucagon-like peptide-1;42 slowing of gastric emptying and GI motility, with nutrient malabsorption;43 direct effects on appetite,43,44 or direct effects on the adipocyte.45 However, these other mechanisms seem less likely, as GI symptoms and decrease in caloric intake suppression were uniformly distributed throughout all response strata, and as those subjects who exhibited weight loss demonstrated insulin suppression.46 Furthermore, if another mechanism other than insulin suppression was responsible for the weight loss, subjects receiving octreotide for acromegaly or other disorders would be expected to lose weight and fat mass; indeed long-term octreotide usage has minimal effects on these parameters.47
We found that insulin suppression for 24 weeks was associated with marked weight loss (mean 12.6 kg) in 18% of an otherwise healthy subpopulation of adult obese subjects, and a small but significant weight loss (mean 3.6 kg) in another 57%. This weight loss occurred without dietary or exercise intervention, and occurred slowly but without asymptote.
The efficacy of octreotide in suppressing pancreatic β-cell insulin secretion was evident in all groups (HR, LR, and NR) with reduced CIRgp occurring in all subjects after 24 weeks of treatment with octreotide. (Table 3). However, in NR individuals, IAUC was not significantly affected by octreotide. At the end of the study, NR subjects’ IAUC were as high as baseline values of the HR and LR group. This finding can be explained by the increased insulin resistance (lower CISI) and lower insulin clearance (CP/I AUC) found in the NR group compared to the HR and LR groups at the 24-week study point. After 24 weeks of treatment with octreotide NR subjects’ CP/I AUC was significantly decreased and insulin sensitivity (CISI) did not improve; NR continued to have the lowest CISI and CP/I AUC compared with the other two groups.
Insulin suppression was associated with decreases in both leptin and fat mass in our cohort. Although the weight limitation of the DEXA table could produce a sample bias, this bias is minimized, as the initial weight and BMI of the subject population was not predictive of BMI loss or changes in fat mass. Nonetheless, changes in BMI correlated with both changes in leptin and fat mass. Furthermore, the changes in leptin and fat mass correlated with changes in insulin secretion and sensitivity suggesting that insulin is an important determinant in the etiopathogenesis of obesity in this cohort.
The role of increased carbohydrate craving and intake has been previously suggested to play a contributory role in the development of obesity.48–50 However, the connection between insulin and carbohydrate craving and intake is less clear. The frequent intake of highly refined carbohydrates may induce weight gain by initiating and sustaining a chronic state of hyperinsulinemia. Carbohydrate intake stimulates insulin secretion, raising circulating insulin levels, which in turn favors increased fatty acid uptake, lipid biosynthesis, and inhibition of lipolysis, leading to energy storage.8,14–16 Conversely, it had been suggested that insulin stimulates hyperphagia and fosters carbohydrate cravings,13 producing increased levels of insulin that promote insulin resistance and exacerbation of the hyperinsulinemic condition.46,51 This suggests that a vicious cycle is set in motion that perpetuates hyperinsulinemia and weight gain, and that breaking this cycle can promote weight loss.
Our results support the hypothesis that insulin hypersecretion may play a primary role in the craving and consumption of carbohydrate. Only those subjects with the greatest insulin suppression (ΔIAUC: HR −45% vs LR −38% and NR −5%) voluntarily decreased their daily caloric consumption of carbohydrate by 40.7% (P = 0.001), and their percent of total calories from 47% to 35%. Furthermore, they manifested a 25% reduction in their carbohydrate-craving questionnaire score (P = 0.01).
Our data suggest that insulin hypersecretion plays a role in the pathogenesis of obesity. Decreasing this hyperinsulinemic state promoted body weight and fat mass loss with concomitant modulation of appetite and food preference in our cohort. These changes were associated with improvements in insulin sensitivity and clearance, and without glucose intolerance or diabetes. Our results propose that suppression of insulin secretion may represent a viable approach in some obese individuals to break the vicious cycle of hyperinsulinemia, insulin resistance and weight gain and to modulate appetite, food preference, and body weight in a beneficial manner.
Acknowledgments
The work was supported in part by University of Tennessee GCRC 5M01RR 00211, and by a research grant from Novartis Pharmaceuticals Corporation.
The nurses of the University of Tennessee GCRC for their assistance in the care of these subjects, the staff of the University of Tennessee Obesity Wellness Center for their technical assistance, and Drs Laurie Letvak and Kurt Sizer of Novartis Pharmaceuticals Corp. for their support.
References
- 1.Kuczmarski RJ, Flegal KM, Campbell SM, Johnson CL. Increasing prevalence of overweight among US adults. The National Health and Nutrition Examination Surveys, 1960 to 1991. JAMA. 1994;272:205–211. doi: 10.1001/jama.272.3.205. [DOI] [PubMed] [Google Scholar]
- 2.Mokdad AH, Serdula MK, Dietz WH, Bowman BA, Marks JS, Koplan JP. The spread of the obesity epidemic in the United States, 1991–1998. JAMA. 1999;282:1519–1522. doi: 10.1001/jama.282.16.1519. [DOI] [PubMed] [Google Scholar]
- 3.Luepker RV, Perry CL, McKinlay SM, Nader PR, Parcel GS, Stone EJ, Webber LS, Elder JP, Feldman HA, Johnson CC, et al. Outcomes of a field trial to improve children’s dietary patterns and physical activity. The Child and Adolescent Trial for Cardiovascular Health. CATCH collaborative group. JAMA. 1996;275:768–776. doi: 10.1001/jama.1996.03530340032026. [DOI] [PubMed] [Google Scholar]
- 4.Skender ML, Goodrick GK, Del Junco DJ, Reeves RS, Darnell L, Gotto AM, Foreyt JP. Comparison of 2-year weight loss trends in behavioral treatments of obesity: diet, exercise, and combination interventions. J Am Diet Assoc. 1996;96:342–346. doi: 10.1016/S0002-8223(96)00096-X. [DOI] [PubMed] [Google Scholar]
- 5.Bray GA, Gray DS. Treatment of obesity: an overview. Diabetes Metab Rev. 1988;4:653–679. doi: 10.1002/dmr.5610040704. [DOI] [PubMed] [Google Scholar]
- 6.Lillioja S, Nyomba BL, Saad MF, Ferraro R, Castillo C, Bennett PH, Bogardus C. Exaggerated early insulin release and insulin resistance in a diabetes-prone population: a metabolic comparison of Pima Indians and Caucasians. J Clin Endocrinol Metab. 1991;73:866–876. doi: 10.1210/jcem-73-4-866. [DOI] [PubMed] [Google Scholar]
- 7.Haffner SM, D’Agostino R, Saad MF, Rewers M, Mykkanen L, Selby J, Howard G, Savage PJ, Hamman RF, Wagenknecht LE, Bergman RN. Increased insulin resistance and insulin secretion in non-diabetic African-Americans and Hispanics compared with non-Hispanic whites. The Insulin Resistance Atherosclerosis Study. Diabetes. 1996;45:742–748. doi: 10.2337/diab.45.6.742. [DOI] [PubMed] [Google Scholar]
- 8.Marin P, Rebuffe-Scrive M, Smith U, Bjorntorp P. Glucose uptake in human adipose tissue. Metabolism. 1987;36:1154–1160. doi: 10.1016/0026-0495(87)90242-3. [DOI] [PubMed] [Google Scholar]
- 9.Ramsay TG. Fat cells. Endocrinol Metab Clin North Am. 1996;25:847–870. doi: 10.1016/s0889-8529(05)70358-3. [DOI] [PubMed] [Google Scholar]
- 10.Taylor SI, Accili D, Imai Y. Insulin resistance or insulin deficiency. Which is the primary cause of NIDDM? Diabetes. 1994;43:735–740. doi: 10.2337/diab.43.6.735. [DOI] [PubMed] [Google Scholar]
- 11.Sigal RJ, El-Hashimy M, Martin BC, Soeldner JS, Krolewski AS, Warram JH. Acute postchallenge hyperinsulinemia predicts weight gain: a prospective study. Diabetes. 1997;46:1025–1029. doi: 10.2337/diab.46.6.1025. [DOI] [PubMed] [Google Scholar]
- 12.Le Stunff C, Bougneres P. Early changes in postprandial insulin secretion, not in insulin sensitivity, characterize juvenile obesity. Diabetes. 1994;43:696–702. doi: 10.2337/diab.43.5.696. [DOI] [PubMed] [Google Scholar]
- 13.Brandes JS. Insulin induced overeating in the rat. Physiol Behav. 1977;18:1095–1102. doi: 10.1016/0031-9384(77)90017-8. [DOI] [PubMed] [Google Scholar]
- 14.Cohen P, Barzilai N, Barzilai D, Karnieli E. Correlation between insulin clearance and insulin responsiveness: studies in normal, obese, hyperthyroid, and Cushing’s syndrome patients. Metabolism. 1986;35:744–749. doi: 10.1016/0026-0495(86)90242-8. [DOI] [PubMed] [Google Scholar]
- 15.Weiner MF. Rapid weight gain due to overinsulinization. Obes Bariatric Med. 1980;9:118–119. [Google Scholar]
- 16.Woods WC, Decke E, Vasselli JR. Metabolic hormones and regulation of body weight. Physiol Rev. 1974;81:26–43. doi: 10.1037/h0035927. [DOI] [PubMed] [Google Scholar]
- 17.Odeleye OE, de Courten M, Pettitt DJ, Ravussin E. Fasting hyperinsulinemia is a predictor of increased body weight gain and obesity in Pima Indian children. Diabetes. 1997;46:1341–1345. doi: 10.2337/diab.46.8.1341. [DOI] [PubMed] [Google Scholar]
- 18.Zannolli R, Rebeggiani A, Chiarelli F, Morgese G. Hyperinsulinism as a marker in obese children. Am J Dis Child. 1993;147:837–841. doi: 10.1001/archpedi.1993.02160320039016. [DOI] [PubMed] [Google Scholar]
- 19.Tokunaga K, Fukushima M, Kemnitz JW, Bray GA. Effect of vagotomy on serum insulin in rats with paraventricular or ventromedial hypothalamic lesions. Endocrinology. 1986;119:1708–1711. doi: 10.1210/endo-119-4-1708. [DOI] [PubMed] [Google Scholar]
- 20.Inoue S, Bray GA. The effects of subdiaphragmatic vagotomy in rats with ventromedial hypothalamic obesity. Endocrinology. 1977;100:108–114. doi: 10.1210/endo-100-1-108. [DOI] [PubMed] [Google Scholar]
- 21.Bray GA, York DA. Hypothalamic and genetic obesity in experimental animals: an autonomic and endocrine hypothesis. Physiol Rev. 1979;59:719–809. doi: 10.1152/physrev.1979.59.3.719. [DOI] [PubMed] [Google Scholar]
- 22.Bray GA. Syndromes of hypothalamic obesity in man. Pediatr Ann. 1984;13:525–536. [PubMed] [Google Scholar]
- 23.Sklar CA. Craniopharyngioma: endocrine sequelae of treatment. Pediatr Neurosurg. 1994;21 (Suppl 1):120–123. doi: 10.1159/000120873. [DOI] [PubMed] [Google Scholar]
- 24.Lustig RH, Rose SR, Burghen GA, Velasquez-Mieyer P, Broome DC, Smith K, Li H, Hudson MM, Heideman RL, Kun LE. Hypothalamic obesity caused by cranial insult in children: altered glucose and insulin dynamics and reversal by a somatostatin agonist. J Pediatr. 1999;135:162–168. doi: 10.1016/s0022-3476(99)70017-x. [DOI] [PubMed] [Google Scholar]
- 25.Guven S, El-Bershawi A, Sonnenberg GE, Wilson CR, Hoffmann RG, Krakower GR, Kissebah AH. Plasma leptin and insulin levels in weight-reduced obese women with normal body mass index: relationships with body composition and insulin. Diabetes. 1999;48:347–352. doi: 10.2337/diabetes.48.2.347. [DOI] [PubMed] [Google Scholar]
- 26.Heller RF, Heller RF. Are you a carbohydrate craver? The carbohydrate addict’s diet. Signet, New York, NY. 1991.
- 27.Reaven GM, Brand RJ, Chen YD, Mathur AK, Goldfine I. Insulin resistance and insulin secretion are determinants of oral glucose tolerance in normal individuals. Diabetes. 1993;42:1324–1332. doi: 10.2337/diab.42.9.1324. [DOI] [PubMed] [Google Scholar]
- 28.ADA Report of the expert committee on the diagnosis and classification of diabetes mellitus. Diabetes Care. 1997;20:1183–1197. doi: 10.2337/diacare.20.7.1183. [DOI] [PubMed] [Google Scholar]
- 29.Kadish AH, Little RH, Sternberg JC. A new and rapid method for the determination of glucose by measurement of rate of oxygen consumption. Clin Chem. 1968;14:116–119. [Google Scholar]
- 30.Toft I, Bonaa KH, Lindal S, Jenssen T. Insulin kinetics, insulin action, and muscle morphology in lean or slightly overweight persons with impaired glucose tolerance. Metabolism. 1998;47:848–854. doi: 10.1016/s0026-0495(98)90125-1. [DOI] [PubMed] [Google Scholar]
- 31.Tallarida RJ, Murray RB. Manual of pharmacologic calculations with computer programs. Springer-Verlag: New York, 1986. pp 77–81.
- 32.Sluiter WJ, Erkelens DW, Terpstra P, Reitsma WD, Doorenbos H. Glucose tolerance and insulin release, a mathematical approach. II. Approximation of the peripheral insulin resistance after oral glucose loading. Diabetes. 1976;25:245–249. doi: 10.2337/diab.25.4.245. [DOI] [PubMed] [Google Scholar]
- 33.Matsuda M, DeFronzo RA. Insulin sensitivity indices obtained from oral glucose tolerance testing: comparison with the euglycemic insulin clamp. Diabetes Care. 1999;22:1462–1470. doi: 10.2337/diacare.22.9.1462. [DOI] [PubMed] [Google Scholar]
- 34.Meistas MT, Margolis S, Kowarski AA. Hyperinsulinemia of obesity is due to decreased clearance of insulin. Am J Physiol. 1983;245:E155–E159. doi: 10.1152/ajpendo.1983.245.2.E155. [DOI] [PubMed] [Google Scholar]
- 35.Williams C, Gowan R, Perey BJ. A double-blind placebo-controlled trial of ursodeoxycholic acid in the prevention of gallstones during weight loss after vertical banded gastroplasty. Obes Surg. 1993;3:257–259. doi: 10.1381/096089293765559278. [DOI] [PubMed] [Google Scholar]
- 36.Alemzadeh R, Langley G, Upchurch L, Smith P, Slonim AE. Beneficial effect of diazoxide in obese hyperinsulinemic adults. J Clin Endocrinol Metab. 1998;83:1911–1915. doi: 10.1210/jcem.83.6.4852. [DOI] [PubMed] [Google Scholar]
- 37.Gordon DF, Woodmansee WW, Lewis SR, James RA, Wood WM, Ridgway EC. Cloning of the mouse somatostatin receptor subtype 5 gene: promoter structure and function. Endocrinology. 1999;140:5598–5608. doi: 10.1210/endo.140.12.7165. [DOI] [PubMed] [Google Scholar]
- 38.Mitra SW, Mezey E, Hunyady B, Chamberlain L, Hayes E, Foor F, Wang Y, Schonbrunn A, Schaeffer JM. Colocalization of somatostatin receptor sst5 and insulin in rat pancreatic beta-cells. Endocrinology. 1999;140:3790–3796. doi: 10.1210/endo.140.8.6937. [DOI] [PubMed] [Google Scholar]
- 39.Lunetta M, Di Mauro M, Le Moli R, Burrafato S. Long-term octreotide treatment reduced hyperinsulinemia, excess body weight and skin lesions in severe obesity with acanthosis nigricans. J Endocrinol Invest. 1996;19:699–703. doi: 10.1007/BF03349042. [DOI] [PubMed] [Google Scholar]
- 40.Giustina A, Girelli A, Buffoli MG, Cimino A, Legati F, Valentini U, Giustina G. Low-dose octreotide is able to cause a maximal inhibition of the glycemic responses to a mixed meal in obese type 2 diabetic patients treated with insulin. Diabetes Res Clin Pract. 1991;14:47–54. doi: 10.1016/0168-8227(91)90052-f. [DOI] [PubMed] [Google Scholar]
- 41.Bertoli A, Magnaterra R, Borboni P, Marini MA, Barini A, Fusco A, Bollea MR. Dose-dependent effect of octreotide on insulin secretion after OGTT in obesity. Horm Res. 1998;49:17–21. doi: 10.1159/000023120. [DOI] [PubMed] [Google Scholar]
- 42.Simsolo RB, Ezzat S, Ong JM, Saghizadeh M, Kern PA. Effects of acromegaly treatment and growth hormone on adipose tissue lipoprotein lipase. J Clin Endocrinol Metab. 1995;80:3233–3238. doi: 10.1210/jcem.80.11.7593431. [DOI] [PubMed] [Google Scholar]
- 43.Lotter EC, Krinsky R, McKay JM, Treneer CM, Porter D, Jr, Woods SC. Somatostatin decreases food intake of rats and baboons. J Comp Physiol Psychol. 1981;95:278–287. doi: 10.1037/h0077777. [DOI] [PubMed] [Google Scholar]
- 44.Levine AS, Morley JE. Peripherally administered somatostatin reduces feeding by a vagal mediated mechanism. Pharmacol Biochem Behav. 1982;16:897–902. doi: 10.1016/0091-3057(82)90041-7. [DOI] [PubMed] [Google Scholar]
- 45.Campbell RM, Scanes CG. Inhibition of growth hormone-stimulated lipolysis by somatostatin, insulin, and insulin-like growth factors (somatomedins) in vitro. Proc Soc Exp Biol Med. 1988;189:362–366. doi: 10.3181/00379727-189-42819. [DOI] [PubMed] [Google Scholar]
- 46.Jimenez J, Zuniga-Guajardo S, Zinman B, Angel A. Effects of weight loss in massive obesity on insulin and C-peptide dynamics: sequential changes in insulin production, clearance, and sensitivity. J Clin Endocrinol Metab. 1987;64:661–668. doi: 10.1210/jcem-64-4-661. [DOI] [PubMed] [Google Scholar]
- 47.Hansen TB, Gram J, Bjerre P, Hagen C, Bollerslev J. Body composition in active acromegaly during treatment with octreotide: a double-blind, placebo-controlled cross-over study. Clin Endocrinol (Oxf ) 1994;41:323–329. doi: 10.1111/j.1365-2265.1994.tb02552.x. [DOI] [PubMed] [Google Scholar]
- 48.Adami GF, Gandolfo P, Scopinaro N. Binge eating in obesity. Int J Obes Relat Metab Disord. 1996;20:793–794. [PubMed] [Google Scholar]
- 49.Blum I, Nessiel L, Graff E, Harsat A, Gabbay U, Sulkes J, Raz O, Vered Y. Food preferences, body weight, and platelet-poor plasma serotonin and catecholamines. Am J Clin Nutr. 1993;57:486–489. doi: 10.1093/ajcn/57.4.486. [DOI] [PubMed] [Google Scholar]
- 50.Hsu LK, Betancourt S, Sullivan SP. Eating disturbances before and after vertical banded gastroplasty: a pilot study. Int J Eat Disord. 1996;19:23–34. doi: 10.1002/(SICI)1098-108X(199601)19:1<23::AID-EAT4>3.0.CO;2-Y. [DOI] [PubMed] [Google Scholar]
- 51.Peiris AN, Mueller RA, Smith GA, Struve MF, Kissebah AH. Splanchnic insulin metabolism in obesity. Influence of body fat distribution. J Clin Invest. 1986;78:1648–1657. doi: 10.1172/JCI112758. [DOI] [PMC free article] [PubMed] [Google Scholar]