

Abstract
Overexpression of c-Myc and inactivation of p53 are hallmarks of human Burkitt's lymphomas. We had previously showed that transduction of murine p53-null bone marrow cells with a Myc-encoding retrovirus is sufficient for B lymphomagenesis. To address the role of Myc in tumor sustenance, we generated lymphomas induced by the Mycestrogen receptor fusion protein (MycER). Engrafted hosts were continuously treated with the ER ligand 4-hydroxytamoxifen (4-OHT) to allow tumor formation. Subsequent inactivation of MycER via 4-OHT deprivation resulted in tumor stasis but only partial regression. At the cellular level, dormant neoplastic lymphocytes withdrew from mitosis and underwent further B-cell differentiation. Concomitantly, they up-regulated genes involved in lymphocyte proliferation and survival, most notably interleukin 10 receptor α (IL10Rα) and CD20, the target for antibody therapy with Rituxan. We found that overexpression of IL10Rα affords significant proliferative advantages and in 4-OHT–deprived animals correlates with eventual tumor relapse. Both dormant and relapsing tumors maintain IL10Rα expression suggesting that they might be sensitive to emerging drugs targeting the IL-10 pathway. Up-regulation of CD20 following Myc inactivation was also observed in immortalized human lymphocytes. Importantly, in this system, MycOFFCD20HIGH cells were more prone to Rituxan-induced apoptosis than MycONCD20MED. Thus, targeting Myc, while moderately effective on its own, shapes the phenotype of dormant neoplastic cells and sensitizes them to adjuvant molecular therapies.
Introduction
Human Burkitt's lymphomas and their murine counterparts plasmacytomas arise from B-cell precursors following translocations juxtaposing the c-Myc proto-oncogene and one of the immunoglobulin enhancers (reviewed in ref. 1). Thus, inactivation of Myc might impair neoplastic growth, and drugs targeting this oncoprotein are being developed (2). However, whether targeting of Myc would afford clinical benefits to lymphoma patients remains unclear. Several strains of transgenic mice bearing inducible or repressible alleles of Myc have been generated to address this issue. Expression of the Myc-estrogen receptor (MycER) fusion in suprabasal compartments of the skin results in estrogen-dependent papillomatosis, a precancerous condition (3). Similarly, expression of a tetracycline-dependent allele of Myc in hematopoietic cells leads to the formation of T lymphomas (4), osteogenic sarcomas (5), and B-cell lymphomas (6). In all these systems, brief inactivation of Myc results in rapid proliferative arrest, terminal differentiation, and apoptosis of tumor cells. However, acquisition of secondary mutations can abrogate the reliance of lymphoma cells on continuous Myc expression (7). Similarly, Myc-induced murine breast carcinomas initially respond to Myc-targeting but subsequently accumulate mutations in the Ki-Ras oncogene which render therapy ineffective (8). Moreover, recent work has shown that many neoplastic cells with down-regulated Myc survive in a dormant state while retaining the capacity to form tumors upon Myc reactivation (9, 10).
These findings suggest that in the clinical setting anti-Myc therapies will not be curative on their own and will require simultaneous inactivation of other targets. Such adjuvant therapies are likely to be cell type specific, necessitating the investigation of Myc function in neoplastic B cells. The contribution of Myc to B lymphomagenesis has been studied extensively using transgenic mice (reviewed in ref. 11), but only recently have B-cell neoplasms with conditionally active Myc been generated (6). However, it was not clear whether these neoplasms acquire additional oncogenic lesions, in particular, mutations in the p53 pathway characteristic of advanced human B lymphomas. We have previously shown that s.c. coinjection of primary p53-null bone marrow cells (BMC) and Myc retrovirus-producing packaging cells results in the formation of polyclonal, short-latency lymphomas (12). All Myc/p53-null lymphomas possess the B-cell phenotype in vivo, although some of them are derived from hematopoietic precursors with the dual B-lymphoid/myeloid potential (13). In this study, we set out to generate neoplasms using the estrogen-dependent allele of Myc and determine the consequences of Myc inactivation in this two-hit system. We were particularly interested in determining whether switching Myc off leads to up-regulation of additional therapeutic targets.
Materials and Methods
Mice
p53-null and wild type C57BL6/J mice were obtained from The Jackson Laboratory (Bar Harbor, ME). BMC harvest and infection and production of BMC-derived neoplasms have been described previously (12). For 4-hydroxytamoxifen (4-OHT) treatment, the hormone powder (H6278, Sigma, St. Louis, MO) was dispersed, via sonication, in corn oil (Sigma) at the concentration of 10 mg/mL. The administration of 4-OHT was done via daily i.p. injections at the dose of 1 mg per mouse.
Analyses of tumor specimens
Histologic staining and flow cytometric analyses were done as described previously (12). TUNEL staining was done using the In situ Cell Death Detection Kit/TMR red (Roche Diagnostics, Indianapolis, IN) per manufacturer's recommendations. For Ki-67 staining, paraffin-embedded 4-μm tissue sections were deparaffinized in xylene and rehydrated in graded ethyl alcohol. Endogenous peroxidase was quenched by placing slides in 3% hydrogen peroxide (H1009, Sigma) for 15 minutes. Ki-67 antigen unmasking was accomplished by heating the sections in Antigen Unmasking Solution (H3300, Vector Laboratories, Burlingame, CA) in a microwave oven. Nonspecific staining was blocked by applying 5% normal rabbit serum for 20 minutes at room temperature. The slides were incubated with 100 μL diluted (1:40) primary antibody (TEC-3 Ki-67, DAKO Corp., Carpinteria, CA) for 2 hours at room temperature in a humidified chamber. Biotinylated rabbit anti-rat secondary antibody was applied for 60 minutes at room temperature followed by incubation with the appropriate reagents from the avidin-biotin complex method Kit (PK-4004, Vector Laboratories) for 45 minutes. The slides were rinsed and stained with Dako DAB Chromagen (K3465, DAKO) and counterstained with Hematoxylin QS (H3404, Vector Laboratories) for 20 seconds. Green fluorescent protein (GFP)–expressing neoplastic cells were also detected using fluorescent microscopy. For flow cytometric analysis of BMC, cell suspensions were washed once with PBS, and RBC were hypotonically lysed by resuspending cell pellets in 9 mL of distilled water. 20 seconds later 1 mL of 10× PBS was added, and cells were washed again before analysis. The analysis of tumor clonality was done using the detection of DJ-recombination events as described previously (12).
Generation of and infection with the MycER retrovirus
The MycER transgene was excised from the pBabePuro/MycER vector (14) and subcloned into the EcoRI site of MIGR1. MIGR1-MycER and the control MIGR1 retroviral DNAs were transfected into GP+E86 packaging cells using the LipofectAMINE Plus Reagent (Invitrogen, Carlsbad, CA). The GFP-positive single cell clones were obtained by fluorescence-activated cell sorting (FACS) as described in (13). Ten microliters of conditioned medium from each clone were used to infect 1 × 10⁵ NIH3T3 cells cultured in 6-well plates. Percentages of GFP-positive NIH3T3 cells were determined 48 hours later using flow cytometry. Cell clones yielding >2% of GFP-positive NIH3T3 cells were pooled together and used for BMC transduction in vivo.
Generation of and infection with the interleukin 10 receptor α–encoding retrovirus
To generate the MIGR1-mIL10Rα retrovirus, total RNA was isolated using TriReagent (Sigma) from Myc3-mBCL cells and the cDNA was prepared using the SuperScript First-Strand Synthesis System for reverse transcription-PCR (RT-PCR; Invitrogen). The coding sequence of mIL10Rα was amplified using the Advantage HF2 PCR kit (Clontech, Palo Alto, CA) and the following primers: 5V-GCCGGAGGCGTAAAGGCCGGCTCCAG-3′ (sense) and 5′-GGTACAGGGAGGGGAGCAGGCATGGCTG-3′ (antisense). IL10Rα cDNA was initially cloned into the PCR-II vector using the TOPO TA Cloning Kit (Invitrogen) and after sequence verification was inserted into the MIGR1 retrovirus using BamHI and XhoI restriction sites. For in vitro infections with the IL10Rα retrovirus, BOSC23 packaging cells were transfected with either MIGR1 or MIGR1-IL10Rα using Lipofect-AMINE 2000 (Invitrogen). Conditioned media were harvested and added to Myc3-mBCL cells for 12 hours. Three days post infection, GFP-positive cells were obtained using FACS.
Culturing of B-lymphoid cells in vitro
MycER-expressing tumor cells were cultured on monolayers of γ-irradiated S17 cells as described in ref. (13). P493-6 cells (15) were cultured in RPMI 1640 with or without doxycycline (10 ng/mL). When indicated, P493-6 cells were treated with Rituxan (Genentech, Inc., South San Francisco, CA) at the final concentration of 20 μg/mL. For analytic purposes (flow cytometry), Rituxan was conjugated with FITC at the University of Pennsylvania Cell Center Services Facility.
Microarray analysis
Total RNAs from MycER tumors 118 and 119 (MycON) and 120 and 121 (MycOFF) were used. cRNAs were synthesized using in vitro transcription with biotinylated CTP and UTP. Labeled probes were hybridized to the U74v2 gene chip (Affymetrix, Inc., Santa Clara, CA) using the PENN Microarray Facility's standard protocol (http://www.med.upenn.edu/microarr/Data%20Analysis/Affymetrix/methods.htm). Affymetrix MAS 5 probe set signals and presence/absence flags were calculated. The local pooled error test for differential expression as implemented in S+ArrayAnalyzer v 1.1 (Insightful Corp., Seattle, WA) was applied with 1% Bonferonni multiple testing correction to median IQR normalized MAS 5 signal values. The resulting list of 686 genes was imported into GeneSpring v 6.1 (Silicon Genetics, San Carlos CA), filtered for Presence (per Affymetrix MAS5 analysis) in two of two samples in one or more conditions (MycON or MycOFF), and then filtered for fold change (>2.5-fold). This analysis yielded 352 genes; 184 of them were expressed at higher levels in MycON tumors and 168 in MycOFF tumors. The lists were compared with the Gene Ontology Biological Process category list using the EASE v 2.0 software (NIH, NIAID; ref. 16) and Bonferroni correction.
Flow cytometric analyses
To detect expression of surface markers, standard techniques were applied. Staining with antibodies was done on ice for 30 to 45 minutes. For B220 staining, a PE-conjugated anti-mouse B220 antibody was used (PharMingen, San Diego, CA). For mIL10Rα staining, a biotin-conjugated anti-mouse IL10Rα antibody was used (PharMingen). For human CD20 staining, either Rituxan or a FITC-conjugated anti-hCD20 antibody were used (MHCD2001, Caltag, Burlingame, CA).
Real-time PCR
Total RNAs were isolated using TRI Reagent (Sigma) and treated with a TURBO DNA-free kit (Ambion, Inc., Austin, TX). cDNAs were prepared using SuperScript First-Strand Synthesis System for RT-PCR (Invitrogen). Amplification reactions were done using Titanium Taq DNA polymerase (BD Biosciences, Palo Alto, CA), SYBRgreen I (Roche Diagnostics) in LightCycler (Roche Diagnostics). The following cycling variables were commonly used: 1 second at 95°C for denaturation and 10 to 47 seconds at 68°C to 72°C for annealing and extension for the total of 30 cycles. Primer sequence information is available upon request.
Cell death, proliferation, and accumulation assays
P493-6 cells (2 × 10⁴ cells per well) were cultured in media with 10% tetracycline-free fetal bovine serum (BD Biosciences) in the presence or absence of doxycycline (10 ng/mL). Silencing of Myc was confirmed using immunoblotting with an anti-c-Myc antibody (Santa Cruz Biotechnology, Santa Cruz, CA). For apoptosis induction, after 12 hours of incubation with doxycycline, Rituxan (20 αg/mL) was added for additional 12 hours. Apoptotic cells were detected using staining with Annexin V (17). Annexin V was used in either PE- or APC-conjugated form (BD Biosciences) or as a fusion with GFP. To measure the extent of cell lysis, release of lactate dehydrogenase (LDH) was quantitated in aliquots of culture supernatant from duplicate wells using a colorimetric cytotoxicity detection kit (Roche Diagnostics) and a plate reader set at the wavelength of 492 nm. Cell proliferation was assessed using 3H-thymidine incorporation. Cell accumulation was quantitated in a colorimetric assay using the WST-1 reagent (Roche Diagnostics) and a plate reader set at the wavelength of 450 nm.
Results
Deactivation of Myc in murine B-cell lymphomas results in tumor dormancy and eventual relapse
The MycER-encoding retrovirus was generated as described in Materials and Methods. To generate MycER/p53-null neoplasms, BMC from p53-null animals were transduced in vivo per our protocol (12). Hosts engrafted with transduced cells received daily injections of 4-OHT as detailed in Materials and Methods and developed neoplasms after 4 to 5 weeks. Two independently derived neoplasms (MycER1 and MycER2) were chosen for tumor load experiments and were found to behave in a similar fashion.
In the first experiment, 5 × 10⁶ MycER cells were injected into the tail veins of nonirradiated mice, and the spread and survival of lymphoma cells were monitored using GFP fluorescence. In animals continuously treated with 4-OHT, by day 14, MycER lymphoblasts comprised the majority of cells in the bone marrow (Fig. 1A, B, and C, left), as evidenced by both flow cytometry and fluorescent microscopy. They were also efficient in colonizing lymph nodes and visceral organs, especially the liver and the spleen (data not shown). In contrast, on day 14 bone marrows of 4-OHT–deprived animals contained only solitary GFP-positive cells (Fig. 1A, middle, B, C, right). However, by day 19, MycER lymphoblasts started to colonize bone marrow even in untreated mice (Fig. 1A, right). Consequently, the animals appeared moribund and had to be sacrificed. On postmortem examination, numerous GFP-positive cells were detectable in lymph nodes and viscera (data not shown).
Figure 1.
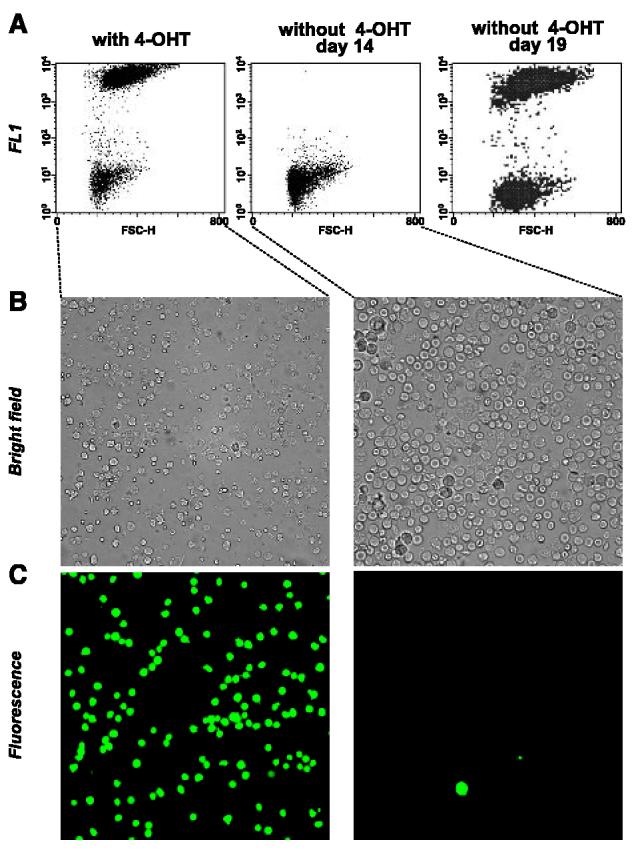
Effects of 4-OHT on colonization of bone marrow by MycER tumor cells. A, flow cytometric analysis of bone marrows of mice injected i.v. with MycER cells and maintained with or without 4-OHT. Day 14 and day 19 are days after injection. Analysis of bone marrow cells using bright field (B) and fluorescent microscopy (C). Panels in both columns depict same microscopic fields.
To obtain a better measurement of tumor growth kinetics, 8 × 10⁶ primary tumor cells were also injected s.c. into flanks of syngeneic C57B6/J mice that continued to receive 4-OHT. Palpable tumors were allowed to form, and two experimental groups were established on day 8. Mice in the first group continued to receive 4-OHT (MycON), rapidly developed very large tumors, and had to be sacrificed (Fig. 2A, solid lines). In the second group (MycOFF), 4-OHT treatment was discontinued (Fig. 2A, dotted lines). Differences in tumor volumes between 4-OHT–treated and untreated animals became apparent as early as after 24 to 48 hours. However, in animals taken off 4-OHT, tumors did not undergo complete regression; instead tumor volumes stabilized until approximately day 21.
Figure 2.
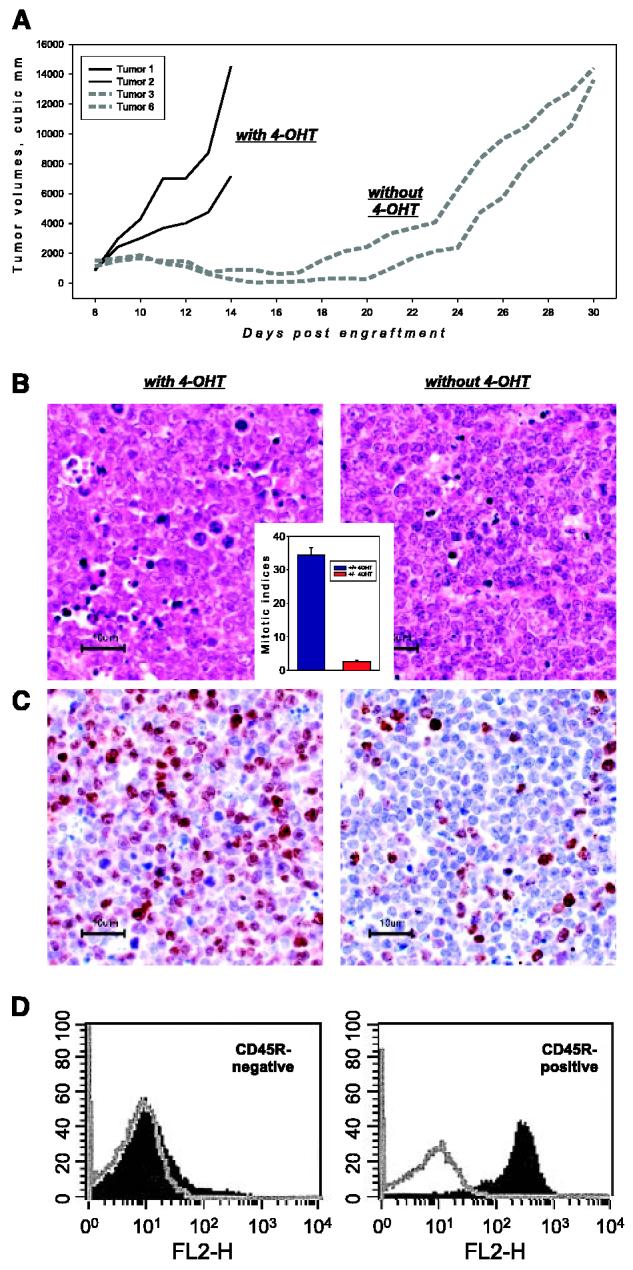
Effects of 4-OHT on subcutaneous growth of MycER tumor cells. A, tumor volumes versus days after engraftment of individual neoplasms from 4-OHT–treated (solid lines) and untreated (dotted lines) animals. B, histologic staining of representative specimens from (A). Inset, mitotic indices in MycON and MycOFF tumors on day 12. B, Ki-67 staining of the same specimens. Ki-67–positive nuclei appear in brown, all nuclei are counterstained in blue. D, flow cytometric analysis of B220 expression on the surface of cells from MycON and MycOFF tumors. Gray plots are samples stained with a control antibody.
To determine the cellular mechanisms of tumor stasis, TUNEL, H&E, and Ki-67 stainings of MycON and MycOFF tumor sections were done. We observed that upon inactivation of Myc, rates of cell death actually decreased (data not shown), consistent with the well-established role of Myc in apoptosis (reviewed in ref. 18). However, rates of cell proliferation were also lower, as reflected in mitotic indices on H&E-stained sections (Fig. 2B). On average, MycOFF tumors contained 10 times fewer mitotic cells than MycON tumors (Fig. 2B, inset). Furthermore, unlike their MycON counterparts, MycOFF cells were also positive for CD45R (B220 antigen; Fig. 2D), an evidence of their commitment to the B-cell lineage (19). Finally, we stained the samples with the monoclonal antibody Ki-67 raised against the proliferation-associated antigen that is expressed in all active phases of the cell cycle (G1-M) but is absent in G0 cells (20). Whereas there was a significant decrease in the number of Ki-67–positive cells in MycOFF cells (Fig. 2C), Ki-67–positive cells were not completely eliminated. Given very low mitotic indices, they were presumably arrested in G1 or G2 phases of the cell cycle, suggesting that MycOFF tumors have the potential to relapse. Indeed, at about day 21 post-implantation, all lymphomas in 4-OHT–deprived mice resumed progressive growth, defined as the doubling of tumor volume in ≤2 days.
Tumor relapse is not due to clonal selection or 4-hydroxytamoxifen–independent Myc activity
We wished to determine whether tumors are relapsing because of the adaptation of MycOFF cells to MycER-independent growth. Alternatively, tumor relapse could be brought about by mutations in additional oncogenes or 4-OHT–independent MycER activity. To distinguish among these possibilities, we first assessed the clonality on relapsing tumors. This assessment was done by analyzing rearrangements of D and J regions of the immunoglobulin heavy chain loci. D-J junctions were amplified using PCR and the specificity of resultant fragments was confirmed using Southern blotting (21). As described in our prior publication (12), all original Myc/p53-null lymphomas are polyclonal, as evidenced by the abundance of individual recombination products (Fig. 3A, first two and last lanes). In this respect, they closely resemble patently polyclonal bone marrow populations (Fig. 3A, penultimate lane). When relapsing tumors were analyzed, we found that their genetic complexity equals that of the original neoplasms (Fig. 3A, compare specimens A/B and C/D). This suggested that no clonal selection takes place during the period of tumor stasis and that tumor relapse is not due to mutations in additional oncogenes or MycER itself.
Figure 3.
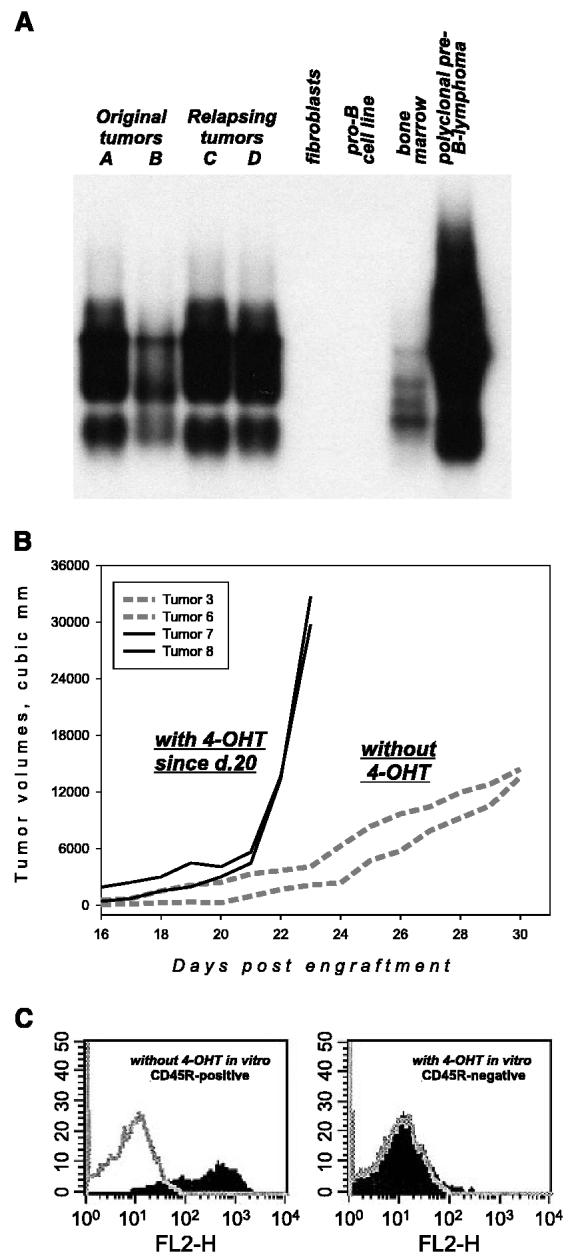
Molecular characterization of relapsing MycER tumors. A, analysis of tumor clonality. PCR amplification and detection of D-J junctions by Southern blotting were done as described in Materials and Methods. A and B, two original MycER tumors; C and D, two relapsing tumors. Genomic DNAs from rodent fibroblasts and pro-B cells without D-J rearrangements were used as negative controls. Genomic DNAs from total bone marrow and a previously characterized Myc-induced polyclonal lymphoma were used as positive controls. B, tumor volumes versus days after engraftment of individual neoplasms from 4-OHT–deprived (dotted lines) and retreated (solid lines) animals. C, flow cytometric analysis of B220 expression on the surface of cultured MycOFF cells. Cells were maintained in 4-OHT–free (left) or 4-OHT–containing media. Gray plots are samples stained with a control antibody.
It was still possible that tumors relapse because they no longer require 4-OHT for the activity of MycER. To rule out this possibility, we retreated mice bearing MycOFF tumors on the verge of relapse with 4-OHT. Readministration of 4-OHT immediately resulted in exponential growth (Fig. 3B) suggesting that MycOFF tumors are still highly sensitive to 4-OHT. Furthermore, the escaping tumors were distinct from the original neoplasms in that there were modest rates of cell proliferation but almost no apoptosis (data not shown). Lastly, when cultured in vitro, MycOFF cells were still positive for CD45R, but treatment with 4-OHT resulted in efficient CD45R down-regulation (Fig. 3C). We thus concluded that tumor relapse is due to the efficient adaptation of MycOFF cells to MycER-independent growth and not to the leakiness of the MycER system. This scenario is fully consistent with our observation that in tumor production experiments only 4-OHT–treated animals bearing transduced bone marrow cells develop neoplasms (data not shown).
Inactivation of Myc results in up-regulation of the interleukin 10 receptor which promotes neoplastic growth
To identify genes that might be responsible for Myc-independent tumor growth and eventual relapse, we performed microarray analysis of gene expression profiles in MycON versus MycOFF lymphomas. We then searched the list of differentially expressed genes for B-cell growth factors or receptors thereof, reasoning that up-regulation of such genes might result in increased cell proliferation and/or survival in the absence of functional Myc. The only such gene corresponded to the α subunit of the IL10R. IL-10 has been known to stimulate proliferation of normal B cells in vitro (22), but its in vivo effects on both normal and neoplastic B cells are poorly characterized. Recently, it has been suggested that high levels of IL-10 signaling are in fact incompatible with B lymphomagenesis (23).
To determine the significance of IL10Rα regulation in Myc-induced lymphomas, we first validated the microarray data using real-time RT-PCR (see Materials and Methods). We observed that the IL10Rα mRNA was indeed up-regulated 8- to 10-fold upon inactivation of MycER whereas mRNAs encoding actin and the β subunit of the IL10Rβ were unaffected (Fig. 4A, first two columns; data not shown). Also unaffected were IL10Rα levels in 4-OHT–treated Myc, not MycER, -induced tumors (data not shown). This suggested that the effects of 4-OHT are mediated by MycER and not the endogenous ER. We also stained the corresponding tumor samples with an antibody against IL10Rα. The IL10Rα protein levels were several fold higher in tumor cells from 4-OHT–deprived animals (Fig. 4B). These cells were then briefly cultured in vitro where they maintained elevated levels of IL10Rα (Fig. 4C, left). However, upon restimulation with 4-OHT, levels of IL10Rα decreased again (Fig. 4C, right). This reversible regulation in briskly growing cells suggested that up-regulation of the il10ra gene in 4-OHT–deprived cells is not merely a marker of growth arrest.
Figure 4.

The effects of IL10 signaling on growth of murine B-cell lymphomas in vivo. A, real-time RT-PCR analyses of mRNAs corresponding to indicated genes. All reactions were done in triplicates, and at least two independent tumors of each type were analyzed. B-D, flow cytometric analysis of IL10Rα expression on the surface of Myc-transformed cells. MycON and MycOFF refer to primary tumors or cultured MycOFF cells (“in vitro”). “off>on” denotes MycOFF cells reexposed to 4-OHT. Myc3-mBCL cells were infected with either empty vector (MIGR1, left) or the IL10Rα-encoding retrovirus (MIGR1/IL10Rα, right). Gray plots are samples stained with a control antibody. E, tumor weights corresponding to neoplasms derived from Myc3-mBCL cells transduced with the empty vector or the IL10Rα-encoding retrovirus.
To determine whether the expression levels of IL10Rα are rate limiting, we have generated a retrovirus coexpressing murine IL10Rα and GFP (see Materials and Methods). This virus was then used to infect Myc3-mBCL cells (13) in which IL10Rα levels were as low as in MycON cells (Fig. 4D, left). Upon infection and FACS for GFP-positive cells, transduced lymphoma cells expressed elevated levels of IL10Rα that were comparable to that observed in MycOFF cells (Fig. 4D, right). Following sorting for GFP, these cells formed tumors that were on average 4-fold larger than those formed by vector-transduced cells (Fig. 4E). We also observed a strong selection for high levels of IL10Rα in vivo, when IL10RαHIGH and IL10RαLOW cell were admixed before engraftment (data not show). The MycOFFIL10RHIGH phenotype of dormant tumors suggests that to be clinically effective, Myc-targeting might have to be combined with an anti–IL-10 therapy. Such a therapy could target either IL10Rα itself or its downstream effectors (see Discussion).
Inactivation of Myc causes the emergence of well-differentiated CD20-positive neoplasms: implications for Rituxan therapy
To determine whether neoplasms with inactivated Myc express additional therapeutic targets, we analyzed all the genes that were expressed differentially in MycON versus MycOFF samples. Statistical analysis (see Materials and Methods) yielded 352 mRNAs that were present in either MycON or MycOFF tumors and whose expression levels differed by >2.5-fold; 184 genes were expressed at higher levels in MycON cells and 168 in MycOFF cells. The two lists were run against the Gene Ontology database using the EASE software package (ref. 16; http://david.niaid.nih.gov/david/ease.htm), to determine what categories of genes are primarily affected by Myc.
Predictably, for Myc-activated mRNAs, the highest EASE score was assigned to genes falling into the Gene Ontology category “Mitotic cell cycle/Proliferation.” Thirty-eight of Myc target genes belonged to this category, and 15 of them exhibited >4-fold down-regulation when Myc was switched off (Table 1). Some of them represented known targets such as Dp1, the component of the E2F multimeric transcription factor (24, 25). Interestingly, the list of Myc-repressed genes bore the strongest similarity to the Gene Ontology category “Defense/Immune Response” containing numerous B-cell differentiation markers such as MHC class II molecules and immunoglobulin heavy and light chains. In all, 34 Myc-repressed genes were represented by this category, and 18 of them were up-regulated >4-fold upon Myc inactivation (Table 1). This was consistent with the observation that Myc overexpression renders B cells nonimmunogenic (26).
Table 1.
Groups of Myc-regulated genes with strongest similarities to known gene ontology categories
| Myc-activated genes with the best EASE score (1.3 × 10⁻¹²): gene ontology category “Mitotic cell cycle/Proliferation” (top 15 of 38) | Fold change |
|---|---|
| ect2 oncogene | 6.4 |
| cyclin B1 | 6.0 |
| topoisomerase (DNA) II α | 5.3 |
| polo-like kinase (Drosophila) | 5.0 |
| proliferating cell nuclear antigen | 5.0 |
| Geminin | 4.9 |
| CDC28 protein kinase regulatory subunit 2 | 4.7 |
| ribonucleotide reductase M1 | 4.6 |
| antigen identified by monoclonal antibody Ki 67 | 4.6 |
| cell division cycle 2 homologue A (Schizosaccharomyce pombe) | 4.5 |
| breast cancer 2 | 4.4 |
| karyopherin (importin) α 2 | 4.2 |
| budding uninhibited by benzimidazoles 1 homologue (Saccharomyces cerevisiae) | 4.2 |
| cyclin B2 | 4.0 |
| serine/threonine kinase 6 | 4.0 |
| Myc-repressed genes with the best EASE score (6 × 10⁻¹⁴): gene ontology category “Defense/Immune response” (top 18 of 34) | Fold change |
|---|---|
| histocompatibility 2, class II, locus Mb1 | 20.4 |
| CD20; membrane-spanning four domains, subfamily A, member 1 | 14.0 |
| lymphotoxin B | 13.6 |
| CD1d1 antigen | 9.7 |
| histocompatibility 2, K region | 8.7 |
| CD2 antigen | 7.8 |
| histocompatibility 2, class II antigen A, α | 7.6 |
| guanylate nucleotide binding protein 3 | 7.1 |
| IFN-activated gene 205 | 6.8 |
| immunoglobulin heavy chain 4 (serum IgG1) | 6.6 |
| histocompatibility 2, class II antigen A, β 1 | 5.9 |
| Ia-associated invariant chain | 5.5 |
| protein tyrosine phosphatase, receptor type, C | 4.8 |
| histocompatibility 2, class II antigen E β | 4.3 |
| IFN-activated gene 203 | 4.2 |
| histocompatibility 2, class II, locus DMa | 4.1 |
| immunoglobulin κ chain variable 8 (V8) | 4.1 |
| histocompatibility 2, T region locus 23 | 4.1 |
Also notable was the fact that the second highest gene on that list (14-fold up-regulation in MycOFF cells) was the B-lymphocyte surface antigen CD20 (also called MS4A1; ref. 27) whose human orthologue is the target for Rituxan (IDEC-C2B8), a humanized monoclonal antibody approved by Food and Drug Administration for the treatment of B-cell lymphoma (28). Insofar as responses to Rituxan are dictated by levels of CD20, its up-regulation in MycOFF cells could render them more sensitive to this antibody-based therapy. CD20 mRNA was indeed up-regulated 10- to 20-fold upon inactivation of MycER, whereas the Dp1 gene was down-regulated (real-time PCR data; Fig. 2A, four middle columns). CD20 levels were unaffected by 4-OHT in tumors not expressing MycER (data not shown).
We were hindered in the analysis of the murine CD20 protein levels by the lack of a commercially available antibody. Whereas anti-mouse CD20 antibodies have been described in the literature (29), they were not made available for this study. We thus used another experimental system, human B-lymphocytes immortalized by the EBV EBNA1 protein and conditionally transformed by doxycycline-repressible c-Myc (15). We confirmed, using Western blotting, that exposure of these P493-6 cells to doxycycline for 24 or 48 hours results in strong suppression of c-Myc levels (Fig. 5A) and a sharp decrease in cell proliferation (ref. 15; data not shown). This was reminiscent of the effects of 4-OHT withdrawal in our B-lymphoma model. We thus analyzed CD20 levels using flow cytometry and fluorescently labeled Rituxan. When grown in doxycycline-free medium, P493-6 cells express intermediate levels of CD20. Upon addition of doxycycline and ensuing silencing of Myc, levels of CD20 increased 3- to 4-fold (Fig. 3B). This result suggested that repression of CD20 levels by Myc is a common feature of B-lymphocytes from different species and organs (bone marrow and peripheral blood).
Figure 5.

CD20 expression and sensitivity to Rituxan of B-lymphoid cells conditionally transformed by Myc. A, Western blotting done on P493-6 cells, untreated or treated with doxycycline for 24 or 48 hours. Migration of bands corresponding to c-Myc and β-actin is indicated (arrows). B, flow cytometric analysis of CD20 expression on the surface of the cells from (A). Bottom, cells were treated with doxycycline for 24 hours. C, flow cytometric analyses of MycON P493-6 cells using fluorescently labeled Annexin V. P493-6 cells (top) were pretreated with a control antibody. Cells (bottom) were pretreated with Rituxan as described in Materials and Methods. Gray plots are samples stained with a control antibody. D, median intensities of Annexin V staining in P493-6 cells maintained with and without doxycyclin (MycOFF and MycON, respectively). Cells were also pretreated with a control antibody or Rituxan as in (C).
To determine whether Rituxan induces cell death in P493-6 cells, we treated them with this antibody for 12 hours and measured cell death by staining with fluorescently labeled Annexin V. As evidenced by flow cytometric profiles in Fig. 5C, pretreatment with Rituxan significantly increased Annexin V binding, which is indicative of impending apoptosis (17). To corroborate this finding, cell lysis was quantitated by measuring the release of LDH (see Materials and Methods). Consistent with the Annexin V data, pretreatment with Rituxan increased LDH release as well (data not shown).
We then set out to determine whether MycOFF/CD20HIGH P493-6 cells are more sensitive to Rituxan-mediated apoptosis than MycON/CD20MED cells. To this end, both cell populations were either left untreated or treated with Rituxan, and cell death was measured by calculating median intensities of Annexin V staining. After subtracting the background (staining induced by control antibody, dotted line), we observed a 3-fold increase in Annexin V levels after Myc was turned off (Fig. 5D). No effect of Myc on background staining was apparent. To measure accumulation of viable cells, WST assay was also done. We observed that both down-regulation of Myc and the treatment with Rituxan significantly reduced cell outgrowth, but the strongest reduction occurred when these two treatments were combined (data not shown). Thus, down-regulation of Myc indeed sensitizes Blymphocytes to Rituxan-mediated apoptosis in vitro and might synergize with this drug in vivo.
Discussion
The apparent genetic complexity of tumor cells (30) suggests that truly “smart” drugs must target molecules actively contributing to tumor sustenance. Still, to achieve sustained therapeutic effects, even the “smartest” drugs might have to be used in combinations, much like highly active anti-HIV retroviral therapy (HAART) relies on simultaneous delivery of protease inhibitors and nucleoside analogues (31). Herein, we show, for the first time, that inactivation of Myc in a two-hit mouse tumor model results in immediate cessation of cell proliferation but no complete regression (which was readily observed in one-hit models; refs. 5, 6). Following 4-OHT withdrawal, MycER/p53-null neoplasms enter a state of dormancy, with very low mitotic indices. At the same time, dormant MycOFF neoplasms contain much fewer apoptotic cells than their MycON counterparts. Predictably, 4-OHT withdrawal improves tumor cell survival, and after a lag period, all lymphomas resume progressive growth. Apparently, this relapse is not caused by 4-OHT–independent Myc activity, because readministration of 4-OHT immediately boosts neoplastic growth in vivo and readily reverses changes in gene expression in vitro. Most importantly, we found no evidence of clonal selection for additional mutations described in other model systems (7, 8). Thus, we concluded that Myc-initiated changes in cell physiology might activate proliferation and survival pathways that circumvent the requirement for Myc.
To identify such pathways, we analyzed the list of genes differentially expressed in MycOFF versus MycON cells. No transcriptional changes in well-recognized survival pathways (Akt, nuclear factor-κB, etc.) were apparent (data not shown). However, we observed pronounced up-regulation of the α subunit of the IL10R. To the best of our knowledge, this is the first demonstration that Myc controls IL10Ra levels. This is significant given the emerging role of IL-10 in B-lymphomagenesis. IL-10 has been known to stimulate proliferation of normal B cells (22) in vitro, but its in vivo effects are more complex. For instance, IL-10 can exert strong antiangiogenic and sometimes overt antineoplastic effects (23, 32). Herein, we show that in the murine system the IL-10 pathway strongly enhances B lymphomagenesis. IL-10 is known to signal predominantly through signal transducers and activators of transcription 3 (STAT3; reviewed in ref. 33), which is constitutively phosphorylated on Tyr705 in a variety of human neoplasms (34) including Burkitt's lymphoma (35). In turn, STAT3 activates expression of several antiapoptotic genes including Bcl-2, Bcl-xl, survivin, and Mcl1 (36). Provocatively, per our microarray data, Mcl1 was up-regulated in MycOFF tumors which have significantly lower levels of cell death compared with MycON tumors (data not shown). Thus, targeting of the IL-10 pathway using soluble IL10Ra (37) or a dominant-negative STAT3 (38) could block expansion of lymphoma cells that have survived an anti-Myc therapy.
With regard to additional therapeutic targets, Myc down-modulation also causes up-regulation of the CD20 antigen. Importantly, a humanized monoclonal antibody against CD20 (IDEC-C2B8, Rituxan) has proven an effective anti–lymphoma drug in murine systems (39) and human patients (28). However, in humans, the response rates do not exceed 50% and the average response lasts only 1 year (40). The mechanisms of resistance to Rituxan are poorly understood. One suggested mechanism invokes CD20 levels that may vary between individual cells over a log range (41). The molecular basis for such a heterogeneity remains undeciphered and no specific inhibitors of CD20 expression have been identified. Our data suggest that overexpression of Myc might interfere with CD20 expression and by inference, limit sensitivity to Rituxan. Indeed, using as a model P493-6 cells, we showed that lowering Myc levels synergizes with Rituxan treatment in vitro. While we cannot rule out the possibility that this occurs in a CD20-independent manner, elevation of CD20 levels should allow more efficient binding of Rituxan and presumably more robust downstream signaling.
Furthermore, future immunotherapies could use neutralizing antibodies against additional Myc-repressed B-cell differentiation markers identified by us (Mb1, lymphotoxin B, etc.) and by others (24-26). Such antibodies might be particularly effective in eliminating neoplastic cells that have survived anti-Myc therapies. As the latter are being developed and tested (2), these hypotheses could be addressed in pre-clinical and eventually clinical settings.
Acknowledgments
Grant support: NIH grants CA 097932 and CA 102709 (A. Thomas-Tikhonenko).
The costs of publication of this article were defrayed in part by the payment of page charges. This article must therefore be hereby marked advertisement in accordance with 18 U.S.C. Section 1734 solely to indicate this fact.
We thank Drs. Dirk Eick (Institute of Clinical Molecular Biology and Tumor Genetics, Munich, Germany) and Warren Pear (University of Pennsylvania) for providing us, respectively, with P493-6 cells and the MIGR1 vector; Dr. Martin Carroll (University of Pennsylvania) for his kind gift of Rituxan; David Dicker and Dr. Wafik El-Deiry (University of Pennsylvania) for the gift of GFP-conjugated Annexin V and the help with apoptosis assays; and Dr. Michael Goldschmidt and Julie Burns for their help with histopathologic analyses.
References
- 1.Cole MD. The myc oncogene: its role in transformation and differentiation. Annu Rev Genet. 1986;20:361–84. doi: 10.1146/annurev.ge.20.120186.002045. [DOI] [PubMed] [Google Scholar]
- 2.Hermeking H. The MYC oncogene as a cancer drug target. Curr Cancer Drug Targets. 2003;3:163–75. doi: 10.2174/1568009033481949. [DOI] [PubMed] [Google Scholar]
- 3.Pelengaris S, Littlewood T, Khan M, Elia G, Evan GI. Reversible activation of c-Myc in skin: induction of a complex neoplastic phenotype by a single oncogenic lesion. Mol Cell. 1999;3:565–77. doi: 10.1016/s1097-2765(00)80350-0. [DOI] [PubMed] [Google Scholar]
- 4.Felsher DW, Bishop JM. Reversible tumorigenesis by MYC in hematopoietic lineages. Mol Cell. 1999;4:199–207. doi: 10.1016/s1097-2765(00)80367-6. [DOI] [PubMed] [Google Scholar]
- 5.Jain M, Arvanitis C, Chu K, et al. Sustained loss of a neoplastic phenotype by brief inactivation of MYC. Science. 2002;297:102–4. doi: 10.1126/science.1071489. [DOI] [PubMed] [Google Scholar]
- 6.Marinkovic D, Marinkovic T, Mahr B, Hess J, Wirth T. Reversible lymphomagenesis in conditionally c-MYC expressing mice. Int J Cancer. 2004;110:336–42. doi: 10.1002/ijc.20099. [DOI] [PubMed] [Google Scholar]
- 7.Karlsson A, Giuriato S, Tang F, Fung-Weier J, Levan G, Felsher DW. Genomically complex lymphomas undergo sustained tumor regression upon MYC inactivation unless they acquire novel chromosomal translocations. Blood. 2003;101:2797–803. doi: 10.1182/blood-2002-10-3091. [DOI] [PubMed] [Google Scholar]
- 8.D'Cruz CM, Gunther EJ, Boxer RB, et al. c-MYC induces mammary tumorigenesis by means of a preferred pathway involving spontaneous Kras2 mutations. Nat Med. 2001;7:235–9. doi: 10.1038/84691. [DOI] [PubMed] [Google Scholar]
- 9.Shachaf CM, Kopelman AM, Arvanitis C, et al. MYC inactivation uncovers pluripotent differentiation and tumour dormancy in hepatocellular cancer. Nature. 2004;431:1112–7. doi: 10.1038/nature03043. [DOI] [PubMed] [Google Scholar]
- 10.Boxer RB, Jang JW, Sintasath L, Chodosh LA. Lack of sustained regression of c-MYC-induced mammary adenocarcinomas following brief or prolonged MYC inactivation. Cancer Cell. 2004;6:577–86. doi: 10.1016/j.ccr.2004.10.013. [DOI] [PubMed] [Google Scholar]
- 11.Adams JM, Harris AW, Strasser A, Ogilvy S, Cory S. Transgenic models of lymphoid neoplasia and development of a pan-hematopoietic vector. Oncogene. 1999;18:5268–77. doi: 10.1038/sj.onc.1202997. [DOI] [PubMed] [Google Scholar]
- 12.Yu D, Thomas-Tikhonenko A. A non-transgenic mouse model for B-cell lymphoma: in vivo infection of p53-null bone marrow progenitors by a Myc retrovirus is sufficient for tumorigenesis. Oncogene. 2002;21:1922–7. doi: 10.1038/sj.onc.1205244. [DOI] [PubMed] [Google Scholar]
- 13.Yu D, Allman D, Goldscmidt M, Atchison M, Monroe JG, Thomas-Tikhonenko A. Oscillation between B-lymphoid and myeloid lineages in Myc-induced hematopoietic tumors following spontaneous silencing/reactivation of the EBF/Pax5 pathway. Blood. 2003;101:1950–5. doi: 10.1182/blood-2002-06-1797. [DOI] [PMC free article] [PubMed] [Google Scholar]
- 14.Littlewood TD, Hancock DC, Danielian PS, Parker MG, Evan GI. A modified oestrogen receptor ligand-binding domain as an improved switch for the regulation of heterologous proteins. Nucleic Acids Res. 1995;23:1686–90. doi: 10.1093/nar/23.10.1686. [DOI] [PMC free article] [PubMed] [Google Scholar]
- 15.Pajic A, Spitkovsky D, Christoph B, et al. Cell cycle activation by c-myc in a Burkitt lymphoma model cell line. Int J Cancer. 2000;87:787–93. doi: 10.1002/1097-0215(20000915)87:6<787::aid-ijc4>3.0.co;2-6. [DOI] [PubMed] [Google Scholar]
- 16.Dennis G, Jr, Sherman BT, Hosack DA, et al. DAVID: Database for annotation, visualization, and integrated discovery. Genome Biol. 2003;4:3. [PubMed] [Google Scholar]
- 17.Bossy-Wetzel E, Green DR. Detection of apoptosis by Annexin V labeling. Methods Enzymol. 2000;322:15–8. doi: 10.1016/s0076-6879(00)22004-1. [DOI] [PubMed] [Google Scholar]
- 18.Evan GI, Vousden KH. Proliferation, cell cycle and apoptosis in cancer. Nature. 2001;411:342–8. doi: 10.1038/35077213. [DOI] [PubMed] [Google Scholar]
- 19.Hardy RR, Carmack CE, Shinton SA, Kemp JD, Hayakawa K. Resolution and characterization of pro-B and pre-pro-B cell stages in normal mouse bone marrow. J Exp Med. 1991;173:1213–25. doi: 10.1084/jem.173.5.1213. [DOI] [PMC free article] [PubMed] [Google Scholar]
- 20.Gerdes J, Lemke H, Baisch H, Wacker HH, Schwab U, Stein H. Cell-cycle analysis of a cell proliferation-associated human nuclear antigen defined by the monoclonal antibody Ki-67. J Immunol. 1984;133:1710–5. [PubMed] [Google Scholar]
- 21.Li YS, Hayakawa K, Hardy RR. The regulated expression of B lineage associated genes during B cell differentiation in bone marrow and fetal liver. J Exp Med. 1993;178:951–60. doi: 10.1084/jem.178.3.951. [DOI] [PMC free article] [PubMed] [Google Scholar]
- 22.Rousset F, Garcia E, Defrance T, et al. Interleukin 10 is a potent growth and differentiation factor for activated human B lymphocytes. Proc Natl Acad Sci U S A. 1992;89:1890–3. doi: 10.1073/pnas.89.5.1890. [DOI] [PMC free article] [PubMed] [Google Scholar]
- 23.Cervenak L, Morbidelli L, Donati D, et al. Abolished angiogenicity and tumorigenicity of Burkitt lymphoma by interleukin-10. Blood. 2000;96:2568. [PubMed] [Google Scholar]
- 24.Neiman PE, Ruddell A, Jasoni C, et al. Analysis of gene expression during myc oncogene-induced lymphomagenesis in the bursa of Fabricius. Proc Natl Acad Sci U S A. 2001;98:6378–83. doi: 10.1073/pnas.111144898. [DOI] [PMC free article] [PubMed] [Google Scholar]
- 25.Schuhmacher M, Kohlhuber F, Holzel M, et al. The transcriptional program of a human B cell line in response to Myc. Nucleic Acids Res. 2001;29:397–406. doi: 10.1093/nar/29.2.397. [DOI] [PMC free article] [PubMed] [Google Scholar]
- 26.Staege MS, Lee SP, Frisan T, et al. MYC over-expression imposes a nonimmunogenic phenotype on Epstein-Barr virus-infected B cells. Proc Natl Acad Sci U S A. 2002;99:4550–5. doi: 10.1073/pnas.072495599. [DOI] [PMC free article] [PubMed] [Google Scholar]
- 27.Tedder TF, Streuli M, Schlossman SF, Saito H. Isolation and structure of a cDNA encoding the B1 (CD20) cell-surface antigen of human B lymphocytes. Proc Natl Acad Sci U S A. 1988;85:208–12. doi: 10.1073/pnas.85.1.208. [DOI] [PMC free article] [PubMed] [Google Scholar]
- 28.Maloney DG, Grillo-Lopez AJ, White CA, et al. IDEC-C2B8 (Rituximab) anti-CD20 monoclonal antibody therapy in patients with relapsed low-grade non-Hodgkin's lymphoma. Blood. 1997;90:2188–95. [PubMed] [Google Scholar]
- 29.Uchida J, Lee Y, Hasegawa M, et al. Mouse CD20 expression and function. Int Immunol. 2004;16:119–29. doi: 10.1093/intimm/dxh009. [DOI] [PubMed] [Google Scholar]
- 30.Hahn WC, Weinberg RA. Modelling the molecular circuitry of cancer. Nat Rev Cancer. 2002;2:331–41. doi: 10.1038/nrc795. [DOI] [PubMed] [Google Scholar]
- 31.Rabkin CS. AIDS and cancer in the era of highly active antiretroviral therapy (HAART) Eur J Cancer. 2001;37:1316–9. doi: 10.1016/s0959-8049(01)00104-6. [DOI] [PubMed] [Google Scholar]
- 32.Huang S, Xie K, Bucana CD, Ullrich SE, Bar-Eli M. Interleukin 10 suppresses tumor growth and metastasis of human melanoma cells: potential inhibition of angiogenesis. Clin Cancer Res. 1996;2:1969–79. [PubMed] [Google Scholar]
- 33.Gamero AM, Young HA, Wiltrout RH. Inactivation of Stat3 in tumor cells: Releasing a brake on immune responses against cancer? Cancer Cell. 2004;5:111–2. doi: 10.1016/s1535-6108(04)00028-5. [DOI] [PubMed] [Google Scholar]
- 34.Bowman T, Garcia R, Turkson J, Jove R. STATs in oncogenesis. Oncogene. 2000;19:2474–88. doi: 10.1038/sj.onc.1203527. [DOI] [PubMed] [Google Scholar]
- 35.Weber-Nordt RM, Egen C, Wehinger J, et al. Constitutive activation of STAT proteins in primary lymphoid and myeloid leukemia cells and in Epstein-Barr virus (EBV)-related lymphoma cell lines. Blood. 1996;88:809–16. [PubMed] [Google Scholar]
- 36.Buettner R, Mora LB, Jove R. Activated STAT signaling in human tumors provides novel molecular targets for therapeutic intervention. Clin Cancer Res. 2002;8:945–54. [PubMed] [Google Scholar]
- 37.Ho AS, Liu Y, Khan TA, Hsu DH, Bazan JF, Moore KW. A receptor for interleukin 10 is related to interferon receptors. Proc Natl Acad Sci U S A. 1993;90:11267–71. doi: 10.1073/pnas.90.23.11267. [DOI] [PMC free article] [PubMed] [Google Scholar]
- 38.Niu G, Heller R, Catlett-Falcone R, et al. Gene therapy with dominant-negative Stat3 suppresses growth of the murine melanoma B16 tumor in vivo. Cancer Res. 1999;59:5059–63. [PubMed] [Google Scholar]
- 39.Reff ME, Carner K, Chambers KS, et al. Depletion of B cells in vivo by a chimeric mouse human monoclonal antibody to CD20. Blood. 1994;83:435–45. [PubMed] [Google Scholar]
- 40.Grillo-Lopez AJ. Rituximab: an insider's historical perspective. Semin Oncol. 2000;27:9–16. [PubMed] [Google Scholar]
- 41.Smith MR. Rituximab (monoclonal anti-CD20 antibody): mechanisms of action and resistance. Oncogene. 2003;22:7359–68. doi: 10.1038/sj.onc.1206939. [DOI] [PubMed] [Google Scholar]