Abstract
Changes in membrane capacitance (Cm) after photolysis of the caged Ca2+ compound dimethoxynitrophenamine were studied in protoplasts from maize coleoptiles. Changes in Cm values resulting from increased concentrations of free Ca2+ in the cytoplasm ([Ca2+]cyt) were interpreted as representing changes in [Ca2+]cyt–sensitive exocytosis and endocytosis. A continuous increase in [Ca2+]cyt resulted in a sigmoidal increase in Cm values with a half-maximal concentration at ∼1 μM. The steep increase in Cm values was followed by a variable slow phase in changing Cm values. When [Ca2+]cyt increased at a rate of 0.6 μmol L−1 sec−1, the initial steep increase in Cm values lasted ∼5 to 10 sec. During this time, protoplasts increased in surface area by ∼2.5%. The biphasic dynamics of [Ca2+]cyt–stimulated increases in Cm values can be described by a kinetic model containing two pools of vesicles with two [Ca2+]cyt–sensitive steps in the exocytotic pathway.
INTRODUCTION
For cell elongation, new membranes, proteins, and polysaccharide compounds must be delivered to the plasma membrane–cell wall interface (reviewed in Napier and Venis, 1995). Comparative electron microscopic studies of elongating cells in the apex of grass coleoptiles have shown that growing cells have increased numbers of dictyosomes and secretory vesicles in the cytoplasm (Quaite et al., 1983). This suggests that a growth-augmented demand for secretory activity is achieved by enhanced synthesis of vesicular membranes and transport cargo. An increase in secretory activity could therefore be viewed simply as the consequence of mass action driven by a greater number of secretory vesicles.
In recent electrophysiological studies, the secretory activity of maize coleoptile protoplasts has been assayed by monitoring membrane capacitance (Cm) (Thiel et al., 1994). This electrical variable is proportional to the surface area of the membrane and allows in vivo monitoring of changes in area related to exocytosis and endocytosis (Neher and Marty, 1982; Homann and Tester, 1998). The perfusion of protoplasts from maize coleoptiles containing a high concentration of cytoplasmic free Ca2+ ([Ca2+]cyt) (1 μM) caused a continuous increase in membrane capacitance. In contrast, membrane capacitance did not increase when protoplasts were perfused with low [Ca2+]cyt (Thiel et al., 1994). This result suggests that high concentrations of [Ca2+]cyt stimulate processes in the secretory pathway of these as well as many other eukaryotic cells (reviewed in Kasai, 1999), including plant cells (Zorec and Tester, 1992; Homann and Tester, 1997; Carroll et al., 1998). In experiments with coleoptile protoplasts, Cm values started to increase within seconds after the increase in [Ca2+]cyt (Thiel et al., 1994, 2000). Because the synthesis of secretory vesicles occurs in a time frame of minutes (e.g., Phillips et al., 1988), however, not seconds, the rapid response of membrane capacitance to [Ca2+]cyt excludes the possibility that the increase in secretory activity depends only on a [Ca2+]cyt–stimulated synthesis of secretory vesicles. Hence, [Ca2+]cyt must influence the secretory pathway downstream of where the secretory vesicles are produced.
In this study, the effect of [Ca2+]cyt stimulation on the secretory pathway was further examined by making use of the rapid increase of [Ca2+]cyt when Ca2+ is released from the caged Ca2+ compound 1-(2-nitro-4,5-dimethoxyphenyl)-1,2-diaminoethane-N,N,N′N′-tetraacetic acid (dimethoxynitrophenamine, or DMN) and simultaneously recording the membrane capacitance. We found that the rapid increase of [Ca2+]cyt resulted in a rapid increase in membrane capacitance followed by a more variable second phase. The latter consisted of either a continuous but slower increase in Cm values or a decrease. We conclude that the late stage of the secretory pathway is dominated by two serially arranged pools of vesicles in these cells. Ca2+ augments both forward steps from an upstream pool into exocytosis.
RESULTS
Increase of [Ca2+]cyt Causes an Increase in Membrane Capacitance
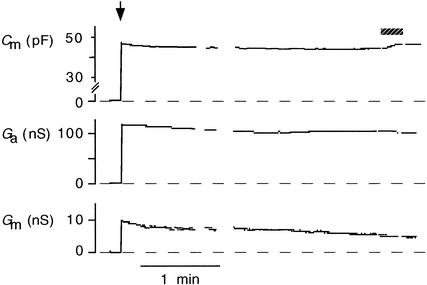
To examine whether changes in surface area were dependent on the concentration of [Ca2+]cyt, we measured [Ca2+]cyt and membrane capacitance simultaneously. Cm values were taken to be proportional to the plasma membrane surface area (Neher and Marty, 1982; Thiel et al., 1994; Homann and Tester, 1998). Figure 1 shows measurements of membrane capacitance in a protoplast from the apex of a maize coleoptile. After achieving the whole-cell configuration, the cell was perfused with standard buffer solution (see Methods) from the patch pipette. The Ca2+ concentration of this perfusion buffer was ∼4 nM (Xu et al., 1997). Perfusing the cytoplasm with this low-Ca2+ solution generally caused a slight decrease in Cm values during the first few minutes, after which the Cm values stabilized. Frequently, we found that the membrane conductance (Gm) also decreased slowly over a period of minutes. A representative tracing of Gm values is shown in Figure 1.
Figure 1.
Time Course of Membrane Capacitance, Access Conductance, and Membrane Conductance of a Coleoptile Protoplast during Perfusion of the Cytoplasm with a Pipette Solution Containing Low [Ca2+]cyt.
The arrow marks the time of breaking into whole-cell configuration. During the time indicated by the shaded bar, the protoplast was illuminated by UV380 to release Ca2+ from the caged precursor. Dashed lines indicate zero values for electrical variables. Ga, access conductance. pF, picofarad; nS, nanosimens, i.e., gigaohm−1.
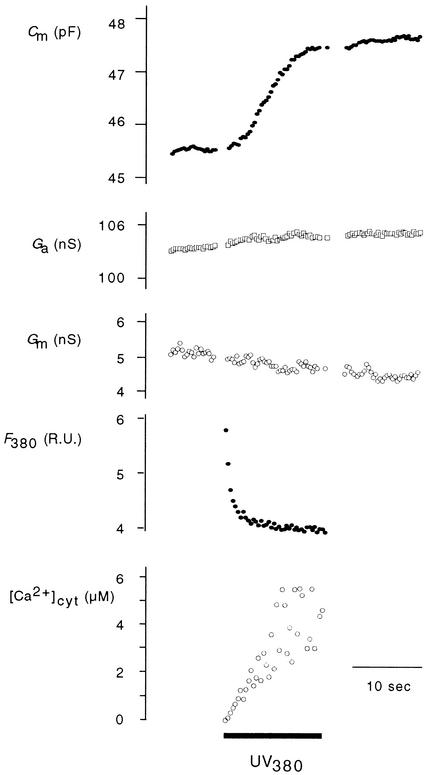
After allowing sufficient time for equilibrating the cytoplasm with the pipette solution (see Methods), [Ca2+]cyt was increased continuously from the low, resting value to micromolar concentrations. Figure 2 shows an enlargement of the electrical cell settings and the [Ca2+]cyt recording from Figure 1 before and during the increase of [Ca2+]cyt. Illumination of the protoplasts with UV radiation at 380 nm (UV380) caused the release of Ca2+ from its caged precursor DMN, resulting in a roughly exponential relaxation in fluorescent light emission (F380). This decrease in F380 values can be converted into [Ca2+]cyt by using Equation 1 (see Methods). In this case, [Ca2+]cyt increased over the 13.1 sec of illumination from 4 nM to ∼6 μM. Stimulated by this ramp elevation of [Ca2+]cyt, Cm values increased sigmoidally (Figure 2).
Figure 2.
Ramp Elevation of [Ca2+]cyt Stimulates an Increase in CARC in Maize Coleoptile Protoplast.
Enlargement of cell parameters from the section in Figure 1 indicated by the bar before and during illumination with UV light. The relaxation of fluorescence at 380 nm (F380) was used to calculate [Ca2+]cyt with Equation 1. The solid bar indicates the time of illumination with UV light. Ga, access conductance; R.U., relative units.
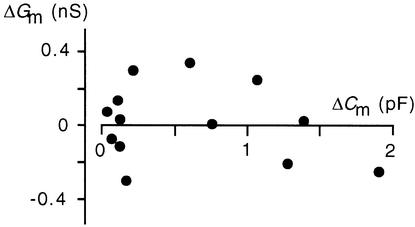
In the example shown in Figure 2, membrane conductance remained unaffected during the increase in membrane capacitance. This observation was confirmed by other measurements. Figure 3 shows a plot of [Ca2+]cyt–stimulated increases in Cm values versus the corresponding changes in Gm values from 13 randomly chosen experiments. The plot confirms that increases in membrane capacitance and hence in surface area were not correlated with a concomitant increase in membrane conductance. This means that the extra membrane incorporated during the increase of cytosolic free Ca2+ did not insert an appreciable amount of additional active transporters, such as channels or pumps, into the plasma membrane.
Figure 3.
CARC Does Not Cause a Measurable Increase in Membrane Conductance.
ΔGm and ΔCm values were measured isochronally after the increase of [Ca2+]cyt as a deviation of membrane conductance and membrane capacitance from the resting value at low values for [Ca2+]cyt ( protoplasts).
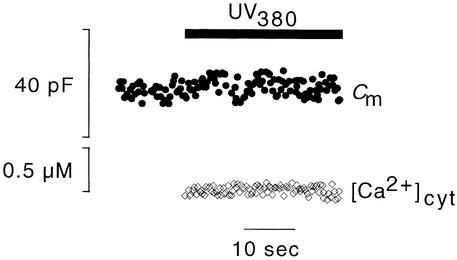
To test whether the [Ca2+]cyt–stimulated increase in membrane capacitance (CARC) depended specifically on the increase of [Ca2+]cyt, DMN was loaded with Mg2+. All Ca2+ in the pipette solution was therefore replaced by Mg2+. By the same procedure as was used for collecting the data shown in Figure 2, membrane capacitance was monitored after illuminating the protoplast with UV380 to liberate Mg2+ from the cage. In this case, F380 (i.e., the marker for [Ca2+]cyt) remained unaffected, as was expected. Also, membrane capacitance was not affected by illumination (Figure 4). This result, which was confirmed in three other experiments, shows that the increase in Cm values in illuminated samples is specifically related to the increase of [Ca2+]cyt; it cannot be mimicked by Mg2+. Furthermore, the finding demonstrates that neither UV380 light nor the byproduct of photolysis affects membrane capacitance.
Figure 4.
Mg2+ Does Not Trigger an Increase in Membrane Capacitance.
Membrane capacitance and [Ca2+]cyt in protoplasts dialyzed with Mg2+-loaded DMN were measured. Protoplasts were illuminated with UV380 to release Mg2+ from the cage. The bar indicates time of illumination.
Kinetics of CARC
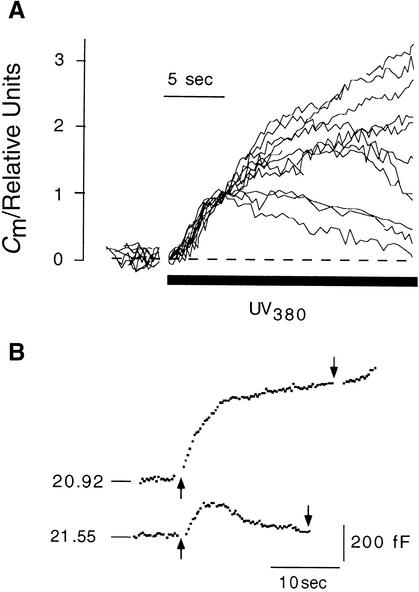
A [Ca2+]cyt–stimulated increase in Cm values was observed in 11 of 15 protoplasts in which [Ca2+]cyt was increased by 0.6 ± 0.25 μmol L−1 sec−1. Figure 5A illustrates the scope of normalized CARC in these 11 protoplasts during ramp increases in [Ca2+]cyt. The plot shows that at the start of photolysis, Cm values rose sigmoidally, showing a steep increase over approximately the first 5 to 7 sec. After this initial phase of rapid increase, changes in Cm values in different protoplasts varied greatly. Cm values continued to increase, albeit more slowly than initially. In other cases, Cm values returned to those at the resting level. This decrease in membrane capacitance means that the membrane added to the plasma membrane during enhanced exocytosis is in some cases reclaimed by endocytosis. The variability of the second phase in CARC under conditions of increased [Ca2+]cyt was not a characteristic of different types of protoplasts. Figure 5B shows that the difference in late responses could be observed even within one protoplast treated with repeated increases of [Ca2+]cyt.
Figure 5.
Protoplast-to-Protoplast Variability in Changes in Cm Values Stimulated by Ramp Elevation of [Ca2+]cyt.
(A) Membrane capacitance responses were determined from 11 protoplasts when [Ca2+]cyt was increased in a ramplike fashion from 4 nM at a mean rate of 0.6 ± 0.25 μmol L−1 sec−1.
(B) Two membrance capacitance responses stimulated by ramp elevation of [Ca2+]cyt in the same protoplast. The time gap between stimulations was 169 sec. The time of illumination with UV light is marked by arrows. Numbers on membrane capacitance traces denote resting values in picofarads. Scale bars denote time in seconds and Cm values in femtofarads.
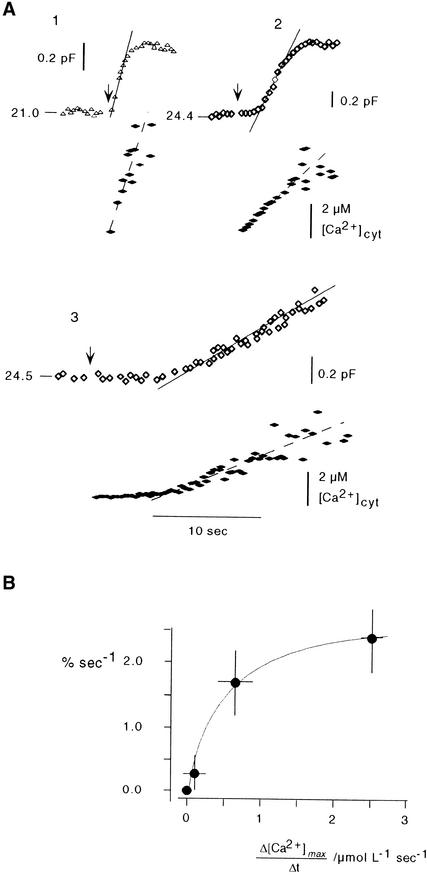
The speed of [Ca2+]cyt–stimulated ΔCm correlated with the speed of the increase in [Ca2+]cyt. Figure 6A shows three examples of CARCs with different velocities during an increase in [Ca2+]cyt. The rise in Cm values increased with increasing rates of [Ca2+]cyt elevation. Figure 6B illustrates the maximal rate for the increase in membrane capacitance during the linear phase of [Ca2+]cyt increase. As the plot shows, the stimulating effect of [Ca2+]cyt on Cm values saturates at a rate >3 μmol L−1 sec−1. Fitting a Michaelis-Menten–type kinetic to the data yielded a maximal membrane capacitance increase rate of 2.9% sec−1 over the resting capacitance (Cm,0). The half-maximal rate of CARC was achieved when [Ca2+]cyt increased at a rate of 0.49 μmol L−1 sec−1.
Figure 6.
The Velocity of CARC Is a Function of the Rate of Increase in [Ca2+]cyt.
(A) Three representative examples (1, 2, and 3) show CARCs (open symbols) when [Ca2+]cyt (solid symbols) is increased at different rates. Note that for low-intensity UV380 (trace 3), the increase in [Ca2+]cyt is delayed. This effect probably reflects rebinding of uncaged Ca2+ to unphotolyzed DMN. Numbers on membrane capacitance traces denote resting values in picofarads.
(B) Plot of the rate in the increase of membrane capacitance (asymptotes in [A]) versus the rate of [Ca2+]cyt increase during the linear phase. Data fitted (line) by using Michaelis-Menten kinetics yielded a maximal rate for CARC of 2.9% sec−1 over the resting capacitance with a half-maximal rate  μmol L−1 sec−1.
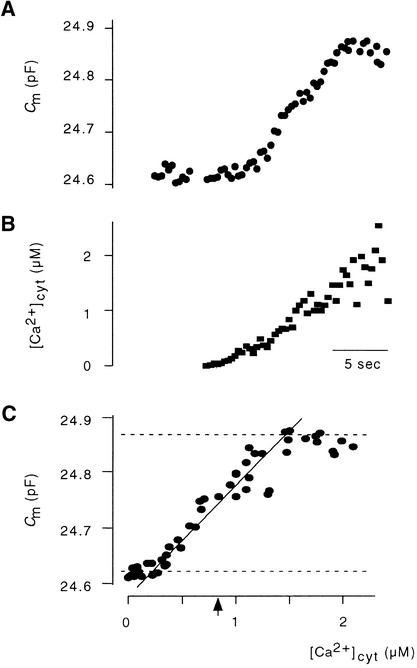
To quantify the relationship between changes in Cm values and [Ca2+]cyt, we plotted ΔCm versus the corresponding [Ca2+]cyt values. Figures 7A to 7C show the typical sigmoidal relationship between the two variables. In this example, we estimated a Ca2+ concentration for half-maximal stimulation at 0.92 μM (mean ±sd, 0.93 ± 0.17 μM;  protoplasts) and a slope of 0.27% μM−1 [Ca2+]cyt for the increase between 10 and 90% of Cm (mean ±sd, 1.13 ± 0.4% μM−1 [Ca2+]cyt,
  protoplasts).
Figure 7.
[Ca2+]cyt–Dependent Increase in Membrane Capacitance.
(A) and (B) Combined measurement of membrane capacitance and [Ca2+]cyt.
(C) Plot of Ca2+ versus Cm values. Dashed lines indicate asymptotes to Cm,0 (top) and the maximal amplitude of CARC (bottom). Asymptotes were drawn through the mean values of the first five and the highest five data points, respectively. The diagonal line illustrates the slope of the increase in Cm values. The slope between 10 and 90% of the increase in membrane capacitance (ΔCm) is 0.27% (μmol L−1)−1. The arrowhead denotes [Ca2+]cyt for the half-maximal stimulation (0.92 μM).
Amplitudes of CARCs
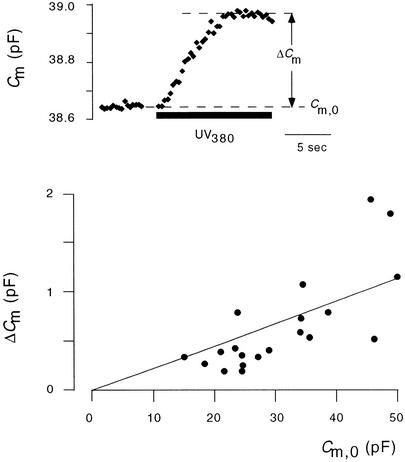
To estimate the maximal area gain in CARCs, we plotted the amplitudes of individual CARCs versus Cm,0 values of the respective protoplasts. For this purpose, only CARCs with a clear saturation were considered (e.g., Figure 8, top). In addition, only data from the first [Ca2+]cyt stimulation for one protoplast were taken into account. The plot shown in Figure 8 (bottom) reveals only a weak correlation between amplitude of CARCs and resting capacitance. A regression line through the origin and data in Figure 8 has a slope of 2.4% and a regression coefficient of 0.87.
Figure 8.
Amplitude of CARC as a Function of the Resting Capacitance before Stimulation.
In experiments in which ramp elevation of Ca2+ caused an increase in Cm values with a clear saturation (see inset, top), the amplitude, ΔCm, was measured and plotted versus the Cm,0 value that was measured before Ca2+ stimulation. Linear fit (line) of data through the origin has a slope of 2.4%.
Amplitude of CARC Increases with Time after a Preceding Increase in Cm Values
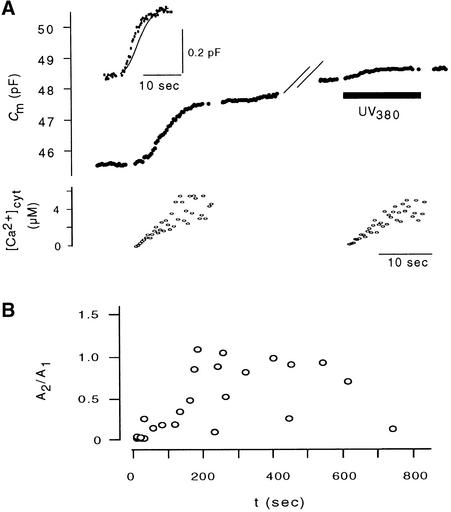
One feature of CARC was that Cm values leveled off or even decreased when [Ca2+]cyt was still increased (Figure 5). In keeping with results from studies with animal cells (Heinemann et al., 1993, 1994), this biphasic increase in Cm values suggests that a rapid form of exocytosis is limited by a depletable pool of vesicles. To test this possibility, we increased the [Ca2+]cyt value repeatedly within the same protoplast. Figure 9A shows the results of an experiment in which Cm values had increased in a typically sigmoidal manner when [Ca2+]cyt was increased. After 155 sec, [Ca2+]cyt was increased a second time. This second increase in [Ca2+]cyt also resulted in a small increase in Cm values. A comparison of the first and second CARC values obtained under this condition shows that the kinetics are similar, but the amplitude of the second one is much smaller (Figure 9A). In similar experiments, we found that the amplitude of the second response increased in relation to that of the first one and as a function of the interval between stimulations. Figure 9B shows a plot of the ratios of amplitudes of the second CARC over the first as a function of the time between Ca2+ stimulations. Assuming that the dependency of a second CARC on the intervening time between stimulations reflects a refilling of a depletable pool, then a minimum of ∼200 sec after depletion must pass before the pool reaches 50% of its initial content.
Figure 9.
Recovery of CARC after Stimulation.
(A) In one protoplast, Ca2+ was increased (left) in ramplike fashion, resulting in CARC. After 155 sec, this procedure was repeated (right). Both procedures caused CARC with large (first stimulation) and low (second stimulation) amplitude. In the inset, the CARCs from the first stimulation (line) and from the second stimulation (dots) are scaled to the same ordinate.
(B) Ratio of amplitudes from second (A2) and first (A1) CARC as a function of the time between stimulations. Amplitudes were measured at isochronal times after [Ca2+]cyt–stimulated ΔCm.
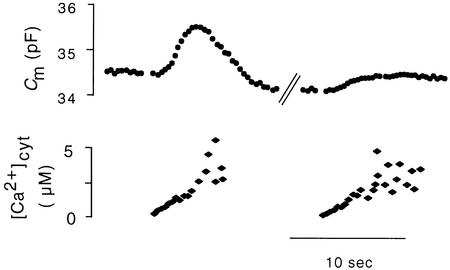
Frequently, the [Ca2+]cyt–stimulated increase in membrane capacitance was followed by a decrease in membrane capacitance, that is, a phase of net endocytosis (Figure 5). In this context, we tested the possibility that vesicles reclaimed during this phase of endocytosis could be immediately recycled for exocytosis. Figure 10 shows a representative experiment in which the initial increase in [Ca2+]cyt resulted in an increase in membrane capacitance, which was followed by a substantial phase of net endocytosis. Also, in this case, a second increase in [Ca2+]cyt (129 sec after the first one) caused only a diminished increase in membrane capacitance. This shows that the membrane reclaimed during endocytosis is not directly available for exocytosis.
Figure 10.
Recovery of CARC after a Preceding Endocytosis.
In one protoplast, [Ca2+]cyt was increased in ramplike fashion (first stimulation, on the left), resulting initially in an increase and subsequently in a decrease in membrane capacitance. After 129 sec, [Ca2+]cyt was increased a second time (second stimulation on the right). This second stimulation caused a CARC with an amplitude approximately one-third that of the first one.
A Model for [Ca2+]cyt–Stimulated Exocytosis
A model describing the properties of [Ca2+]cyt–stimulated increases in Cm values must account for the following experimental observations: (1) a sigmoidal increase in membrane capacitance during ramp elevation of [Ca2+]cyt; (2) transient insensitivity of membrane capacitance to [Ca2+]cyt; and (3) the possibility of a decrease in membrane capacitance after CARC.
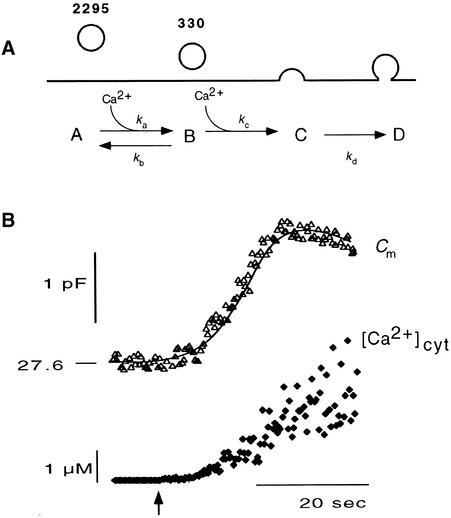
To describe these phenomena, we adopted a model used to explain similar [Ca2+]cyt–stimulated increases in membrane capacitance in chromaffin cells (Heinemann et al., 1993). In this model, two pools of vesicles, designated A and B, are connected in series, leading finally to exocytosis (pool C) (Figure 11A). Vesicles travel between pools A, B, and C with the forward rate constants ka and kc and a backward rate constant kb. The occasional decrease in Cm values after a preceding increase underlines the fact that endocytosis into another pool, D, with a rate constant kd, must also be considered. The best assumption is that the retrieved vesicles are not immediately fed back into pool B, because this pool could be completely depleted despite ongoing endocytosis. There was no indication that measurable endocytosis speeded the refilling of pool B (Figure 10). The often-observed increase in Cm values involving an initial fast phase followed by a slower second phase (e.g., Figure 5) further indicated that kc must be larger than ka.
Figure 11.
Kinetic Model for Secretion in Coleoptile Protoplasts and Fit of the Model to Experimental Data.
(A) Two-step model with two pools of vesicles (A and B) in series leading to exocytosis (pool C). Vesicles travel between pools A and B with the forward rate constants ka[Ca2+]cyt and kc[Ca2+]cyt and a backward rate constant kb. Vesicles are reclaimed by endocytosis into pool D with a rate constant kd. Numbers denote the number of vesicles in pools A and B that were obtained from fitting the data shown in (B).
(B) Data from the simultaneous recording of Cm values and [Ca2+]cyt in one coleoptile protoplast. At the times indicated by the arrow, Ca2+ was released from the DMN cage by UV380. The solid line shows the fit to data with rate constants and pool sizes as given in (A). The number on the membrane capacitance trace denotes the resting value in picofarads.
The values for the rate constants were calculated on the basis of the equations given by Heinemann et al. (1993) in jointly fitted algorithms (see Methods). During this procedure, several data sets, derived from different protoplasts, were fitted together with one common set of rate constants but with various pool sizes for each protoplast. The rationale for this approach was the assumption that the mechanisms underlying the secretory system are the same in cells from the same tissue, whereas the pool sizes may vary from cell to cell (Quaite et al., 1983). The pool sizes were estimated from the fitted amplitudes of increases in Cm values divided by the mean capacitance of secretory vesicles from this tissue (0.2 fF; Thiel et al., 1998) to obtain the number of vesicles residing in any one pool.
Various mathematical dependencies of the rate constants kx for [Ca2+]cyt were tested to obtain successful fits. The best results were achieved with the model shown in Figure 11A. According to this model, the forward steps ka and kc are accelerated by [Ca2+]cyt in a linear manner because ka= aa · [Ca2+]cyt and  , where aa and ac are constants. [Ca2+]cyt seems to have no appreciable influence on endocytosis, kd, or on the backward step, kb. Figure 11B illustrates an example of experimental data and corresponding fit for one of five jointly fitted data sets. The example fit adequately describes the initial increase in Cm values in response to [Ca2+]cyt. The rate constants for the best data fits are listed in Table 1.
Table 1.
Rate Constants for Model Presented in Figure 11A
| Reaction Steps | Rate Constants (sec−1)a | Deviationb |
|---|---|---|
| ka | 0.098[Ca2+]cyt | ±0.02 |
| kb | 0.002 | ±0.015 |
| kc | 2.31[Ca2+]cyt | ±1.24 |
| kd | 0.07 | ±0.017 |
Rate constants obtained by jointly fitting five Cm/[Ca2+]cyt data sets to the kinetic model given in Figure 11A.
Mean deviation (±sd) between parameters obtained from fitting each experiment individually to those obtained by joint fit.
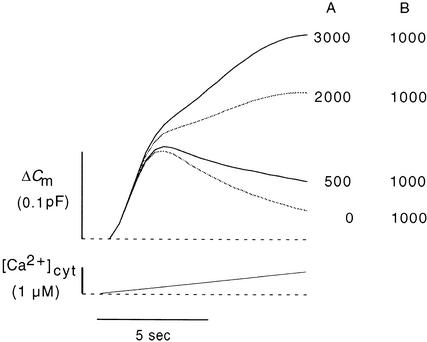
Using this model and the rate constants derived from joint fittings (Table 1), we simulated CARCs in response to an ideal [Ca2+]cyt ramp. The curves illustrated in Figure 12 show the calculated time course of [Ca2+]cyt–stimulated increases in Cm values (1) for a common set of rate constants and (2) under the condition that pool A harbors different amounts of vesicles at the onset of the [Ca2+]cyt increase. This variation in the size of pool A corresponds to the procedure of normalizing membrane capacitance data from different protoplasts to a common increase within the region of steep increase (Figure 5). The shapes of the simulated curves (Figure 12) and the experimental data (Figure 5) are very similar.
Figure 12.
Simulation of CARC during Ramp Increases of [Ca2+]cyt.
Membrane capacitance curves (top) were calculated for linear [Ca2+]cyt ramping (bottom) based on the model presented in Figure 11A and the rate constants from Table 1. Curves were calculated for different numbers of vesicles in pools A or B or both. The numbers of vesicles in the pools are given at right.
DISCUSSION
Our previous studies have shown that exocytosis in coleoptile cells is stimulated by micromolar concentrations of cytosolic Ca2+ (Thiel et al., 1994, 2000). Similar observations have been reported for other plant cells (Zorec and Tester, 1992; Carroll et al., 1998, Homann and Tester, 1998), suggesting that [Ca2+]cyt sensitivity may be a general feature of exocytosis in plant cells. The combined recording of [Ca2+]cyt levels and membrane capacitance shows that Cm values exhibit a net increase when [Ca2+]cyt concentrations are in the range of several hundred nanomoles per liter. Assuming that the resting level of [Ca2+]cyt in coleoptiles is ∼100 nM (Felle, 1988), it is evident that only moderate elevations of [Ca2+]cyt are required to stimulate exocytosis. Variations in [Ca2+]cyt of ∼100 nM or more are indeed known to occur in coleoptile cells in response to the phytohormone indole-3-acetic acid (Felle, 1988). Accordingly, the sensitivity of the secretory system to [Ca2+]cyt could be part of a stimulus–response coupling in these cells.
The rapid mobilization of Ca2+ from a caged precursor combined with recordings of membrane capacitance has enabled us to dissect the process of [Ca2+]cyt–stimulated secretion into distinct steps. From the sigmoidal change in Cm values after an increase in [Ca2+]cyt and the kinetic modeling of this phenomenon, we can conclude that [Ca2+]cyt stimulates at least two sequential steps in exocytosis: a stimulation of the final fusion step and enhanced refilling of a pool of vesicles ready for release from a pool of vesicles located upstream. Using these data, we are not able to detail the nature of the two discernible pools. However, the absence of a resolvable lag time for CARC elicited by the rapid increase of Ca2+ predicts that pool B must be located close to the plasma membrane when [Ca2+]cyt –stimulated exocytosis begins. Only this proximity would allow such a rapid response of membrane capacitance to [Ca2+]cyt. Based on the maximal amplitude of CARCs (Figure 8), one can assume that this pool contains on average ∼2.4% of the protoplast surface area in the form of vesicle membrane. Electron microscopy of grass coleoptiles has shown that these cells contain the equivalent of ∼15% of their surface area in the form of secretory vesicles in the cytoplasm (Quaite et al., 1983). Against this background, we presume that pool B contains a subpopulation of the total number of morphologically detectable vesicles. The nature (and location) of pool A is less clear. It could, for example, reflect the vesicles traveling from the Golgi apparatus to the plasma membrane; it could also be a kinetic state of mature vesicles in the vicinity of the membrane and reflect vesicles that are, before fusion, either tethered or docked to the plasma membrane (e.g., Oheim et al., 1999; Pfeffer, 1999).
Both the experimental data and the modeling reflect the existence of endocytotic activity in these protoplasts. This view is consistent with observations of vesicle recycling observed in high-resolution capacitance measurements in protoplasts of the same type (Thiel et al., 1998). Furthermore, it is in line with quantitative analysis of electron micrographs from coleoptile cells, which showed that as many as 60% of the vesicles delivered to the plasma membrane are recycled (Phillips et al., 1988).
An interesting feature of the modeling was that all CARCs recorded in different protoplasts could be fitted with the same rate constants. This emphasizes that the reaction steps underlying the secretory pathway are very similar between cells. The variable shapes of the CARCs in different experiments can be solely ascribed to differences in the number of vesicles occupying pool A or pool B in the protoplasts examined. One explanation for this variability could be that different cells produce vesicles at different rates. Such a difference in vesicle synthesis has been shown in studies with coleoptile cells. Statistical analysis of electron micrographs from oats revealed that growing coleoptile cells averaged ∼12% more vesicles per cubic micrometer of cytoplasm than did cells from nongrowing tissue (Quaite et al., 1983). Hence, the difference between individual cells could reflect the fact that the protoplasts originate from cells with different potentials for growth.
Overall, the general response of membrane capacitance to increases in [Ca2+]cyt in coleoptile protoplasts is similar to that observed in neurons and can be described with a similar model, including multiple [Ca2+]cyt–sensitive steps (e.g., Heinemann et al., 1993, 1994). This similarity favors the suggestion that the molecular machinery of exocytosis is similar within eukaryotes; also, it is in line with the finding that plant cells also have many, if not all, of the proteins known to catalyze membrane fusion in animal cells (reviewed in Battey et al., 1999; Blatt et al., 1999). A great difference in the [Ca2+]cyt sensitivity of exocytosis in coleoptile protoplasts versus that in animal cells is that in the latter cells, this process has a much steeper dependency on [Ca2+]cyt. For example, whereas [Ca2+]cyt stimulates exocytosis in neuroendocrine cells in a third-order exponential manner (Heinemann et al., 1993), the sensitivity in the coleoptile protoplasts is only linear (Figure 11). In physiologic terms, this means that variations in [Ca2+]cyt cause only a shallow increase in secretion in coleoptile cells, whereas the same variation has more dramatic effects on secretion in secretory animal cells.
It is generally believed that plant cells undergo constitutive exocytosis exclusively, which means that the rate of secretion is determined by the rate of cargo, that is, vesicle production (Jones and Robinson, 1989). This view is consistent with our observation that the global rate of secretion is determined by the number of vesicles produced (that is, the number of vesicles that feed into serial pools). The role of Ca2+ in this scenario could be a modulating one. In this context, the rate of vesicle supply presumably must be coordinated with the rate of exocytosis. Assuming that the number of fusion sites on the plasma membrane is limited, it would be essential to increase the speed of the membrane fusion process to avoid a logjam of vesicles arriving at increased rates. Such a situation would occur during auxin-stimulated growth of coleoptiles when the rates of both vesicle and secretory cargo production as well as the presence of [Ca2+]cyt all increase roughly within the same period of time (reviewed in Napier, 1995; Napier and Venis, 1995).
METHODS
Protoplasts were prepared as described previously (Thiel et al., 1994) and suspended in external solution containing 250 mM KCl, 10 mM CaCl2, 15 mM Mes-KOH, pH 6.1, and enough sorbitol to adjust the osmolarity to 600 mosmol kg−1. The standard buffer solution contained 150 mM K-glutamate, 20 mM KCI, 5 mM MgCl2, 2 mM Na2ATP, 150 mM sorbitol, and 20 mM Hepes KOH, pH 7.2. Also EGTA and Ca-saturated EGTA were added to adjust the free calcium concentration.
Capacitance Measurements
Conventional whole-cell recordings (Hamill et al., 1981) were performed with wax-coated pipettes of 2 to 3 MΩ resistivity. An EPC-9 patch–lamp amplifier (HEKA Electronics, Lambrecht, Germany) was used with PULSE software (HEKA). Cell capacitance was obtained with the software lock-in extension of the PULSE program based on the Lindau-Neher technique (Gillis, 1995; 1-kHz sinusoid stimulus with 20-mV peak-to-peak amplitude). Cells were held at −50 mV, a condition in which current–voltage relations were almost linear in the whole-cell configuration (Thiel and Weise, 1999). Measurements were considered for analysis only in cases in which the access conductance was >100 nS (i.e., > MΩ21).
Photolysis of Caged Ca2+ and Ca2+ Measurements
For increasing the concentrations of free Ca2+ in the cytoplasm ([Ca2+]cyt), protoplasts were perfused from the patch pipette with a solution containing 280 mM potassium glutamate, 20 mM KCl, 20 mM Hepes-KOH, pH 7.5, 10.9 mM 1-(2-nitro-4,5-dimethoxyphenyl)-1,2-diaminoethane-N,N,N′N′-tetraacetic acid dimethoxynitrophenamine sodium (DMN), 5 mM CaCl2, and 0.4 mM fura-2. Before photorelease, this medium buffered [Ca2+]cyt to ∼4 nM (Xu et al., 1997). Because the fluorescence excitation wavelength for [Ca2+]cyt measurements with fura-2 also covers the UV range that photolyses DMN, we used fluorescence excitation light at 380 nm to measure [Ca2+]cyt and photorelease Ca2+ concentrations from the caged precursor simultaneously. An aperture in the UV light path ensured that only the Ca2+ within the protoplast was liberated. Different rates of Ca2+ release were achieved by placing neutral density filters into the pathway of the excitation light.
During these single-wavelength measurements, in which the initial fluorescence, F0, is approximately equal to the maximal fluorescence, Fmax, the change in fluorescent signal over time, Ft, was used to estimate [Ca2+]cyt, according to Xu et al. (1997), as follows:
 |
(1) |
A kd value of 205 nM was obtained by in vivo calibration of fura-2, according to Neher (1989). The minimum fluorescence, Fmin, was measured after constant illumination with UV light at the end of the experiment. Fmax was obtained from the initial F380 value recorded at the onset of illumination. A line was fitted through the F380 data obtained after complete mobilization of Ca2+ and was used to estimate the contribution of photobleaching (Xu et al., 1997). The latter value was then considered in the calculation of [Ca2+]cyt.
In control experiments, we monitored the time over which the cytoplasm was perfused from the pipette under our conditions. For these experiments, we omitted DMN and CaCl2 from the pipette solution and measured the increase in fura-2 concentration in the cytoplasm after breaking into the whole-cell configuration. This was achieved by recording the fluorescence at the isosbestic wavelength (360 nm) after breaking into the whole-cell configuration. We found that on average, it took 115 ± 31 sec ( ) before the fluorescence reached 90% of the maximum.
DMN was purchased from Calbiochem (Bad Sod, Germany), and fura-2 was from Molecular Probes (Eugene, OR). All other chemicals were from Sigma-Aldrich.
Modeling
The first-order differential equations derived from the model (Figure 11A) and the equations for the rate constants are listed below:
 |
(2) |
 |
(3) |
 |
(4) |
 |
(5) |
where ao, aa, ab, ac, and ad are constants; E represents the membrane reservoir available downstream of the site of vesicle production; A and B are vesicle pools in the secretory pathway; and C is the amount of membrane inserted into the plasma membrane as a result of exocytosis. The various kx values are the rate constants for vesicle movement between the different pools.
Fits were obtained by the Simplex algorithm, which is a fitting algorithm that uses a geometric construct rather than differentials (Nedler and Mead, 1965; Cacci and Cacheris, 1984). This method allows very precise calculation and easy implementation of a joint fitting routine. Because refilling experiments (Figure 9) showed rate constant ko to be negligible compared with the other four rate constants, Equation 2 was simplified to the following form:
 |
(6) |
Fits were accepted when the calculated curves matched the measured data trace within the range of the noise level (∼35 fF).
Acknowledgments
We are grateful to Dietrich Gradmann (Göttingen, Albrecht v. Haller Institute, Biophysics) for many helpful suggestions. This work was supported by Deutsche Forschungs–gemeinschaft Grant No. SFB523.
References
- Battey, N.H., James, N.C., Greenland, A.J., and Brownlee, C. (1999). Exocytosis and endocytosis. Plant Cell 11, 643–659. [DOI] [PMC free article] [PubMed] [Google Scholar]
- Blatt, M.R., Layman, B., and Geelen, D. (1999). Molecular events of vesicle trafficking and control by SNARE proteins in plants. New Phytol. 144, 389–418. [DOI] [PubMed] [Google Scholar]
- Cacci, M.S., and Cacheris, W.P. (1984). Fitting curves to data—The simplex algorithm is the answer. BYTE 5, 340–362. [Google Scholar]
- Carroll, A.D., Moyen, C., Van Kesteren, P., Tooke, F., Battey, N., and Brownlee, C. (1998). Ca2+, annexins, and GTP modulate exocytosis from maize root cap protoplasts. Plant Cell 10, 1267–1276. [DOI] [PMC free article] [PubMed] [Google Scholar]
- Felle, H. (1988). Auxin causes oscillations of cytosolic free calcium and pH in Zea mays coleoptiles. Planta 174, 495–499. [DOI] [PubMed] [Google Scholar]
- Gillis, K.D. (1995). Techniques for membrane capacitance measurements. In Single Channel Recording, 2nd ed, B. Sakmann and E. Neher, eds (New York: Plenum Press), pp. 155–198.
- Hamill, O.P., Marty, A., Neher, E., Sakmann, B., and Sigworth, F.J. (1981). Improved patch-clamp technique for high resolution current recordings from cells and cell-free membrane patches. Pflügers Arch. Eur. J. Physiol. 391, 85–100 [DOI] [PubMed] [Google Scholar]
- Heinemann, C., von Rüden, L., Chow, R.H., and Neher, E. (1993). A two-step model of secretion control in neuroendocrine cells. Pflügers Arch. Eur. J. Physiol. 424, 105–112. [DOI] [PubMed] [Google Scholar]
- Heinemann, C., Chow, R.H., Neher, E., and Zucker, R.S. (1994). Kinetics of the secretory response in bovine chromaffin cells following flash photolysis of caged Ca2+. Biophys. J. 67, 2546–2557. [DOI] [PMC free article] [PubMed] [Google Scholar]
- Homann, U., and Tester, M. (1997). Ca2+-independent and Ca2+/GTP-binding protein–controlled exocytosis in a plant cell. Proc. Natl. Acad. Sci. USA 94, 6565–6570. [DOI] [PMC free article] [PubMed] [Google Scholar]
- Homann, U., and Tester, M. (1998). Patch-clamp measurements of capacitance to study exocytosis and endocytosis. Trends Plant Sci. 3, 110–114. [Google Scholar]
- Jones, R.L., and Robinson, D.G. (1989). Tansley Review No. 17: Protein secretion in plants. New Phytol. 111, 567–597. [DOI] [PubMed] [Google Scholar]
- Kasai, H. (1999). Comparative biology of Ca2+-dependent exocytosis: Implications of kinetic diversity for secretory function. Trends Neurosci. 22, 88–93. [DOI] [PubMed] [Google Scholar]
- Napier, R.M. (1995). Towards an understanding of ABP1. J. Exp. Bot. 46, 1787–1795. [Google Scholar]
- Napier, R.M., and Venis, M.A. (1995). Auxin action and auxin-binding proteins. New Phytol. 129, 167–201. [DOI] [PubMed] [Google Scholar]
- Nedler, J.A., and Mead, R. (1965). A simplex method for function minimization. Comput. J. 7, 308. [Google Scholar]
- Neher, E. (1989) Combined fura-2 and patch clamp measurements in rat peritoneal mast cells. In Neuromuscular Junction, L.C. Sellin, R. Libelius, and S. Thesleff, eds (Amsterdam: Elsevier Science), pp. 65–76.
- Neher, E., and Marty, A. (1982). Discrete changes of cell membrane capacitance observed under conditions of enhanced secretion in bovine adrenal chromaffin cells. Proc. Natl. Acad. Sci USA 79, 6712–6716. [DOI] [PMC free article] [PubMed] [Google Scholar]
- Oheim, M., Loerke, D., Stühmer, W., and Chow, R.H. (1999). Multiple stimulation-dependent processes regulate the size of the releasable pool of vesicles. Eur. Biophys. J. 28, 91–101. [DOI] [PubMed] [Google Scholar]
- Pfeffer, S.R. (1999). Transport-vesicle targeting: Tethers before SNAREs. Nat. Cell Biol. 1, 17–22. [DOI] [PubMed] [Google Scholar]
- Phillips, G.D., Preshaw, C., and Steer, M.W. (1988). Dictyosome vesicle production and plasma membrane turnover in auxin-stimulated outer epidermal cells of coleoptile segments from Avena sativa (L.). Protoplasma 145, 59–65. [Google Scholar]
- Quaite, E., Parker, R.E., and Steer, M.W. (1983). Plant cell extension: Structural implications for the origin of the plasma membrane. Plant Cell Environ. 6, 429–432. [Google Scholar]
- Thiel, G., and Weise, R. (1999). Auxin augments conductance of K+ inward rectifier in maize coleoptile protoplasts. Planta 208, 38–45. [Google Scholar]
- Thiel, G., Rupnik, M., and Zorec, R. (1994). Raising the cytosolic Ca2+ concentration increases the membrane capacitance of maize coleoptile protoplasts: Evidence for Ca2+-stimulated exocytosis. Planta 195, 305–308. [Google Scholar]
- Thiel, G., Kreft, M., and Zorec, R. (1998). Unitary exocytotic and endocytotic events in Zea mays coleoptile protoplasts. Plant J. 13, 101–104. [Google Scholar]
- Thiel, G., Sutter, J.-U., and Homann, U. (2000). Ca2+-sensitive and Ca2+-insensitive exocytosis in maize coleoptile protoplasts. Pflügers Arch. Eur. J. Physiol. 439 (suppl.), 152.–153. [PubMed] [Google Scholar]
- Xu, T., Naraghi, M., Kang, H., and Neher, E. (1997). Kinetic studies of Ca2+ binding and Ca2+ clearance in the cytosol of adrenal chromaffin cell. Biophys. J. 73, 532–545. [DOI] [PMC free article] [PubMed] [Google Scholar]
- Zorec, R., and Tester, M. (1992). Cytoplasmic Ca2+ stimulates exocytosis in a plant secretory cell. Biophys. J. 63, 864–867. [DOI] [PMC free article] [PubMed] [Google Scholar]


