

Abstract
Self-incompatibility (SI) is a genetically controlled process used to prevent self-pollination. In Papaver rhoeas, the induction of SI is triggered by a Ca2+-dependent signaling pathway that results in the rapid and S allele–specific inhibition of pollen tube tip growth. Tip growth of cells is dependent on a functioning actin cytoskeleton. We have investigated the effect of self-incompatibility (S) proteins on the actin cytoskeleton in poppy pollen tubes. Here, we report that the actin cytoskeleton of incompatible pollen tubes is rapidly and dramatically rearranged during the SI response, not only in our in vitro SI system but also in vivo. We demonstrate that nonspecific inhibition of growth does not result in similar actin rearrangements. Because the SI-induced alterations are not observed if growth stops, this clearly demonstrates that these alterations are triggered by the SI signaling cascade rather than merely resulting from the consequent inhibition of growth. We establish a detailed time course of events and discuss the mechanisms that might be involved. Our data strongly implicate a role for the actin cytoskeleton as a target for signaling pathways involved in the SI response of P. rhoeas.
INTRODUCTION
Pollination in flowering plants involves the physical contact of the stigma of a receptive flower and the pollen. Thus, pollination involves interactions between cells from two different plants. Subsequent to this first contact, the pollen grain generally germinates and forms a pollen tube that grows through the pistil to transport the sperm cells to the ovary for fertilization. In plants with a self-incompatibility (SI) system, self-pollen or genetically identical (incompatible) pollen is inhibited during this process.
In Papaver rhoeas (field poppy), the SI system has been established as being genetically controlled by a single, multiallelic S gene under gametophytic control (Lawrence et al., 1978). The SI recognition mechanism in this species involves the activity of S allele–specific SI proteins (S), which are secreted by the stigmatic papillae. Incompatible pollen is inhibited on the stigma surface during or shortly after germination. Using an in vitro system, we established that the stigmatic S proteins are responsible for triggering this incompatible SI response (Franklin-Tong et al., 1988). Several of the stigmatic S alleles of the P. rhoeas S gene have been cloned; the recombinant S proteins exhibit the expected S-specific inhibitory activity (Foote et al., 1994; Kurup et al., 1998), and studies on the molecular basis of allelic specificity are progressing (Kakeda et al., 1998; Jordan et al., 1999). The S proteins are proposed to interact with an S-specific pollen receptor, and an S protein binding protein (SBP) has been identified in pollen (Hearn et al., 1996). Although SBP binding of the stigmatic S protein is important for pollen inhibition (Jordan et al., 1999), it is not currently known whether this is the S receptor.
The interaction of S proteins with incompatible pollen triggers an intracellular signal transduction cascade in these pollen tubes. Cytosolic free calcium ([Ca2+]i) is well known to act as a second messenger and to play an important role in the regulation of pollen tube growth (reviewed in Malhó and Trewavas, 1996; Franklin-Tong, 1999a, 1999b; Rudd and Franklin-Tong, 1999) and in triggering the SI response in P. rhoeas. S proteins are proposed to act as signal molecules because they stimulate S-specific increases in [Ca2+]i within seconds of challenge, and pollen tube growth is inhibited within 1 to 2 min (Franklin-Tong et al., 1993, 1995, 1997). Recent evidence demonstrates that this interaction with S proteins involves the influx of Ca2+ at the shank of the pollen tube (V.E. Franklin-Tong, T. Holdaway-Clarke, K.R. Straatman, J.G. Kunkel, and P.K. Hepler, unpublished data). We propose that these increases in [Ca2+]i are the first steps in the signaling pathway.
These increases in [Ca2+]i are thought to trigger a Ca2+-dependent protein kinase, resulting in S-specific increases in phosphorylation of a pollen protein, p26.1 (Rudd et al., 1996), which is a soluble inorganic pyrophosphatase (J.J. Rudd, V.E. Franklin-Tong, and F.C.H. Franklin, unpublished data). There are several SI-specific signaling events that are not Ca2+-dependent, including the phosphorylation of p68 (Rudd et al., 1997), and recent data implicate the activation of a mitogen-activated protein kinase signaling pathway in incompatible pollen tubes (J.J. Rudd, F.C.H. Franklin, and V.E. Franklin-Tong, submitted manuscript). Recent data demonstrate that S-specific nuclear DNA fragmentation occurs several hours after the induction of SI (Jordan et al., 2000). This later event implicates that a programmed cell death signaling pathway is triggered, committing the already inhibited incompatible pollen to die.
The cytoskeleton is a major target of signaling events in plant cells. Both the microtubular and actin filament cytoskeletons in plants have been studied extensively and are known to rearrange when numerous, diverse external stimuli are applied (reviewed in Nick, 1999; Staiger, 2000). In pollen tubes, the actin cytoskeleton plays an essential role in growth (reviewed in Cai et al., 1997; Franklin-Tong, 1999b; Geitmann and Emons, 2000). Because the SI reaction in P. rhoeas has a dramatic effect on growth, we have investigated actin configuration during the SI response. Here, we definitively demonstrate alterations in the configuration of filamentous actin in incompatible pollen tubes.
RESULTS
Actin Cytoskeleton in P. rhoeas Pollen Tubes
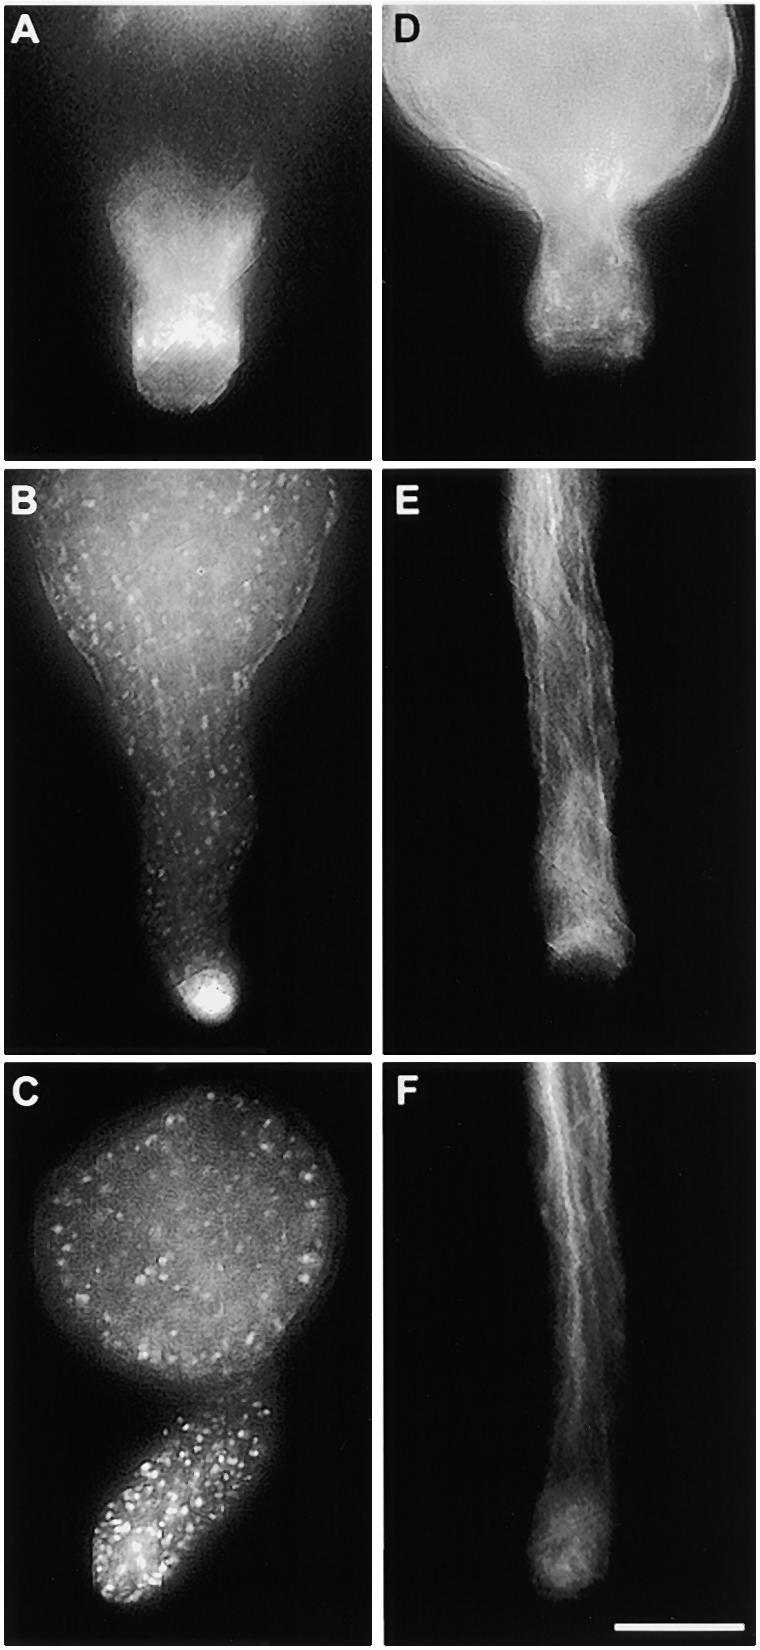
To characterize the actin cytoskeleton in pollen tubes of P. rhoeas, pollen was grown and fixed as described in Methods. The use of m-maleimidobenzoyl N-hydroxysuccinimide ester has been previously described and shown to result in good-quality actin configurations, similar to those obtained by rapid freeze fixation (Doris and Steer, 1996; Miller et al., 1999). Figure 1A illustrates an image of a typical poppy pollen tube visualized by fluorescence microscopy. Longitudinal actin filament bundles are present in the shank of the tube. In the subapical area, these bundles end in a denser configuration, which we call a subapical mesh. The extreme tip of the dome-shaped apex of the pollen tube is devoid of prominent phalloidin labeling.
Figure 1.

SI Challenge in Vitro Stimulates Changes in Actin Cytoskeleton in Pollen Tubes of P. rhoeas.
(A) Phalloidin labeling of F-actin in a normally growing P. rhoeas pollen tube demonstrates the presence of three zones: zone 1, the apex, which is virtually devoid of actin; zone 2, the collar zone between apex and subapex, which is characterized by a dense mesh of actin filaments; and zone 3, the subapical and basal parts of the cell, which contain distinct actin arrays oriented parallel to the longitudinal axis of the cell.
(B) to (F) P. rhoeas pollen tubes at different times after SI challenge.
(B) At 1 min after SI challenge, the actin mesh in the collar region has lost its original structure and apparently has been relocated to the apex. A distinct, apparently continuous layer of phalloidin labeling is visible adjacent to the plasma membrane.
(C) At 5 min after SI challenge, the actin bundle arrays in the shank appear diffuse. The first small, punctate foci of actin are visible, and actin has accumulated in the tube apex.
(D) At 10 min after SI challenge, actin bundle arrays are still distinguishable but much of the phalloidin labeling appears as small punctate foci.
(E) At 20 min after SI challenge, actin arrays are no longer visible. The accumulation of labeling at the apex has almost disappeared. Almost all phalloidin labeling is present in the form of large punctate foci.
(F) At 180 min after SI challenge, phalloidin labeling occurs in the form of prominent punctate foci of actin, which are distributed along the entire length of the pollen tube.
 .
.
S Protein–Induced Changes in the Actin Cytoskeleton of Growing Pollen Tubes
Pollen from plants of S genotypes S1S3 and S2S4 were grown in vitro and challenged with recombinant proteins S1e and S3e (see Foote et al., 1994); samples were fixed at different times after challenge (see Methods). The time course illustrated in Figures 1B to 1F shows that the configuration of actin filaments in the pollen subjected to an incompatible SI challenge undergoes dramatic changes. Within 1 min after challenge with incompatible S proteins, the actin configuration in the apex and subapex changed (Figure 1B). The well-structured subapical mesh lost its organization and apparently was displaced toward the tip that previously had not been labeled with phalloidin. At this point, the actin bundles appeared to begin to disintegrate; subsequently, the actin filament bundles in the shank of the tube underwent configurational changes, as shown in Figures 1C to 1F. As early as 1 min after the induction of SI, the phalloidin labeling became localized to the periphery of the pollen tube, as shown in Figure 1B. This marginalization of F-actin, located adjacent to the plasma membrane, is clearly illustrated by the median sections in Figures 2A and 2B; the line scans in Figure 2C demonstrate the distribution of phalloidin staining in the pollen tube. This marginalization is not caused by the displacement of the central vacuole (data not shown). Some incompatible pollen tubes displayed these changes within 30 sec of challenge. However, generally 1 to 2 min passed before the majority of pollen tubes showed signs of being affected. Effects earlier than 30 sec were not assessed, because the actin fixing agent (m-maleimidobenzoyl N-hydroxysuccinimide ester) was shown to require 15 sec to arrest cytoplasmic streaming completely, thus producing reliable results only in samples taken after that time.
Figure 2.

Marginalization of F-Actin after SI Challenge.
Median sections of pollen tubes treated with incompatible S proteins illustrate strong phalloidin labeling of peripheral F-actin.
(A) At 5 min after SI challenge, this median section of a pollen tube demonstrates that the phalloidin labels an apparently continuous layer, which is adjacent to the plasma membrane.
(B) At 180 min after SI challenge, this median section of the pollen tube shown in Figure 1F illustrates that the prominent punctate foci of actin, resulting from phalloidin labeling, are clearly located in the peripheral region of the cell.
(C) The line scan demonstrates that the amount of phalloidin labeling of F-actin in the cortical region is approximately fivefold that in the lumen of the pollen tube. The two line scans (indicated by triangles and circles) measuring fluorescence intensity were made either side of the white line indicated on the pollen tube illustrated in (A).
 .
.
Figures 1C and 1D show that by 5 to 10 min after SI challenge, the phalloidin labeling appeared to be speckled. These speckles were visualized as small punctate fragments of actin, with preferential localization at the cell periphery (see also Figures 2A and 2C). By 5 to 15 min after challenge, apical phalloidin labeling had accumulated in the center of the dome-shaped apex of the pollen tube tip, as shown in Figures 1C to 1E. This phenomenon was transient: by 15 to 20 min after SI induction, this apical accumulation of actin generally was not visible. By ∼20 min, the fine-speckled appearance of actin labeling was no longer detectable, and larger, punctate foci of actin were visible throughout the pollen tube, apparently replacing the smaller actin fragments. Figure 1F demonstrates that this conformation persisted for at least 3 hr after challenge. These alterations were highly reproducible, and they were observed during the course of 12 independent experiments. These experiments, which were conducted in both laboratories, used different batches of S proteins and pollen as well as different phalloidin conjugates.
Two kinds of control experiments were conducted. In the first set, pollen from plants of S genotype S1S3 was subjected to a change in growth medium that did not include S proteins (see Methods). No inhibition of growth and no alterations in the actin cytoskeleton were observed as a consequence of these changes in medium. This is illustrated by Figure 3A, which shows that 20 min after this change in medium, the actin configuration appears to be normal. This image is a typical example of the results seen at all times that were sampled. In a second set of controls, fully compatible pollen was challenged (see Methods). Again, as expected, none of these pollen tubes was inhibited, and no changes in actin configuration were detectable at any time point examined after the assays. This lack of changes in F-actin is illustrated in Figure 3B by a representative example of a compatible pollen tube challenged with S proteins 20 min after challenge.
Figure 3.

Control Experiments Show No Changes in F-Actin of Pollen Tubes.
Controls were examined to demonstrate that the rearrangements of actin were not caused by a change in growth medium (GM; see Methods) and that the pollen reacted to S proteins in an S allele–specific manner.
(A) A P. rhoeas pollen tube 20 min after a change in GM. At no time interval after the change in GM was the F-actin configuration affected. Samples taken at all other time points looked identical.
(B) A P. rhoeas pollen tube 20 min after challenge with compatible S proteins. This sample, which appears identical to an unchallenged pollen tube, is representative of those seen at all times after treatment with compatible S proteins, because the actin cytoskeleton appeared to be identical at all the times sampled.
 .
.
A quantitative assessment of the actin rearrangements is provided in Figure 4. Pollen tubes were stabilized, fixed, and treated as described in Methods. The organization of the types of actin cytoskeleton of the pollen tubes at various times after SI induction were scored and grouped into three classes of actin configuration (I, “normal”; II, adjacent to the plasma membrane; and III, membrane-localized punctate foci), as shown in Figure 4. These data were taken from three independent experiments, and ∼80 pollen tubes were scored for each time sampled.
Figure 4.

Quantification of Changes in F-Actin Configuration after SI Challenge.
The observed actin cytoskeleton phenotypes are of three classes: I, II, and III (see text for descriptions). A small proportion of pollen tubes (not indicated on the histogram) had a high background of labeling or could not be clearly associated with one of the classes of configurations. Error bars represent standard deviations.
(A) After incompatible S protein challenge, the number of pollen tubes with normal (class I) actin configuration disappeared almost immediately. Concomitantly, there was a transient appearance of pollen tubes with a class II configuration and an eventual transformation of the actin configuration into the punctate foci of actin (class III).
(B) The actin configuration observed in compatible pollen tubes challenged with the same S protein samples as those in (A) did not reveal changes in F-actin configuration. This demonstrates the absolute S specificity of the actin rearrangements stimulated by S proteins.
Figure 4A shows that in the incompatible challenge at the zero time point, the actin cytoskeleton configuration detected by phalloidin staining was normal (i.e., similar to that shown in Figure 1A). After interaction with incompatible S proteins, the number of pollen tubes with a normal actin configuration decreased almost immediately, concomitant with a consequent, rapid increase in pollen tubes with a class II configuration. Only a small proportion of pollen tubes retained their class I configuration. Over the subsequent ∼1 hr after SI induction, the number of pollen tubes exhibiting the class II configuration decreased and a proportional rise in class III pollen tubes was detected. These data clearly establish (1) the timing of events (i.e., that the cortical array characterized by continuous phalloidin staining adjacent to the plasma membrane occurs before the formation of actin foci at the cell cortex) and (2) the rapidity of the response. Figure 4B shows the same data for the fully compatible pollen tubes that were treated with the same S proteins in an experiment conducted simultaneously. The lack of a response clearly demonstrates the absolute S specificity of the response, because the only difference between the two sets of samples was the S genotype of the pollen that was challenged.
S Protein–Induced Changes in the Actin Cytoskeleton of Germinating Pollen
The in vitro conditions described above differ from those of the in vivo conditions. In vivo, the pollen is exposed to S proteins from the moment it lands on the stigma, before it germinates. Although we have strong evidence that the SI response affects both pollen germination and pollen tube growth (Franklin-Tong et al., 1988; Franklin et al., 1992), we decided to examine the F-actin configurations in pollen grains, because the actin cytoskeleton configurations in germinating grains and tubes are different.
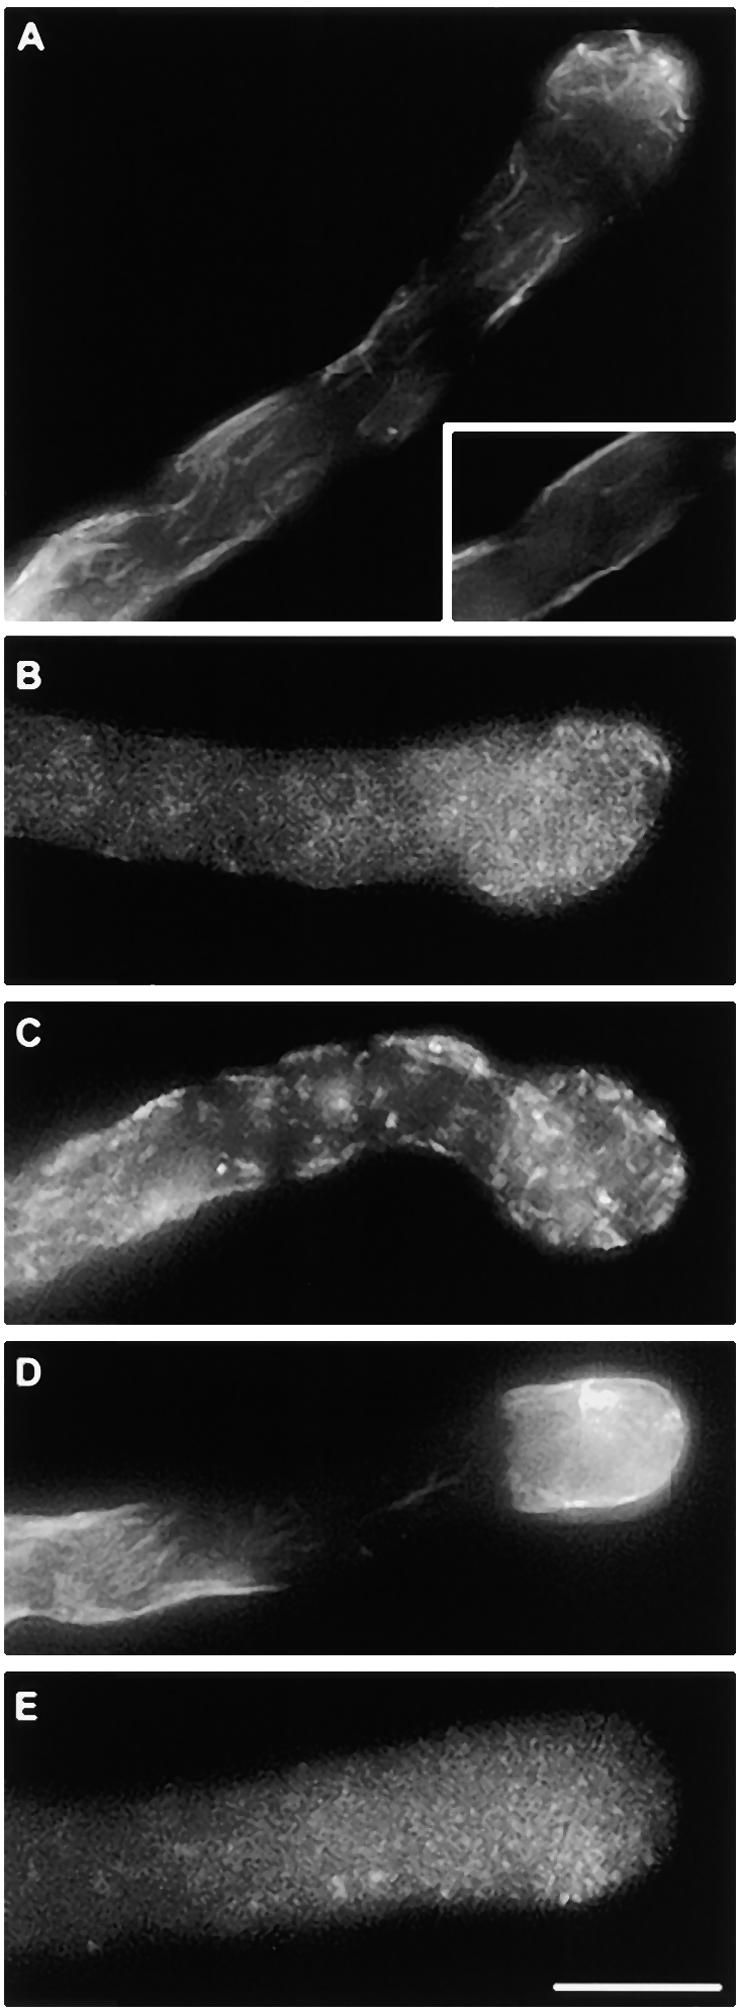
To mimic the in vivo conditions in vitro, we incorporated S proteins into medium solidified with agarose on which pollen was sown (see Methods for details). Pollen grains so treated were fixed and stained as previously described for the in vitro experiments (see Methods). Germination began ∼25 to 30 min after sowing. As shown in Figures 5A and 5D, the actin configurations in both incompatible and compatible pollen, respectively, at this stage appeared to be similar, with no accumulations of actin in the apical region of the emerging pollen tube tip. By 60 min after sowing, the compatible pollen tubes were 300 to 500 μm long, whereas incompatible pollen tubes were clearly inhibited by this stage, reaching a length of only ∼20 to 130 μm. Comparisons between the lengths of incompatible pollen tubes in this semi–in vivo setup with those observed in vivo showed they were similar. Figure 5B shows that incompatible pollen tubes at 60 min exhibited a finely punctate distribution of actin, although some actin bundles were still apparent. An accumulation of labeling was detected at the center of the apical dome. By 120 min, actin localization in the incompatible pollen grains and tubes showed coarse punctate foci, as shown in Figure 5C. At this stage, no accumulation of actin was ordinarily detected in the apical region of the pollen tube tip. As expected, compatible pollen tubes continued to grow and still showed normal actin configurations at 60 and 120 min, as illustrated in Figures 5E and 5F. These experiments demonstrate that the same actin configurations are detectable in incompatible pollen during germination and pollen tube tip growth.
Figure 5.
S Protein–Induced Changes in Germinating Pollen Grains.
Incompatible and compatible pollen was germinated in the presence of S proteins in experiments mimicking in vivo conditions.
(A) Incompatible pollen grain 30 min after being applied to solidified GM. The pollen tube has started to emerge from the pollen grain and shows a largely unaffected actin cytoskeleton.
(B) Incompatible pollen 60 min after being applied to solidified GM. Growth of the pollen tube is arrested, and the pollen tube tip shows heavy phalloidin staining. The pollen grain and tube show small punctate actin with some evidence of remaining actin bundles.
(C) Incompatible pollen 120 min after being applied to solidified GM. The pollen grain and tube are labeled with large and prominent punctate foci of actin.
(D) Compatible pollen grain 30 min after being applied to solidified GM. The actin configuration in the tube appears to be normal. The apparent difference in label intensity between (A) and (D) is most likely due to different penetration of phalloidin into the pollen.
(E) Compatible pollen tube 60 min after being applied to solidified GM. A typical, unchallenged pollen tube is shown.
(F) Compatible pollen tube 120 min after being applied to solidified GM. Again, the unchallenged control pollen tube exhibits characteristics of a normal pollen tube with a normal actin cytoskeleton.
 .
.
Actin Cytoskeleton during Compatible and Incompatible Pollinations in Vivo
To demonstrate that our in vitro observations were relevant under the in vivo conditions on the stigma, we assessed the actin cytoskeleton of in vivo–grown pollen tubes (see Methods). Typical examples of actin-labeled in vivo–grown pollen tubes, which had undergone incompatible and compatible SI reactions, are shown in Figure 6. Compatible pollen tubes, as illustrated by Figure 6B, showed longitudinal actin bundles in the shank of the pollen tube, a dense mesh in the collar region, and a lack of filamentous actin at the tip. As expected and as shown in Figure 6A, incompatible pollen tubes in vivo exhibited a punctate distribution of actin 2 hr after pollination. This result demonstrates that the alterations in actin filament configuration observed in vitro are truly due to the SI response.
Figure 6.

Alterations to Pollen Actin Cytoskeleton during the in Vivo SI Response.
We assessed the actin cytoskeleton of pollen that had undergone compatible and incompatible SI reactions in vivo.
(A) Typical pollen tube sampled 2 hr after an incompatible pollination. The pollen tubes clearly show the punctate appearance of the actin cytoskeleton along the entire length of each pollen tube.
(B) Typical pollen tube sampled 30 min after a compatible pollination. The configuration of actin arrays resembles very strongly that seen in normally growing pollen tubes in vitro.
 .
.
Actin in Pollen Tubes after Inhibition of Growth
To establish whether the dramatic alterations in actin configuration after S protein challenge represented a primary effect stimulated by incompatible S proteins or were merely a secondary effect of the consequent arrest of growth, pollen tubes were subjected to various treatments that arrested growth. Growth was inhibited by adding Gd3+, caffeine, or EGTA, any of which in appropriate concentrations effectively arrests pollen tube growth by interfering with the ion homeostasis of the cell (Pierson et al., 1994, 1996; Geitmann and Cresti, 1998). Before testing the effects of these drugs on the actin cytoskeleton, we ascertained for each drug the effective concentration (EC100) required to inhibit poppy pollen tube growth completely, as given in Table 1. Pollen tubes were treated with these inhibitors and then viewed by fluorescence microscopy, as described in Methods.
Table 1.
Determination of Effective Concentrations (EC100) on Pollen Tube Growth for the Drugs Used in This Study
| Drug | Concentrationa |
|---|---|
| Caffeine | 10 mM |
| EGTA | 200 μM |
| GdCl3 | 100 μM |
| Cytochalasin D | 1 μM |
| Latrunculin A | 50 nM |
The minimum concentrations that completely inhibit poppy pollen tube growth (i.e., EC100) in the growth medium used.
Although Gd3+ affected the apical configuration of actin in pollen tubes, the actin arrays in the pollen tube shank seemed basically unchanged after Gd3+ had been added. Figure 7A illustrates that 20 min after challenge, distinct actin bundles in a longitudinal orientation were visible in Gd3+-treated pollen tubes. Treatment with caffeine also did not affect the basic configuration of actin in the shank. The actin meshwork typical of the subapical region was present, albeit located further from the tip, as shown in Figure 7B. Figure 7C shows that in the samples treated with EGTA, by 20 min after addition of the agent, the subapical mesh of actin appeared only slightly affected, and the actin arrays in the pollen tube shank appeared intact. Thus, all three of these drugs, despite inhibiting P. rhoeas pollen tube growth, did not induce the gross configurational alterations in actin observed in response to SI. This suggests that the SI-induced events are not merely a secondary effect of growth inhibition.
Figure 7.

Effect of Arrest of Pollen Tube Growth on Actin Configuration.
Pollen tube growth was arrested by interfering with ion homeostasis by adding Gd3+, caffeine, or EGTA. In all cases, although the apical configuration of actin was affected, the actin arrays in the shank were not markedly altered by treatment with these drugs.
(A) Actin configuration 20 min after 100 μM Gd3+ was applied.
(B) Actin configuration 10 min after 10 mM caffeine was applied. The characteristic mesh configuration of the collar region in unaffected pollen tubes had moved toward the subapex. The tip of the pollen tube (indicated with an arrowhead) seems to be completely devoid of label.
(C) Actin configuration 10 min after 200 μM EGTA was applied.
 .
.
Effect of Actin Depolymerizing Agents on the Actin Cytoskeleton of Pollen Tubes
From our observations, actin depolymerization appeared likely to be involved in the SI response. To test this possibility, we applied the actin depolymerizing agents cytochalasin D and latrunculin A to P. rhoeas pollen tubes to assess their effects on actin configuration. The former caps the barbed ends of the polymers (Cooper, 1987), whereas the latter binds to globular monomeric (G-) actin, thereby reducing the pool of available actin subunits for polymerization (Spector et al., 1989).
The EC100 values for cytochalasin D and latrunculin A on P. rhoeas pollen tube growth were determined as described in Methods; the values are given in Table 1. The drugs were added to growing pollen tubes; at various time intervals, samples were fixed for fluorescence microscopy, as described in Methods. Figure 8A shows that cytochalasin D disrupted the highly organized cytoskeletal configuration. A diffuse network of disorganized actin was detected 5 min after treatment with 1 μM cytochalasin D, as shown in Figure 8A. Cytochalasin D also caused an apparent transition of cytoplasmic actin arrays to an almost exclusively peripheral position, as illustrated in the insert in Figure 8A. Cytochalasin D completely disrupted the subapical actin organization, and the actin arrays were drastically shortened, appearing as a diffuse network (Figure 8B). In most cases, the tip of the pollen tubes appeared swollen. In no instance was punctate actin observed. Higher concentrations of cytochalasin D (5 μM), apart from eliciting a faster response, caused a transient fragmentation of arrays into short spikes at 5 min, as illustrated in Figure 8C, followed by the appearance of a fine, diffuse actin network, similar to the network shown in Figure 8A.
Figure 8.
Effect of Actin-Depolymerizing Agents on the Pollen Tube Actin Cytoskeleton.
To assess the effect of actin-depolymerizing drugs on P. rhoeas pollen tubes, cytochalasin D and latrunculin A were added to growing pollen tubes, and samples were taken after different intervals.
(A) Effects 5 min after 1 μM cytochalasin D was applied. The actin arrays have disintegrated. The tip is slightly swollen. The insert shows a median section of the same pollen tube in which phalloidin label is located peripherally.
(B) Effects 5 min after 5 μM cytochalasin D was applied. Actin filaments appear to have broken down into short fragments.
(C) Effects 10 min after 1 μM cytochalasin D was applied. Actin has disintegrated; a diffuse, weakly labeled network remains.
(D) Effects 5 min after 50 nM latrunculin A was applied. The actin cytoskeleton has lost its characteristic structure. There is strong staining of cortical actin, and actin in the subapical region has disintegrated almost completely.
(E) Effects 30 min after application of 50 nM latrunculin A. Phalloidin labeling occurs as small, weakly labeled structures, giving a speckled appearance throughout the pollen tube.
 .
.
The effect of latrunculin A was similar to that of cytochalasin D. The characteristic actin configuration of the P. rhoeas pollen tube was lost, and a network of diffuse actin arrays was detected after a few minutes (Figure 8D). Phalloidin labeling was generally confined to the cortical region. In most cases, the pollen tube apex was slightly swollen. In a few instances, labeling resulted in a fine, speckled appearance along the pollen tube (Figure 8E). The size of these fine actin arrays, however, was not similar to the punctate foci of actin observed after SI induction.
Pollen Tube Growth and Cytoplasmic Streaming after S Protein Challenge
In normally growing pollen tubes, actin arrays provide the tracks along which primary organelle movement occurs. Our studies clearly show that after an incompatible SI response, these tracks no longer exist. Therefore, we investigated the effects of the S protein on cytoplasmic streaming by monitoring organelle movement and growth rate of pollen tubes simultaneously. The addition of recombinant S proteins rapidly caused tubes to exhibit much slower growth rates, some reacting as early as 15 sec (the earliest time observed), which resulted in growth arrest between 30 sec and 3 min. This variability in the timing of the response was within the limits expected; indeed, this level of variability is also seen in vivo. In general, cytoplasmic streaming continued for 5 to 10 min after challenge (see Methods). S proteins diluted by half had an extended response time, such that cytoplasmic streaming was inhibited at ∼10 to 25 min. In control experiments using compatible pollen, neither pollen tube growth nor cytoplasmic streaming was affected.
DISCUSSION
Actin Configuration in P. rhoeas Pollen Tubes
The actin configuration has been reported in pollen tubes of numerous plant species (reviewed in Derksen et al., 1995; Cai et al., 1997; Geitmann and Emons, 2000) and more recently in living pollen tubes by microinjecting phalloidin (Miller et al., 1996) or transiently expressing a green fluorescent protein–mouse talin fusion protein (Kost et al., 1998). The actin configuration we have observed in our fixed P. rhoeas pollen tubes is very similar to that previously observed when analyzing living pollen tubes. The actin configurations in living angiosperm pollen tubes consist of thick actin bundles arranged either parallel to the longitudinal axis or in net axial orientation in the shank of the pollen tube. The subapical region is characterized by distinctive and finer actin arrays that form a prominent configuration in the collar region of the cell, which is the transition zone between apex and subapex. The apex is essentially devoid of actin bundles. Our similar observations confirm the quality of our fixation procedure for P. rhoeas pollen tubes.
Actin Configuration during the SI Reaction
Our investigation of the P. rhoeas pollen tube cytoskeleton after the induction of an incompatible SI response shows that dramatic changes occur in the pollen tube very rapidly after challenge with incompatible S proteins. The control experiments make clear that the changes in the actin configuration are S-allele specific, because compatibly challenged pollen tubes exhibit the same F-actin configuration as that of normally growing pollen tubes. Because the punctate configuration of actin in incompatible pollen tubes also occurs in pollen tubes grown in vivo after incompatible pollination, this lends support to the idea that our in vitro system represents a good model for investigation of these SI-induced processes.
The dramatic alterations in actin configuration in incompatible SI-induced pollen tubes appear to occur in four relatively distinct phases. First, there is an apparent reconfiguration of the subapical actin mesh and the longitudinal actin filaments and bundles, with apparent movement of actin filaments into the apical region, which is ordinarily free of F-actin bundles. This is a well-recognized feature of tip growing cells that have stopped elongating (see, e.g., Lancelle et al., 1997; de Ruijter et al., 1999; Miller et al., 1999). Second, a proportion of the actin filaments appears to become marginalized, that is, it accumulates in the region adjacent to the plasma membrane. Similar actin localization has also been observed in animal cells undergoing programmed cell death (Palladini et al., 1996) and in cells in which Rac-mediated actin reorganization is stimulated by LIM kinase (Yang et al., 1998). Third, longitudinal actin bundles apparently fragment, giving a speckled appearance to the pollen tube actin. Fourth, there is apparent accumulation of actin in the form of punctate foci distributed throughout the pollen tube. These then appear to form aggregates that increase in size over time, giving rise to what we have called “punctate foci” of actin. We have used punctate to describe the dotlike appearance of the actin structures. We call them foci because the small actin structures appear to aggregate into foci that increase over quite a long period of ∼1 hr. We do not imply nucleation by the use of the word foci but consider the term foci to best describe these aggregates.
Similar structures have been observed in normally growing yeast and fungal and oomycete hyphae. “Actin patches” are a typical feature of yeast (Mulholland et al., 1994; Waddle et al., 1996; Karpova et al., 1998) and hyphae (Harold and Harold, 1992; Czymmek et al., 1996) and have been relatively well characterized in these species. However, at this stage, because we do not know whether our punctate foci of F-actin are either structurally or functionally the same as the actin patches, we have deliberately avoided use of the same terminology. Actin aggregates have not been observed previously in pollen tubes, except for what appear to be large focal adhesions in tubes growing in the style (Pierson et al., 1986; Lord, 1992). Visually, the adhesions appear to be quite different from the actin aggregates we observed. To our knowledge, only a few other reports of punctate actin structures in higher plants exist. One of these is from studies of bean root hairs undergoing nodulation factor signaling (Cardenas et al., 1998), but these punctate actin structures have not been reported in other studies of Nod factor stimulation (Miller et al., 1999). Punctate actin structures similar to those in SI-challenged pollen tubes were observed in root hairs treated with mycalolide B, an actin-severing agent (Shimmen et al., 1995). Because this putative severing agent caused changes in conformation similar to that in SI, this might implicate a role for an actin-severing activity in the SI response.
Although the effects of gametophytic SI reactions on pollen tube morphology have been studied extensively, most of these investigations have focused primarily on alterations in the structure of the endomembrane system and the cell wall (Pacini, 1982; Heslop-Harrison, 1983; Singh and Kao, 1992; Geitmann et al., 1995). In this study, we report novel changes in the cytoskeletal structure in incompatible pollen tubes. In the sporophytic SI system of Brassica napus, stigmatic papilla cells, which are the proposed site of the SI-stimulated signaling cascade in this species, have been examined for alterations in the actin cytoskeleton. However, none was observed (Dearnaley et al., 1999).
SI-Induced Actin Configurations Are Not a Result of Growth Inhibition
Not only are the SI-induced changes in actin configuration induced in an S-specific manner, but they also appear to be specific to the SI signaling pathway. The evidence supporting these ideas comes from drugs that arrest pollen tube growth but otherwise have no known direct effect on the actin cytoskeleton (caffeine, Gd3+, or EGTA). In pollen tubes treated with these drugs, the apical and sometimes subapical actin configurations were affected, but the actin arrays in the shank remained stable, and no marginalization or formation of punctate foci of actin was detected. This demonstrates that the non-S allele–specific arrest of growth does not necessarily result in actin configurations similar to those stimulated by an SI response. Therefore, we conclude that the latter are not merely secondary effects resulting as a consequence of arrest of growth. We believe that alterations in the actin organization are triggered specifically by the SI-induced signaling cascade or cascades.
Actin as a Target of a Signaling Cascade Triggered by SI
The actin cytoskeleton is known to be the target of signal transduction pathways in response to many well-defined external stimuli in plant cells (reviewed in Nick, 1999; Staiger, 2000). We have already mentioned the example of Nod factors that stimulate actin reorganization in root hairs of bean (Cardenas et al., 1998; de Ruijter et al., 1999). In this as well as other plant cell systems, a crucial role for actin in the response mechanisms elicited by external cues has been clearly demonstrated.
We have previously shown that S proteins from P. rhoeas act as signal molecules (Franklin-Tong et al., 1995); they stimulate S-specific increases in [Ca2+]i and Ca2+ influxes, triggering a signaling cascade in pollen that results in the rapid S-specific inhibition of pollen tube growth (Franklin-Tong et al., 1993, 1995, 1997). We have evidence that other S-specific signaling events also occur. The alterations in the actin configuration reported here are extremely rapid and provide convincing evidence that the cytoskeleton is targeted by the signaling pathway or pathways elicited in pollen tubes undergoing an SI response. Furthermore, because the onset of these events is so rapid, the inhibition of pollen tube growth may be (at least partly) a result of these cytoskeletal alterations.
How the changes in the actin cytoskeleton described here relate to the other SI-induced signaling events already identified is an important question. As we now know, several events are elicited in incompatible pollen by the SI response. The S-specific increases in [Ca2+]i in the “shank” region are detectable within a few seconds of the SI interaction, and the loss of the apical [Ca2+]i gradient at the pollen tube tip is evident within ∼1 min (Franklin-Tong et al., 1997). Ca2+-dependent phosphorylation of p26 was detected within 90 sec (Rudd et al., 1996), but earlier times were not examined. However, we can say that the increase in calcium-dependent protein kinase (CDPK) activity responsible for p26 phosphorylation must occur earlier than 90 sec. We have established that all of these events involve Ca2+ directly. The first changes to the F-actin cytoskeleton were detected as early as 30 sec, which because of methodological reasons, is the earliest time assessed. Whether these changes directly or indirectly involve Ca2+ is an important question to answer and will require monitoring both actin and [Ca2+]i simultaneously in living pollen tubes. Arrest of tip growth is also inhibited within this period. However, the question of what exactly is responsible for the arrest of tip growth—whether the changes in actin are causal or correlative—is not clear at this stage. That will be the subject of future studies, because this is one of the ultimate questions relating to tip growth.
Our studies described here clearly demonstrate that further alterations to the actin cytoskeleton also continue after inhibition of tip growth. Between 10 and 60 min after induction of SI, punctate foci of actin are formed in incompatible pollen grains and tubes. This suggests the occurrence of SI-induced signaling events after inhibition of growth. We have previously identified a phosphoprotein (p68) exhibiting an S-specific increase in Ca2+-independent phosphorylation that occurs 4 to 5 min after interaction of pollen with S proteins. We have also recently identified a mitogen-activated protein kinase that is activated 5 min after induction of the SI response and remains active at 30 min (J.J. Rudd, F.C.H. Franklin, and V.E. Franklin-Tong, submitted manuscript). Because pollen tube growth is arrested before any of these events occurs, they cannot be implicated in the inhibition of pollen tube growth, even though they are S specific. Our recent identification of nuclear DNA fragmentation (Jordan et al., 2000) in incompatible pollen tubes may throw some light on the role of these later events, because that fragmentation is a feature of eukaryotic cells undergoing programmed cell death. This was first detected at 4 hr and was detectable in the majority of pollen nuclei by 12 to 14 hr. We can speculate that the later changes to the F-actin cytoskeleton observed might play a role in this phase of the SI response.
Possible Mechanism of Actin Rearrangements
The dramatic and rapid changes of the actin cytoskeleton after S protein challenge raise the question of how these alterations are mediated. There are several possibilities for how the apparent reconfiguration of actin arrays following the SI response might be achieved. Increases in [Ca2+]i, known to stimulate the SI response, might also affect the actin cytoskeleton either directly by influencing the state of polymerization or indirectly by activating or inactivating actin binding proteins. Potential candidates might be a capping protein, such as β-actinin (Cap Z); an actin-severing agent, such as gelsolin; an actin-depolymerizing factor, such as ADF; or an actin-sequestering protein, such as profilin (reviewed in de Ruijter and Emons, 1999). The latter two actin binding proteins are of particular interest because of their demonstrated abundance in pollen (Jiang et al., 1997a, 1997b; reviewed in Staiger et al., 1997).
There is little information on the regulation of actin polymer levels or dynamics in pollen. Our use of drugs that interfere with actin dynamics suggests that the SI response is not simply a process involving F-actin depolymerization. Some of the drug-induced F-actin configurations do resemble the early SI-induced actin changes, for example, marginalization and disintegration of F-actin, but there are also clear differences. Crucially, the punctate foci observed later in the SI response were not observed in drug-treated pollen tubes. We conclude from these comparisons that although depolymerizing activities probably play a role in the SI response, other factors must also be involved. We have not attempted to postulate what mechanisms might be responsible for the formation of punctate foci of actin described here; this would be pure speculation, given the lack of information on this in angiosperms.
The phosphatidyl-inositol pathway is implicated in playing a regulatory role in the modulation of pollen tube growth (Franklin-Tong et al., 1996; Kost et al., 1999). Furthermore, given that profilin, actin-depolymerizing factor, and gelsolin are known to bind to phosphatidylinositol 4,5-bisphosphate (Drøbak et al., 1994; Sohn and Goldschmidt-Clermont, 1994), there might be a link between these actin binding proteins, a signaling pathway, and the regulation of pollen tube growth. Although phosphatidylinositol signaling has not been investigated in the SI response, the large increases in [Ca2+]i in P. rhoeas pollen triggered by this response (Franklin-Tong et al., 1997) are likely to alter actin binding protein activities and thereby have an effect on the actin dynamics. However, further studies are required, and any detailed discussion of the possible mechanisms involved would be highly speculative.
In summary, we report here that the actin cytoskeleton undergoes several signal-dependent rearrangements in response to a physiological stimulus that inhibits growth. Because the actin cytoskeleton plays a central role in tip growth, we suggest that P. rhoeas pollen represents a new model system for investigating signal-mediated regulation of tip growth through the modulation of actin dynamics. Our observations implicate the involvement of actin binding proteins. Currently, we are investigating the relationship between these actin binding proteins and the signaling cascade elicited by S proteins.
METHODS
Plant Material
Plants (Papaver rhoeas cv Shirley) segregating for known self-incompatibility (SI) genotypes (S1S3, S2S4, and S4S6) were used for experiments involving S proteins (see Franklin-Tong et al., 1988), and pollen with undetermined S genotypes was used for drug experiments. Pollen was stored at −20°C over silica gel until needed.
Compatible and Incompatible Pollinations in Vivo
Flowers of P. rhoeas plants were emasculated 1 or 2 days before anthesis. On the next day, petals and sepals were removed, and the stigmas were pollinated with pollen from plants of the same (incompatible) or different (compatible) S genotype. After various periods, stigmas were excised and subjected to fixation and phalloidin labeling as described in the section on sample preparation for fluorescence microscopy.
In Vitro Growth of Pollen Tubes
Pollen was hydrated in a humid chamber at room temperature for at least 30 min before use. Hydrated pollen was sown on a thin layer of growth medium (GM) (100 μg mL−1 H3BO3, 300 μg mL−1 Ca[NO3]2 · H2O, 100 μg mL−1 KNO3, 200 μg mL−1 MgSO4 · 7 H2O, and 50 mg mL−1 sucrose) that was solidified with 0.5 or 1% low-gelling-temperature agarose (BDH Ltd., Poole, UK) prepared on a microscope slide. Pollen was germinated at 25°C, and the agarose medium was then covered with a thin layer of liquid GM.
Production of Recombinant S Protein in Escherichia coli
Recombinant S proteins S1e and S3e were prepared as described in Kakeda et al. (1998). The purified proteins were kept at −70°C and dialyzed overnight against GM before use. Dialyzed S proteins were kept at 4°C. The concentrations of S proteins after dialysis were determined with the protein assay kit BCA-200 (Pierce, Rockford, IL) or the Bradford assay (Bio-Rad, Poole, UK).
SI Challenges of in Vitro–Growing Pollen Tubes
For the SI challenges, pollen from plants of S genotype S1S3 (incompatible) and S2S4 or S4S6 (fully compatible) were grown on agarose GM covered by liquid GM as described above, and the recombinant S proteins S1e and S3e were added to the covering liquid GM, as described more fully in Franklin-Tong et al. (1993). For experiments used to mimic the in vivo conditions more closely, S proteins were incorporated into 0.5% low-gelling-temperature agarose in GM, without the addition of liquid GM, because P. rhoeas stigmas are of the dry type. Hydrated pollen was sown on this medium and then grown as normal.
Determination of Active Concentrations of S Proteins and Drugs
Pollen was grown on solidified GM, as described above. To determine the 100% effective concentration (EC100), pollen tubes were grown to ∼100 μm long, and the liquid GM was substituted by GM containing various concentrations of drugs or S proteins. Pollen tube growth was assessed by measuring the length of the pollen tubes after 60 min. Each newly dialyzed sample of S proteins was checked for its EC100 value, the concentration at which incompatible pollen tube growth is inhibited completely. For these experiments, the EC100 value was 20 μg mL−1 for S1e and 30 μg mL−1 for S3e. The EC100 determinations for the drugs are shown in Table 1.
Sample Preparation for Fluorescence Microscopy
Pollen tubes were treated with freshly prepared m-maleimidobenzoyl N-hydroxysuccinimide ester at 100 to 400 μM (Sigma-Aldrich Chemie BV, Zwijndrecht, The Netherlands) in GM for 5 to 6 min to stabilize the actin filaments. These were subsequently fixed for 30 min with freshly prepared 2% formaldehyde in GM and for 30 min with 4% formaldehyde in actin-stabilizing buffer (ASB) (100 mM Pipes, pH 6.8, 1 mM MgCl2, 1 mM CaCl2, and 75 mM KCl). The samples were washed in ASB three times, permeabilized with either 100 μg mL−1 l-α-lysophosphatidylcholine (Sigma) in ASB for 25 min or 0.05% Tween-20 in Tris-buffered saline containing DTT for 25 min, and labeled with Alexa 488–phalloidin, fluorescein–phalloidin, or rhodamine–phalloidin (Molecular Probes, Eugene, OR) diluted 1:50 (or at 500 nM) in ASB. Specimens were washed with buffer before mounting with CITIFLUOR glycerol (Citifluor, Canterbury, UK) or Vectar shield (Vectar Laboratories, Burlingame, CA).
Fluorescence Microscopy
Fluorescence microscopy was performed with a Nikon Microphot-FXA (Nikon UK, Surrey, UK) equipped with a Nikon PlanApo ×60 oil immersion objective (NA 1.40) and a Photometrics Quantix cooled charge-coupled device camera (Roper Scientific Inc., Trenton, NJ). Standard filter sets for rhodamine and fluorescein isothiocyanate were used. Data were processed with IPLab Spectrum software (Scanalytics, Fairfax, VA) and Photoshop (Adobe Systems, San Jose, CA). Confocal laser scanning microscopy was performed with a Nikon Diaphot TMD inverted microscope attached to a Bio-Rad MRC-600 confocal system (Bio-Rad Microscience, Hemel Hempstead, UK) equipped with a 25-mW argon-ion laser and a Nikon PlanApo ×60 oil immersion objective. Rhodamine–phalloidin detection of actin was performed with standard Texas Red filters (Bio-Rad), and confocal optical sections were made.
Quantitative Assessment of Actin Rearrangements
For quantitative assessment of alterations in actin configuration, identical batches of S1e and S3e were used to challenge pollen from plants of S genotype S1S3(incompatible) and S2S4 (fully compatible) and prepared for fluorescence microscopy, as described in the section on sample preparation for fluorescence microscopy. Actin configurations were divided into classes, as described in Results. The results are from three independent experiments in which at least 80 pollen tubes were counted at each time sampled.
Acknowledgments
We are indebted to John Martin and colleagues for their horticultural services. We thank Norbert de Ruijter and Tijs Ketelaar for help with technical questions. A.G. is funded by a Marie Curie postdoctoral grant from the European Union. B.N.S. gratefully acknowledges receipt of a Biotechnology and Biological Sciences Research Council (BBSRC) Studentship. Work in V.E.F.-T.'s laboratory is funded by the BBSRC.
References
- Cai, G., Moscatelli, A., and Cresti, M. (1997). Cytoskeletal organization and pollen tube growth. Trends Plant Sci. 2, 86–91. [Google Scholar]
- Cardenas, L., Vidali, L., Domingez, J., Perez, H., Sanchez, F., Hepler, P.K., and Quinto, C. (1998). Rearrangement of actin microfilaments in plant root hairs responding to Rhizobium etli nodulation signals. Plant Physiol. 116, 871–877. [DOI] [PMC free article] [PubMed] [Google Scholar]
- Cooper, J.A. (1987). Effects of cytochalasin and phalloidin on actin. J. Cell Biol. 105, 1473–1478. [DOI] [PMC free article] [PubMed] [Google Scholar]
- Czymmek, K.J., Bourett, T.M., and Howard, R.J. (1996). Immunolocalization of tubulin and actin in thick-sectioned fungal hyphae after freeze-substitution fixation and methacrylate de-embedment. J. Microbiol. 181, 153–161. [Google Scholar]
- Dearnaley, J.D.W., Clark, K.M., Heath, I.B., Lew, R.R., and Goring, D.R. (1999). Neither compatible nor self-incompatible pollinations of Brassica napus involve reorganization of the papillar cytoskeleton. New Phytol. 141, 199–207. [DOI] [PubMed] [Google Scholar]
- Derksen, J., Rutten, T., VanAmstel, T., DeWin, A., Doris, F., and Steer, M. (1995). Regulation of pollen tube growth. Acta Bot. Neerl. 44, 93–119. [Google Scholar]
- de Ruijter, N.C.A., and Emons, A.M.C. (1999). Actin binding proteins in plant cells. Plant Biol. 1, 26–35. [Google Scholar]
- de Ruijter, N., Bisseling, T., and Emons, A. (1999). Rhizobium Nod factors induce an increase in subapical fine bundles of actin filaments in Vicia sativa root hairs within minutes. Mol. Plant-Microbe Interact. 12, 829–832. [Google Scholar]
- Doris, F.P., and Steer, M.W. (1996). Effects of fixatives and permeabilisation buffers on pollen tubes: Implications for localisation of actin microfilaments using phalloidin staining. Protoplasma 195, 25–36. [Google Scholar]
- Drøbak, B.K., Watkins, P.A.C., Valenta, R., Dove, S.K., Lloyd, C.W., and Staiger, C.J. (1994). Inhibition of plant plasma membrane phosphoinositide phospholipase C by the actin-binding protein, profilin. Plant J. 6, 389–400. [Google Scholar]
- Foote, H.G., Ride, J.P., Franklin-Tong, V.E., Walker, E.A., Lawrence, M.J., and Franklin, F.C.H. (1994). Cloning and expression of a novel self-incompatibility (S-) gene from Papaver rhoeas L. Proc. Natl. Acad. Sci. USA 91, 2265–2269. [DOI] [PMC free article] [PubMed] [Google Scholar]
- Franklin, F.C.H., Hackett, R.M., and Franklin-Tong, V.E. (1992). The molecular biology of self-incompatible responses. In Perspectives in Plant Cell Recognition, J.A. Callow and J.R. Green, eds (Cambridge, UK: Cambridge University Press), pp. 79–103.
- Franklin-Tong, V.E. (1999. a). Signaling and the modulation of pollen tube growth. Plant Cell 11, 727–738. [DOI] [PMC free article] [PubMed] [Google Scholar]
- Franklin-Tong, V.E. (1999. b). Signalling in pollination. Curr. Opin. Plant Biol. 2, 490–495. [DOI] [PubMed] [Google Scholar]
- Franklin-Tong, V.E., Lawrence, M.J., and Franklin, F.C.H. (1988). An in-vitro method for the expression of self-incompatibility in Papaver rhoeas using stigmatic extracts. New Phytol. 110, 109–118. [Google Scholar]
- Franklin-Tong, V.E., Ride, J.P., Read, N.D., Trewavas, A.J., and Franklin, F.C.H. (1993). The self-incompatibility response in Papaver rhoeas is mediated by cytosolic free calcium. Plant J. 4, 163–177. [Google Scholar]
- Franklin-Tong, V.E., Ride, J.P., and Franklin, F.C.H. (1995). Recombinant stigmatic self-incompatibility (S-) protein elicits a Ca2+ transient in pollen of Papaver rhoeas. Plant J. 8, 299–307. [Google Scholar]
- Franklin-Tong, V.E., Drøbak, B.K., Allen, A.C., Watkins, P.A.C., and Trewavas, A.J. (1996). Growth of pollen tubes of Papaver rhoeas is regulated by a slow-moving calcium wave propagated by inositol 1,4,5-trisphosphate. Plant Cell 8, 1305–1321. [DOI] [PMC free article] [PubMed] [Google Scholar]
- Franklin-Tong, V.E., Hackett, G., and Hepler, P.K. (1997). Ratio-imaging of [Ca2+]i in the self-incompatibility response in pollen tubes of Papaver rhoeas. Plant J. 12, 1375–1386. [Google Scholar]
- Geitmann, A., and Cresti, M. (1998). Cell death of self-incompatible pollen tubes: Necrosis or apoptosis? In Fertilization in Higher Plants, M. Cresti, G. Cai, and A. Moscatelli, eds (Berlin: Springer-Verlag), pp. 113–138.
- Geitmann, A., and Emons, A.M.C. (2000). The cytoskeleton in plant and fungal cell tip growth. J. Microsc., in press. [DOI] [PubMed]
- Geitmann, A., Hudák, J., Vennigerholz, F., and Walles, B. (1995). Immunogold localization of pectin and callose in pollen grains and pollen tubes of Brugmansia suaveolens—Implications for the self-incompatibility reaction. J. Plant Physiol. 147, 225–235. [Google Scholar]
- Harold, F.M., and Harold, R.L. (1992). Configuration of actin microfilaments during sporangium development in Achlya bisexualis: Comparison of two staining protocols. Protoplasma 171, 110–116. [Google Scholar]
- Hearn, M.J., Franklin, F.C.H., and Ride, J.P. (1996). Identification of a membrane glycoprotein in pollen of Papaver rhoeas which binds stigmatic self-incompatibility (S-) proteins. Plant J. 9, 467–475. [Google Scholar]
- Heslop-Harrison, J.J. (1983). Self-incompatibility: Phenomenology and physiology. Proc. R. Soc. Lond. Ser. B 218, 317–395. [Google Scholar]
- Jiang, C.J., Weeds, A.G., and Hussey, P.J. (1997. a). The maize actin depolymerizing factor, ZmADF3, redistributes to the growing tip of elongating root hairs and can be induced to translocate into the nucleus with actin. Plant J. 12, 1035–1043. [DOI] [PubMed] [Google Scholar]
- Jiang, C.J., Weeds, A.G., Khan, S., and Hussey, P.J. (1997. b). F-actin and G-actin binding are uncoupled by mutation of conserved tyrosine residues in maize actin depolymerizing factor (ZmADF). Proc. Natl. Acad. Sci. USA 94, 9973–9978. [DOI] [PMC free article] [PubMed] [Google Scholar]
- Jordan, N.D., Kakeda, K., Conner, A., Ride, J.P., Franklin-Tong, V.E., and Franklin, F.C.H. (1999). S-protein mutants indicate a functional role for SBP in the self-incompatibility reaction of Papaver rhoeas. Plant J. 20, 119–126. [DOI] [PubMed] [Google Scholar]
- Jordan, N.D., Franklin, F.C.H., and Franklin-Tong, V.E. (2000). Evidence for DNA fragmentation triggered in the self-incompatibility response in pollen of Papaver rhoeas. Plant J., in press. [DOI] [PubMed]
- Kakeda, K., Jordan, N.D., Conner, A., Ride, J.P., Franklin-Tong, V.E., and Franklin, F.C.H. (1998). Identification of residues in a hydrophilic loop of the Papaver rhoeas S protein that play a crucial role in recognition of incompatible pollen. Plant Cell 10, 1723–1731. [DOI] [PMC free article] [PubMed] [Google Scholar]
- Karpova, T.S., McNally, J.G., Moltz, S.L., and Coopter, J.A. (1998). Assembly and function of the actin cytoskeleton of yeast: Relationships between cables and patches. J. Cell Biol. 142, 1501–1517. [DOI] [PMC free article] [PubMed] [Google Scholar]
- Kost, B., Spielhofer, P., and Chua, N.-H. (1998). A GFP–mouse talin fusion protein labels plant actin filaments in vivo and visualizes the actin cytoskeleton in growing pollen tubes. Plant J. 16, 393–401. [DOI] [PubMed] [Google Scholar]
- Kost, B., Lemichez, E., Spielhofer, P., Hong, Y., Tolias, K., Carpeter, C., and Chua, N.-H. (1999). Rac homologues and compartmentalized phosphatidylinositol 4,5-bisphosphate act in a common pathway to regulate polar pollen tube growth. J. Cell Biol. 145, 317–330. [DOI] [PMC free article] [PubMed] [Google Scholar]
- Kurup, S., Ride, J.P., Jordan, N.D., Fletcher, G., Franklin-Tong, V.E., and Franklin, F.C.H. (1998). Identification and cloning of related self-incompatibility S genes in Papaver rhoeas and P. nudicaule. Sex. Plant Reprod. 11, 192–198. [Google Scholar]
- Lancelle, S.A., Cresti, M., and Hepler, P.K. (1997). Growth inhibition and recovery in freeze-substituted Lilium longiflorum pollen tubes: Structural effects of caffeine. Protoplasma 196, 21–33. [Google Scholar]
- Lawrence, M.J., Afzal, M., and Kenrick, J. (1978). The genetical control of self-incompatibility in Papaver rhoeas L. Heredity 40, 239–285. [Google Scholar]
- Lord, E.M. (1992). Pollination as a case of adhesion and cell movement. In Pollen–Pistil Interactions and Pollen Tube Growth, A.G. Stephenson and T.-H. Kao, eds (Rockville, MD: American Society of Plant Physiologists), pp. 124–134.
- Malhó, R., and Trewavas, A.J. (1996). Localized apical increases of cytosolic free calcium control pollen tube orientation. Plant Cell 8, 1935–1949. [DOI] [PMC free article] [PubMed] [Google Scholar]
- Miller, D.D., Lancelle, S.A., and Hepler, P.K. (1996). Actin microfilaments do not form a dense meshwork in Lilium longiflorum pollen tube tips. Protoplasma 195, 123–132. [Google Scholar]
- Miller, D.D., De Ruijter, C.A., Bisseling, T., and Emons, A.M.C. (1999). The role of actin in root hair morphogenesis: Studies with lipochito-oligosaccharide as a growth stimulator and cytochalasin as an actin perturbing drug. Plant J. 17, 141–154. [Google Scholar]
- Mulholland, J., Preuss, D., Moon, A., Wong, A., Drubin, D., and Botstein, D. (1994). Ultrastructure of the yeast actin cytoskeleton and its association with the plasma membrane. J. Cell Biol. 125, 381–391. [DOI] [PMC free article] [PubMed] [Google Scholar]
- Nick, P. (1999). Signals, motors, morphogenesis—The cytoskeleton in plant development. Plant Biol. 1, 169–179. [Google Scholar]
- Pacini, E. (1982). Pollen–stigma interactions in plants with gametophytically controlled self-incompatibility. Phytomorphology 81, 175–180. [Google Scholar]
- Palladini, G., Finardi, G., and Bellomo, G. (1996). Disruption of actin microfilament organization by cholesterol oxides in 73/73 endothelial cells. Exp. Cell Res. 223, 72.–82. [DOI] [PubMed] [Google Scholar]
- Pierson, E.S., Derksen, J., and Traas, J.A. (1986). Organization of microfilaments and microtubules in pollen tubes grown in vitro or in vivo in various angiosperms. Eur. J. Cell Biol. 41, 14–18. [Google Scholar]
- Pierson, E.S., Miller, D.D., Callaham, D.A., Shipley, A.M., Rivers, B.A., Cresti, M., and Hepler, P.K. (1994). Pollen tube growth is coupled to the extracellular calcium ion flux and the intracellular calcium gradient: Effect of BAPTA buffers and hypertonic media. Plant Cell 6, 1815–1828. [DOI] [PMC free article] [PubMed] [Google Scholar]
- Pierson, E.S., Miller, D.D., Callaham, D.A., van Aken, J., Hackett, G., and Hepler, P.K. (1996). Tip-localized calcium entry fluctuates during pollen tube growth. Dev. Biol. 174, 160–173. [DOI] [PubMed] [Google Scholar]
- Rudd, J.J., and Franklin-Tong, V.E. (1999). Calcium signalling in plants. Cell Mol. Life Sci. 55, 214–232. [DOI] [PMC free article] [PubMed] [Google Scholar]
- Rudd, J.J., Lord, J.M., Franklin, F.C.H., and Franklin-Tong, V.E. (1996). Increased phosphorylation of a 26-kD pollen protein is induced by the self-incompatibility response in Papaver rhoeas. Plant Cell 8, 713–724. [DOI] [PMC free article] [PubMed] [Google Scholar]
- Rudd, J.J., Franklin, F.C.H., and Franklin-Tong, V.E. (1997). Ca2+-independent phosphorylation of a 68-kD pollen protein is stimulated by the self-incompatibility response in Papaver rhoeas. Plant J. 12, 507–514. [DOI] [PMC free article] [PubMed] [Google Scholar]
- Shimmen, T., Hamatani, M., Saito, S., Yokota, E., Mimura, T., Fusetani, N., and Karaki, H. (1995). Roles of actin filaments in cytoplasmic streaming and organization of transvacuolar strands in root hair cells of Hydrocharis. Protoplasma 185, 188–193. [Google Scholar]
- Singh, A., and Kao, T.-H. (1992). Gametophytic self-incompatibility: Biochemical, molecular genetic, and evolutionary aspects. In Sexual Reproduction in Flowering Plants, S.D. Russell and C. Dumas, eds (New York: Academic Press), pp. 449–483. [DOI] [PubMed]
- Sohn, R.H., and Goldschmidt-Clermont, P.J. (1994). Profilin: At the crossroads of signal transduction and the actin cytoskeleton. BioEssays 16, 465–472. [DOI] [PubMed] [Google Scholar]
- Spector, I., Shochet, N.R., Blasberger, D., and Kashman, Y. (1989). Latrunculins: Novel marine macrolides that disrupt microfilament organization and affect cell growth. I. Comparison with cytochalasin D. Cell Motil. Cytoskeleton 13, 127–144. [DOI] [PubMed] [Google Scholar]
- Staiger, C.J. (2000). Signaling to the actin cytoskeleton in plants. Annu. Rev. Plant Physiol. Plant Mol. Biol. 51, 257–288. [DOI] [PubMed] [Google Scholar]
- Staiger, C.J., Gibbon, B.C., Kovar, D.R., and Zonia, L.E. (1997). Profilin and actin depolymerizing factor: Modulators of actin organization in plants. Trends Plant Sci. 2, 275–281. [Google Scholar]
- Waddle, J.A., Karpova, T.S., Waterston, R.H., and Cooper, J.A. (1996). Movement of cortical actin patches in yeast. J. Cell Biol. 132, 861–870. [DOI] [PMC free article] [PubMed] [Google Scholar]
- Yang, N., Higuchi, O., Ohashi, K., Nagata, K., Wada, A., Kangawa, K., Nishida, E., and Mizuno, K. (1998). Cofilin phosphorylation by LIM-kinase 1 and its role in Rac-mediated actin reorganization. Nature 392, 809–812. [DOI] [PubMed] [Google Scholar]