

Abstract
RNA gel blot and reverse transcription–polymerase chain reaction experiments were used to identify a single K+ channel gene in Arabidopsis as expressed throughout the plant. Use of the β-glucuronidase reporter gene revealed expression of this gene, AKT2/AKT3, in both source and sink phloem tissues. The AKT2/AKT3 gene corresponds to two previously identified cDNAs, AKT2 (reconstructed at its 5′ end) and AKT3, the open reading frame of the latter being shorter at its 5′ end than that of the former. Rapid amplification of cDNA ends with polymerase chain reaction and site-directed mutagenesis was performed to identify the initiation codon for AKT2 translation. All of the data are consistent with the hypothesis that the encoded polypeptide corresponds to the longest open reading frame previously identified (AKT2). Electrophysiological characterization (macroscopic and single-channel currents) of AKT2 in both Xenopus oocytes and COS cells revealed a unique gating mode and sensitivity to pH (weak inward rectification, inhibition, and increased rectification upon internal or external acidification), suggesting that AKT2 has enough functional plasticity to perform different functions in phloem tissue of source and sink organs. The plant stress hormone abscisic acid was shown to increase the amount of AKT2 transcript, suggesting a role for the AKT2 in the plant response to drought.
INTRODUCTION
Plant growth and development are dependent on translocation of newly fixed photoassimilates from the sites of synthesis (sources) to the sites of consumption or storage (sinks) (Sonnewald and Willmitzer, 1992). Loading solutes into the sieve tubes at the source and unloading them at the sink are thought to result in a gradient of osmotic potential along the phloem tubes, from source to sink. The resulting gradient in turgor pressure gives rise to the movement of water and solutes (mass flow as great as 1 m hr−1) toward the sink (Patrick, 1997; Sjölund, 1997; Oparka and Turgeon, 1999).
Identifying membrane transport proteins that may be involved in the loading and unloading processes is a major focus of current research on phloem. Assimilate loading and unloading have only recently begun to be explored with molecular and cellular approaches (Rentsch and Frommer, 1996; Kühn et al., 1999). Until now, the focus has been on sucrose loading (Riesmeier et al., 1994; Truernit and Sauer, 1995; Kühn et al., 1997, 1999) and, to a lesser extent, membrane energization by proton pumping (DeWitt et al., 1991; DeWitt and Sussman, 1995). In contrast, the molecular mechanisms responsible for K+ loading into and unloading from the phloem sap have been poorly investigated, although a large set of electrophysiological data supports the view that these transports play major roles, taking part in both the control of phloem sap flow rate and the integration of K+ fluxes in the whole plant. Briefly, K+ assays in phloem sap have revealed large differences in concentration between sources and sinks, the concentration near the unloading sites being lower than that at the loading sites (Vreugdenhil, 1985; Fischer, 1987; Fromm and Eschrich, 1989; Hayashi and Chino, 1990). This gradient and the sucrose gradient are thought to play a major role in steepening the turgor gradient, which drives the phloem sap toward the sinks (Mengel and Haeder, 1977; Lang, 1983). In the latter role, K+ recirculation to the root via the phloem has been hypothesized as the signal that controls K+ secretion into the root xylem and, ultimately, K+ absorption from the soil (Drew and Saker, 1984; Marschner et al., 1996).
Recently, by use of reverse genetic techniques, two Arabidopsis K+ channels, AKT1 and SKOR, have been identified as being involved in K+ uptake from the soil solution and K+ release into the xylem sap, respectively (Gaymard et al., 1998; Hirsch et al., 1998). Both channels share sequence and structural similarities to animal Shaker channels (Jan and Jan, 1997). All of these channels have a tetrameric structure (Daram et al., 1997; Jan and Jan, 1997), each subunit having six transmembrane segments with one pore-forming domain. As a working hypothesis, we postulated that another channel of this family is involved in K+ transport in the phloem and that it is expressed in both source and sink organs, as are the AHA3 H+-ATPase and SUT1 sucrose carrier genes, which are involved in membrane energization and sucrose transport in phloem tissues, respectively (DeWitt et al., 1991; Kühn et al., 1999). Investigating the expression pattern of genes encoding Shaker-like K+ channels in Arabidopsis by RNA gel blot and reverse transcription–polymerase chain reaction (RT-PCR) experiments revealed a single gene, called AKT2 (Schroeder et al., 1994; Cao et al., 1995) or AKT3 (Ketchum and Slayman, 1996), which is expressed in all organs, including sources and sinks. The expression was greatest in mature leaves. Gene expression studies using a promoter–β-glucuronidase (GUS) construct revealed that AKT2/AKT3 is expressed in the phloem tissues of all organs.
The Arabidopsis K+ channel gene AKT2 and a cDNA incomplete at its 5′ end were initially identified by Cao et al. (1995). An open reading frame (ORF) was deduced from sequence analysis and homologies with other K+ channels previously identified in Arabidopsis, and the ORF was reconstructed by combining the cDNA and genomic sequences after an intron had been identified and removed. Evidence that the encoded polypeptide had K+ transport activity was obtained by functional complementation of an Escherichia coli mutant defective for K+ uptake (Uozumi et al., 1998). However, because injection of the corresponding in vitro–transcribed complementary RNA (cRNA) into Xenopus oocytes failed to induce any exogenous current when the membrane was hyperpolarized or depolarized (Cao et al., 1995), the functional properties of the encoded channel remained unknown.
Almost simultaneous with the identification of AKT2 by Cao et al. (1995), Ketchum and Slayman (1996) reported the cloning of another cDNA and another genomic clone corresponding to the same gene, although they called it AKT3. The first in-frame ATG codon of the AKT3 cDNA corresponds to the second in-frame ATG codon in the reconstructed AKT2 ORF. An electrical signal could be associated with the injection of AKT3 cRNA into Xenopus oocytes, revealing that the encoded polypeptides formed functional channels. The correct translational start site and ORF were subsequently assumed (Marten et al., 1999) to be those proposed for AKT3 (Ketchum and Slayman, 1996).
Because of the controversy about the coding sequence of the AKT2/AKT3 gene, we decided to determine whether transcripts longer than AKT3, which contain the first ATG codon of the AKT2 clone, are expressed in the plant. We used PCR to screen an Arabidopsis cDNA library and then used rapid amplification of cDNA ends with PCR (RACE-PCR) to identify those transcripts. When we used a mammalian expression vector, the channel encoded by AKT2 was expressed in both Xenopus oocytes and mammalian (COS) cells. Further analyses revealed that AKT2 has unique functional properties that are not displayed by any other plant or animal Shaker channel studied thus far. Because the characteristics of the currents were found to be similar in the two expression systems, we conclude that these properties do not reflect interactions with endogenous proteins of the expression system used but are intrinsic to AKT2. They provide exciting clues to the control of K+ transport in the phloem.
RESULTS
A Transcript Encoding the AKT2 Channel Is Expressed in Arabidopsis
Preliminary RNA gel blot experiments using probes derived from nine Arabidopsis cDNA or genes encoding Shaker-like K+ channels identified AKT2 as the gene with the broadest expression pattern (Figure 1A). High amounts of AKT2 transcripts were detected in all aerial organs, rosette leaves, caulinary leaves, stems, and flowers but not in roots (Figure 1A). However, the presence of AKT2 transcripts in roots was determined by RT-PCR (Figure 1B). Accumulation of AKT2 mRNA in aerial parts of the plant was found to increase in plants treated with the stress phytohormone abscisic acid (ABA; added to the culture medium used to bathe roots) (Figure 1C). The effect of ABA was both time- and concentration-dependent, markedly increasing AKT2 mRNA accumulation after 3 or 24 hr when administered at 100 and 6 μM, respectively. Finally, analysis of AKT2 expression in transgenic plants containing a GUS construct revealed that this gene is expressed primarily in the phloem tissues throughout the plant in both source and sink organs (Figure 2; see below).
Figure 1.

Expression of Akt2 and Other Channel Genes in the Plant, Effect of ABA on AKT2 Transcript Accumulation, and 5′ Sequence of the Identified AKT2 cDNA.
(A) Ten micrograms of total RNA, extracted from roots (R), rosette leaves (rL), caulinary leaves (cL), stems (St), or flowers and developing siliques (Fl) of 5-week-old Arabidopsis plants (ecotype Columbia), was fractionated according to size on agarose gel, transferred to a nylon membrane, and hybridized with a 32P-labeled DNA probe corresponding to the AKT2, AKT1, SKOR, AtKC1, KAT1, and KAT2 cDNAs or to the SKOR2 (bacterial artificial chromosome [BAC] MPA22; GenBank accession number AB025630), AKT5 (BAC F3N11; GenBank accession number AC006053), and AKT6 (BAC F8B4; GenBank accession number AL034567) genes. Exposure times were 24 hr (AKT2), 48 hr (AKT1 and SKOR), 3 days (AtKC1), 5 days (SKOR2, AKT5, and AKT6), and 7 to 8 days (KAT1 and KAT2). All gel blot analyses were performed in simultaneous experiments, with an identical aliquot (10 μg) from the same RNA preparation being loaded in each lane. Actin controls (data not shown) confirmed that the gels were identically loaded.
(B) RT-PCR experiments. Forty-five PCR cycles were performed with the following templates: 10 ng of cDNA (lane 1), 50 ng of genomic DNA (lane 2), and 1 μL from 50 μL of RT product obtained from 10 μg of root (lane 3) or leaf (lane 4) total RNA. The upper band in lane 3 corresponds to amplification of some genomic DNA contaminating the RNA preparation.
(C) RNA gel blot analysis of AKT2 gene expression in leaves in response to ABA added into the culture medium. Lanes labeled ABA (μM) correspond to 6, 20, 60, or 200 μM ABA added 24 hr before leaves were collected for RNA extraction. Lane C (control) corresponds to no ABA treatment. Lanes labeled 100 μM ABA (hr) correspond to 100 μM ABA added 3, 6, or 12 hr before leaves were collected. The membrane was successively hybridized with probes corresponding to AKT2 cDNA and ACT4 actin gene (Nairn et al., 1988).
(D) Nucleotide and deduced amino acid sequences from the 5′ region of AKT2 cDNA clone. Numbers refer to distance from the first ATG of the AKT2 cDNA clone. The 5′ untranslated region is in lowercase letters, and the coding sequence is in uppercase letters. The first ATG codon (position 1) is designated as the translational start site. The star at position 30 and the underlined ATG codon at position 46 indicate the respective positions of the transcriptional and translational start sites proposed in AKT3 cDNA by Ketchum and Slayman (1996).
Figure 2.
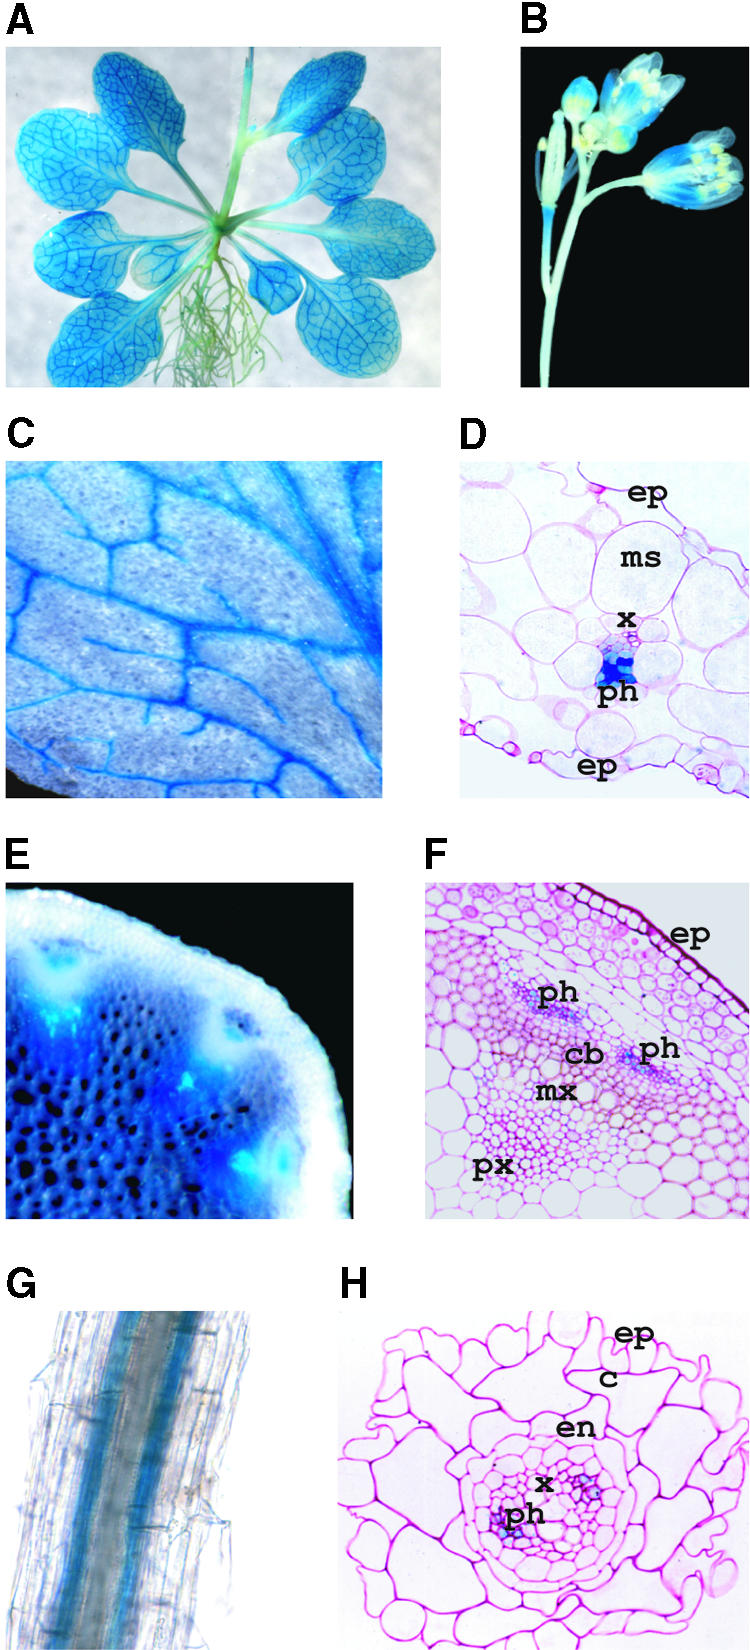
Localization of AKT2 Promoter Activity in Arabidopsis Transgenic Plants.
(A) Three-week-old plant.
(B) Flowers.
(C) and (D) Leaf magnification (C) and 3-μm-thick cross-section (D) showing staining in the phloem cells.
(E) and (F) Hand-cut (E) and 3-μm-thick (F) cross-sections of stem.
(G) and (H) Root magnification (G) and cross-section (H), showing GUS activity in the phloem cells.
GUS staining was performed on excised organs of in vitro–grown plantlets, except in (E) and (F), which present plants grown in soil. c, cortex; cb, cambium; en, endodermis; ep, epidermis; ms, mesophyll; mx, metaxylem; ph, phloem; px, protoxylem; x, xylem.
Because of the controversy about the coding sequence of the AKT2/AKT3 gene, we screened an Arabidopsis cDNA library (Minet et al., 1992) by PCR and performed 5′ RACE experiments with poly(A)+ RNA isolated from mature leaves. Primers hybridizing downstream from the first intron of the AKT2/AKT3 gene (see Methods) were used for both PCR experiments and first-strand synthesis. All of the amplified fragments corresponded to spliced products (i.e., the sequence of the first intron of the AKT2/AKT3 gene was not present in the amplified products). The PCR experiments used to screen the cDNA library identified a fragment 109 nucleotides longer at its 5′ end than was the AKT3 clone (Ketchum and Slayman, 1996), this supplementary sequence (Figure 1D; GenBank/EMBL accession number AJ243703) containing the ATG codon previously retained as the translational start in the AKT2 reconstructed clone (Cao et al., 1995). The RACE-PCR experiments identified five clones, all of which displayed a 5′ region longer than that of the AKT3 clone by at least 53 bp, thereby including the ATG codon retained by Cao et al. (1995). These data do not identify the transcriptional start site for the AKT2/AKT3 gene, but they clearly indicate that transcripts longer than the AKT3 clone and containing the AUG denoted as the translational start codon by Cao et al. (1995) are expressed in the plant.
Analysis of the genomic sequence indicates that no potential transcription factor IID binding site (TATA box, usually found ∼30 bp upstream from the transcriptional start site [Joshi, 1987]) is present for at least 180 bp upstream from the residue corresponding to the first nucleotide of the cDNA that we cloned. Noncanonical TATA boxes have been found in several plant genes (Joshi, 1987), and the absence of a TFIID binding site has been described for several animal genes, mainly those encoding ribosomal and housekeeping proteins (Dynan, 1986; Mager, 1988), but also for plants (Lagrange et al., 1993). Alternatively, the 5′ untranslated region of the AKT2 gene could be much longer than is the 5′ untranslated region of the cDNA we cloned, and the TATA box could be the same as that proposed by Cao et al. (1995). This TATA box is present at position −640 from the first ATG of the AKT2 ORF, ∼560 bp upstream from the first residue of the cDNA we cloned. The results of our 5′ RACE experiments, in comparison with those of the 5′ RACE experiments performed by Ketchum and Slayman (1996), and the fact that Cao et al. (1995) indicate in their report that they were unable to isolate a cDNA containing the complete ORF suggest that the leader of the AKT2 transcript is highly unstable, or that problems occur with first-strand synthesis (e.g., because of secondary structures), or both.
As indicated above, the first in-frame ATG in the cDNA we cloned is the one previously retained as the translational start in the AKT2 clone reconstructed by Cao et al. (1995). This ATG codon is in a good context for translation initiation because purine residues are present at the –3 and +4 positions (Joshi et al., 1997). As pointed out by Cao et al. (1995), this context is theoretically more favorable than that of the second in-frame ATG. By using expression vectors in Xenopus oocytes and in mammalian cells rather than injection of Xenopus oocytes with cRNA (previously reported by Cao et al. [1995] to fail for AKT2), we obtained evidence that the encoded polypeptides formed functional channels (see below). Furthermore, functional channels were also produced when the second ATG codon of the cDNA (corresponding to the translational start site in AKT3 cDNA) was mutated to the TTG leucine codon (data not shown). In conclusion, the whole set of data supports the hypothesis that polypeptides corresponding to the AKT2 coding sequence (Cao et al., 1995) are expressed and form functional channels in the plant. Hereafter, these polypeptides and the channels they form are called AKT2. The polypeptides encoded by the AKT3 ORF (Ketchum and Slayman, 1996) and the corresponding channel are called AKT3.
AKT2 Expression Pattern
Whole-mount hybridization experiments localized AKT2/AKT3 transcripts to major veins of leaves, and in situ hybridization studies of cross-sections of flower stalks revealed expression of these transcripts in the phloem tissues (Marten et al., 1999). We further analyzed AKT2 expression by using transgenic plants carrying the E. coli GUS reporter gene under the control of the AKT2 promoter region (1.5 kb). Reporter gene activity was analyzed for eight independent transgenic lines. Strong staining was present in vascular tissues of the leaves, petioles, and stems (Figure 2A). In flowers, GUS activity was detected in the vascular tissue of sepals, in the stamen filaments, and in the peduncle of developing siliques (Figure 2B). In leaves, GUS activity was detected in all veins in the phloem (Figures 2C and 2D). In the stem, activity was present in the xylem parenchyma and in the phloem (Figures 2E and 2F). GUS activity was also detected in root stelar tissues (Figure 2G). Cross-sectional analysis detected this activity only in phloem cells (Figure 2H). Faint staining appeared in the whole leaf blade (Figure 2A). Observation of 3-μm-thick cross-sections of a leaf by dark-field microscopy (to increase detection sensitivity) revealed staining in all leaf cells: mesophyll, epidermis, and guard cells (data not shown). Finally, similar expression patterns were observed for both greenhouse- and in vitro–grown plants.
Functional Characterization of AKT2 in Xenopus Oocytes and in COS Cells
Injection of AKT2 cRNA in Xenopus oocytes was reported to fail (Cao et al., 1995). This prompted us to address the characterization of AKT2 by DNA injection using an expression vector (pCI) that contains the human cytomegalovirus immediate–early enhancer/promoter region, allowing high and constitutive expression of DNA inserts in mammalian cells (as COS cells; see below). This kind of vector can be used in Xenopus oocytes with improved efficiency when directly injected into the nucleus (Soreq and Seidman, 1992).
In oocytes injected with pCI-AKT2 (pCI containing the AKT2 coding sequence), changes in membrane potential elicited exogenous macroscopic currents (Figure 3) that were never observed in control oocytes injected with the empty plasmid or water (Figures 3B and 3D). The macroscopic current had two kinetic components, an instantaneous (i.e., time-independent) component and a time-dependent component (Figures 3A and 3B). The instantaneous current could be recorded at all membrane voltages, whereas the time-dependent current appeared only when the voltage was more negative than −50 mV (Figure 3B). The instantaneous current was not the result of nonspecific membrane leakage because it was inhibited by two K+ channel blockers: by external tetraethylammonium (TEA) in a voltage-independent manner (∼50% inhibition in 10 mM TEA; results not shown), and by external Cs+ in a voltage-dependent manner, the inhibition being strongest at the more negative membrane potentials (Figure 3C). External Ca2+ also caused a hyperpolarization-dependent block of the AKT2 current (∼40% inhibition at −160 mV for 10 mM external Ca2+; data not shown).
Figure 3.

Functional Expression of AKT2 Channels in Xenopus Oocytes Assessed by Two-Electrode Voltage–Clamp.
(A) AKT2 currents elicited in a 100 mM K+ external solution by 3-sec voltage pulses from +45 to –150 mV (–15 mV steps, 0 mV holding potential, 0 current level are indicated by dotted lines).
(B) I/V plots from records obtained in a 100 mM K+ external solution: steady state current sampled at the end of the 3-sec pulses (open circles), instantaneous current sampled at the beginning of the pulses (open squares), and time-dependent current determined as the difference between these two components (open triangles). The closed circles represent the steady state current from H2O-injected oocytes. All data are mean ±se from nine oocytes. The inset shows the reversal potential of AKT2 current (Erev, inverted triangles) as a function of external K+ concentration (mean ±se;  ); the line represents the K+ Nernst potential (EK).
(C) I/V plots of the AKT2 instantaneous current in a 100 mM K+ external solution in the absence (open squares) or in the presence (closed squares) of 10 mM Cs+ (mean ±se;  ).
).
(D) I/V plot of the steady state current (sampled at the end of the 3-sec pulses) in a 10 mM K+ external solution (AKT2-injected oocyte, open diamonds; H2O-injected oocyte, closed diamonds). The inset shows the outward steady state current (mean ±se;  ) recorded at +45 mV (I+45) under the same conditions for oocytes injected with H2O (left) and oocytes injected with AKT2 (right).
The relationship between the reversal potential of AKT2 current and the external K+ concentration (−53.0 ± 1.3 mV per decade; mean ±se,  ) well fits the Nernst equation (inset in Figure 3B), indicating that AKT2 is a K+-selective channel. Furthermore, high expression of AKT2 was found to clamp the resting potential of the membrane close to the K+ equilibrium potential EK (
 in 10 mM K+,
  ), as expected for a K+-selective channel active at all membrane potentials (Lesage et al., 1996).
Electrophysiological characterization of ion channels by using heterologous expression systems can lead to a distorted view of biophysical properties, probably because of artifactual interactions with endogenous structures (Honoré et al., 1992; Barhanin et al., 1996; Dreyer et al., 1999). To determine whether the unique gating properties (see Discussion) observed in Xenopus oocytes corresponded to an intrinsic feature and therefore constituted a hallmark of AKT2, the channel was expressed in COS cells by using the expression vector pIRES-CD8-AKT2. As previously reported (Fink et al., 1998), control experiments with untransfected or pIRES-CD8–transfected cells revealed no noticeable K+ currents (data not shown). On the other hand, large macroscopic currents were observed in cells transfected with the AKT2 construct when there were changes in membrane potential (Figure 4A). Genes encoding plant water channels have been cloned by immunoscreening of a cDNA library transiently expressed in COS cells (Kammerloher et al., 1994). We definitively report that this expression system can be used for functional characterization of plant ion channels. The current displayed the two components recorded in Xenopus oocytes: the instantaneous component was observed whatever the voltage, and the time-dependent component was seen at voltages more negative than −50 mV (Figure 4A). The I/V relationships of these two components are similar in COS cells (Figure 4B) and Xenopus oocytes (Figure 3B). As with the oocytes studies, we routinely checked that the instantaneous current could be inhibited in a voltage-dependent manner by external Cs+ (data not shown).
Figure 4.

Patch–Clamp Recording of AKT2 Expressed in COS Cells or Xenopus Oocytes.
(A) COS whole-cell recordings of AKT2 currents elicited in a 150 mM K+ external solution by 2.7-sec voltage pulses from –160 to +40 mV (20-mV steps, 0 mV holding potential, and 0 current level are indicated by dotted lines).
(B) I/V plots from records obtained in a 150 mM K+ external solution. Steady state currents were sampled at the end of the 2.7-sec pulses (open circles), instantaneous currents were sampled at the beginning of the pulses (open squares), and time-dependent current were calculated as the difference between these two components (open triangles). All data are mean ±se from six COS cells.
(C) AKT2 single-channel currents in a COS cell recorded under voltage–clamp at –75, –100, and –125 mV. C, closed state; O, open state.
(D) AKT2 single-channel currents in a Xenopus oocyte recorded under voltage–clamp at +50, 0, –50, –100, and –150 mV. C, closed state; O, open state.
(E) Trace at top, normalized sum of 300 pulses at –150 mV from a holding potential of 0 mV (Xenopus oocyte; see [D]). Trace at bottom, normalized current at –150 mV measured by two-electrode voltage–clamp (Xenopus oocyte; see Figure 3).
(F) Single-channel current–voltage relationship measured during voltage–clamp experiments with Xenopus oocytes (100 mM K+ in the pipette, closed circles; mean ±se;  ) and COS cells (150 mM K+ in the pipette, open circles; mean ±se;
  ). The inward single-channel conductance derived from the slope of the linear section of the I/V curves at negative membrane potential is 23.8 ± 0.5 (three to seven oocytes) and 29.8 ± 0.6 (three COS cells).
Single-channel currents were recorded in COS cells (Figures 4C and 4F) and in Xenopus oocytes (Figures 4D to 4F) in the cell-attached patch–clamp configuration. Recordings from AKT2-expressing oocytes and COS cells revealed both inward and outward K+ currents (Figures 4D to 4F and Figure 4F, respectively), in agreement with the macroscopic current data (Figures 3A to 3C and Figure 4A, respectively). Summing 300 pulses at −150 mV revealed that the recorded single-channel current was indeed mediated by AKT2: the resulting curve was clearly reminiscent of the macroscopic current trace recorded by the two-electrode voltage–clamp technique, with both an instantaneous and a time-dependent component (Figure 4E). The single-channel I/V relationship (Figure 4F) displayed a slight inward rectification. The slope conductance of the inward current was 25 pS in Xenopus oocytes (with 100 mM K+ in the pipette) and 30 pS in COS cells (with 150 mM K+ in the pipette).
Effect of pH on the AKT2 Current
The effect of internal and external acidification on AKT2 activity was investigated by using a two-electrode voltage–clamp in Xenopus oocytes. Decreasing the external pH from 7.0 to 5.6 induced a decrease in the AKT2 current (Figure 5A). Inhibition of the instantaneous current was twice that of the time-dependent current (Figure 5C), suggesting that the mechanisms involved in AKT2 current inhibition by external acidification differ for the instantaneous and the time-dependent components of the current.
Figure 5.

Effects of External or Internal pH on AKT2 Macroscopic Currents in Xenopus Oocytes.
(A) External acidification. Relationship of the total AKT2 current to the membrane potential (in 100 mM external K+) at external pH 7.0 (open circles) or 5.6 (closed circles) (mean ±se;  ).
).
(B) Internal acidification. Relationship of the total AKT2 current to the membrane potential at internal pH 7.4 (100 mM KCl, pH 7.0, in the bath, open circles) or at internal pH 7.0 (100 mM potassium acetate, pH 7.0, in the bath, closed circles) (mean ±se;  ).
).
(C) Inhibition of the time-dependent and instantaneous components of the AKT2 current by external (pHe) or internal (pHi) acidification (experimental conditions as given in [A] and [B], respectively). Data (mean ±se;  ) are expressed as the percentage of the control (open symbols in [A] and [B]) for a –150 mV membrane potential.
Adding acetate to the external solution is known to induce acidification of the cytosol (Roos and Boron, 1981; Tsai et al., 1995). The protonated form of this molecule can diffuse through the membrane into the cytosol, where it dissociates and releases protons. Using intracellular pH-sensitive microelectrodes, we were able to measure the internal acidification induced by acetate under our conditions. The internal pH value was 7.4, in a bath solution containing 100 mM KCl at pH 7.0, in agreement with previous reports (Tsai et al., 1995). Substituting acetate for Cl− (100 mM potassium acetate, pH 7.0) decreased the internal pH to a steady state value close to 6.9 (±0.1,  ) after ∼5 min. This acidification by 0.5 pH unit in turn decreased the AKT2 current (Figure 5B). The inhibition of the instantaneous component was more than fourfold that of the time-dependent component (Figure 5C). As with external acidification, internal acidification is thus also likely to inhibit the AKT2 instantaneous and time-dependent currents by different mechanisms. Incidentally, this results in an increased inward rectification of the residual current.
The inhibition by external pH of both the instantaneous and time-dependent AKT2 current was also studied in the COS expression system. During the first step, we checked that the instantaneous component was inhibited by 10 mM external Cs+ (Figure 6A; the inhibition is voltage dependent). This indicates that the instantaneous currents were more likely to flow through K+-selective channels (AKT2) than through a nonselective leak pathway.
Figure 6.

Inhibition of AKT2 Current in COS Cells by Cs+ and External Acidification.
(A) Instantaneous AKT2 current plotted against membrane potential. The external solution contained 150 mM K+, pH 7.4 (open squares), or 150 mM K+ and 10 mM Cs+, pH 7.4 (closed squares). Data are mean ±se ( 5).
5).
(B) AKT2 current at steady state plotted against membrane potential. The control was 100 mM K+, pH 7.4, in the external solution (open circles). External acidification was with 100 mM K+, pH 6.5 (closed diamonds) or 5.6 (open diamonds), in the external solution. Data are mean ±se ( 5).
5).
(C) Comparison of the inhibition of AKT2 instantaneous current (hexagons) and the time-dependent current (inverted triangles) by external acidification from pH 7.4 to 6.5 (closed symbols) or from pH 7.4 to 5.6 (open symbols). Data are mean ±se ( ).
).
Decreasing the external pH from 7.4 to 6.5 or 5.6 decreased the AKT2 current in COS cells (Figure 6B). Both the instantaneous and the time-dependent components of the current were sensitive to external acidification (Figure 6C). At pH 6.5, the inhibition of the instantaneous component was stronger than that of the time-dependent component (∼55 and 30%, respectively; Figure 6C). Under these conditions, in oocytes at pH 5.6, external acidification resulted in an increased inward rectification of the residual current. At external pH 5.6, the inhibition in COS cells of the instantaneous and time-dependent components of the AKT2 current was more important, exceeding 80% for the two components (Figure 6C), and obviated the difference in pH sensitivity between the two components. In conclusion, the pH effects on the AKT2 current are qualitatively the same in the oocyte and COS expression systems. However, the AKT2 channel is more sensitive to external acidification in the COS context for unknown reasons.
DISCUSSION
AKT2 Is a K+ Channel Expressed in Phloem Tissues throughout the Plant
With the goal of identifying membrane proteins involved in K+ transport in phloem tissues, we searched within the Shaker family (the largest family of K+ channels identified in plants to date) in Arabidopsis for genes with broad expression patterns. A single gene, AKT2, was found to be highly expressed in all aerial organs, compared with the other eight channel genes tested at the same time. AKT2 transcripts also could be detected in roots but in lower amounts (Figure 1). Because of the controversy about the translation start site and the coding sequence of the AKT2 gene (Cao et al., 1995; Ketchum and Slayman, 1996), we screened a cDNA library, performed RACE-PCR experiments, and mutated the second in-frame ATG (retained as the translation start site in the AKT3 cDNA). The whole set of data indicated that (1) transcription of the AKT2 gene gives rise to a messenger with a translational start site and a coding sequence identical to those previously retained from sequence analysis (Cao et al., 1995) and (2) the encoded AKT2 polypeptide forms functional channels. The latter point was demonstrated in both Xenopus oocytes and COS cells (Figures 3 to 6). Whether the AKT2 gene also produces transcripts encoding the AKT3 polypeptide (Ketchum and Slayman, 1996) remains to be demonstrated. Based on the present data, our hypothesis is that AKT3 is an N-terminal truncated channel.
Expression of AKT2 in leaf major veins and in stem phloem tissues, as determined by in situ hybridization experiments, has been reported recently (Marten et al., 1999). Because ion channel expression is usually very low, a broader expression pattern was demonstrated by using the GUS reporter gene (Figure 2), a more sensitive means than in situ hybridization for detecting gene expression. AKT2 is expressed in vascular tissues of both source and sink organs, that is, in all leaf veins and in flowers and roots (expression was confirmed by RNA gel blot and RT-PCR analyses, respectively; Figure 1). Interestingly, the expression pattern is reminiscent of those of the Arabidopsis AHA3 H+-ATPase (DeWitt et al., 1991; DeWitt and Sussman, 1995) and AtSUC2 sucrose carrier (Truernit and Sauer, 1995). AHA3 is thought to be involved in membrane energization in phloem tissue. AtSUC2 could be involved in sucrose loading in source leaf phloem tissues. In sinks, AtSUC2 could be involved in phloem reloading (retrieval of “lost” sucrose) or, more likely, in phloem unloading (Truernit and Sauer, 1995).
AKT2 Displays Unique Functional Features
Until recently, voltage-gated channels of the so-called Shaker family could be sorted into two classes based on their gating mode, with the first class gathering depolarization-activated channels (closed at hyperpolarized membrane voltages and outwardly rectifying) and the second gathering hyperpolarization-activated channels (closed at depolarized membrane voltages and inwardly rectifying). The subfamily of plant Shaker channels to which AKT2 is structurally related, that is, those containing ankyrin repeats in the C-terminal cytoplasmic domain, has members within each of these two gating groups in Arabidopsis: SKOR in the first group (Gaymard et al., 1998) and AKT1 in the second (Gaymard et al., 1996). This illustrates that opposite functional features can indeed be supported by similar structures in this K+ channel family. The weak rectification shown here for AKT2 has not been described previously for an animal or a plant channel of the Shaker family. With AKT2, a new type of Shaker channel needs to be considered. This channel type would be characterized by a weak inward rectification with biphasic activation kinetics, combining a time-independent leak-like current and a time-dependent voltage-activated current (appearing at voltage values more negative than −50 mV). The other channels characterized to date that mediate leak-like currents are animal channels structurally different from Shaker channels, belonging to the TWIK or KIR families (Lesage et al., 1996; Jan and Jan, 1997). Therefore, the plant Shaker-like family may provide an exciting model for elucidating the structure–function relationship of voltage-gated channels.
Extracellular acidification has been reported to stimulate inward K+ channel activity in a homologous context in fava bean guard cells (Blatt, 1992). In heterologous expression systems, the acidification of internal or external medium has been shown to increase the current through the plant inward K+ channels for which genes have been cloned thus far. This stimulation essentially results from a shift of the voltage-dependent gating threshold toward less negative voltages (Hoshi, 1995; Hoth et al., 1997; Hoth and Hedrich, 1999). In comparison with these channels, a striking feature of AKT2 is an opposite pH sensitivity, the macroscopic current being inhibited by acidification of either the internal or the external medium. Even though one must be cautious in extrapolating features displayed in heterologous contexts (Figures 5 and 6) to the homologous context (Dreyer et al., 1999), we propose that pH is a strong modulator of the AKT2 channel activity in the plant. Indeed, low apoplastic pH should dramatically downregulate AKT2 activity, and even small physiologic cytosolic pH variations should substantially affect the rectification properties of AKT2.
Functional Comparison with the AKT3 Channel
In potassium channels, the N-terminal region is an important structural element that can play a role, for example, in regulation by voltage (Marten and Hoshi, 1997, 1998) or by pH (Doi et al., 1996; Qu et al., 1999) or in interactions with regulatory subunits (Sewing et al., 1996; Reimann et al., 1999). If, as hypothesized, AKT3 is a mutant channel with a truncated N terminus, perhaps the functional features previously reported for AKT3 (Ketchum and Slayman, 1996; Marten et al., 1999) provide a distorted view, not taking into account the roles that the polypeptide N terminus could play within the functional channel. On the other hand, and interestingly, comparing the functional properties of AKT2 and AKT3 might provide clues regarding the roles of the AKT2 N terminus.
Injection of AKT3 cRNA into Xenopus oocytes revealed that the encoded polypeptides formed functional K+-selective channels (Ketchum and Slayman, 1996; Marten et al., 1999). The macroscopic current traces shown in these reports clearly display two components, an instantaneous leak-like current and a time-dependent one, which is reminiscent of AKT2 current traces. Hence, one can deduce that the truncated N-terminal sequence plays no role in AKT2 gating properties. On the other hand, whereas external acidification has similar effects on the instantaneous and time-dependent components of AKT3 current (Marten et al., 1999), the data shown in Figures 5 and 6 clearly indicate that the two AKT2 current components differ in their sensitivity to external pH. This discrepancy indicates that the N-terminal sequence truncated in AKT3 plays a role in the sensitivity of the channel to pH.
AKT2 Functional Properties Are Reminiscent of Those of a Mesophyll K+ Channel
Patch–clamp recordings on Arabidopsis leaf mesophyll protoplasts have identified a K+-selective channel, called PKC1, open at all potentials, with a single-channel conductance of 44 pS at a membrane voltage of −65 mV in 220 and 50 mM K+ (bath and pipette, respectively) (Spalding et al., 1992; Spalding and Goldsmith, 1993). Considering that different ionic solutions were used, the open-channel I/V curves obtained for PKC1 are similar to those obtained for AKT2 (Figure 3F), supporting the hypothesis that AKT2 or a channel with similar functional properties is expressed in mesophyll cells. The staining observed in the mesophyll cells of the plant expressing the AKT2/GUS construct was faint (Figure 2A), suggesting a low expression of AKT2. This is in agreement with the report by Romano et al. (1998) that indicated the inward K+ channel activity in Arabidopsis mesophyll cells was both low and detectable in only 50% of the protoplasts.
Expression and Role of AKT2 in Vascular Tissues
Integration of K+ fluxes at the whole plant level is thought to involve three key steps: uptake from the soil, translocation into the xylem sap toward the shoots, and redistribution within the plant via the phloem sap (Kochian and Lucas, 1988; De Boer, 1999). This redistribution includes a downward flux of K+ ions from the shoots to the roots, which can be greater than the flux of ions taken up by the root from the soil solution (Touraine et al., 1988; Wolf et al., 1991). This K+ recirculation is thought to act as a signal that regulates both K+ secretion into the root xylem sap and ultimately, by feedback mechanisms, K+ uptake from the soil (Drew and Saker, 1984; Marschner et al., 1996).
The expression pattern of the AKT2 gene suggests that the encoded channel either exerts some function common to the phloem tissues of both source and sink organs or has the functional plasticity necessary to fulfill different functions in sources and sinks, as the sucrose carrier AtSUC2 has been suggested to do (Truernit and Sauer, 1995). Because electrophysiological analyses indicate that AKT2 is weakly rectifying and able to mediate both influx and efflux of K+, we favor the latter hypothesis and suggest that AKT2 is involved in both K+ loading in sources and K+ unloading in sinks, as discussed below.
K+ influx through the plasma membrane of phloem cells at loading sites must be high, because the K+ concentration is >100 mM in the phloem sap, and the mass flow has a linear velocity as great as 10 to 20 mm min−1 (Patrick, 1997). This supports the hypothesis that K+ loading flux is mediated by channels. AKT2 could mediate K+ uptake in the source leaf phloem, sustained by hyperpolarizing H+-ATPase activity (DeWitt and Sussman, 1995). In Arabidopsis root, phloem unloading of a fluorescent nonpermeant probe has been demonstrated to be symplastic in the root elongation zone (500-μm apical region) (Oparka et al., 1994). Because no leak of the probe from the phloem was observed in the region basal to this zone, we concluded that solutes are delivered by the phloem to mature root tissues through specialized membrane transport systems. In these regions, AKT2 expression was associated with the two phloem poles (Figure 2H). As a weakly rectifying channel, it could mediate K+ release, accompanied by anion efflux.
The demonstration by Fromm and Eschrich (1989) that both K+ influx and efflux systems are expressed and functional within a single sieve element supports the hypothesis that both K+ loading and unloading could be mediated by the same channel. Such a demonstration has been obtained by induction of local sink conditions in source leaves by inhibiting photosynthesis (darkness and lack of CO2). This resulted in an immediate increase in K+ concentration in the sieve tube sap, rapidly followed by a decrease to a steady state value, which was reached within a few minutes and was lower than was the initial value before the switch from source to sink (Fromm and Eschrich, 1989). In addition, these changes in K+ concentration into the phloem sap were accompanied, with closely related kinetics, by changes in sieve tube membrane potential: an immediate hyperpolarization, followed by depolarization toward a value less negative than the initial one before the switch from source to sink.
Therefore, the whole set of data is consistent with the hypothesis that the same system mediates both K+ uptake and release, depending on the value of the K+ electrochemical gradient. As a weakly rectifying K+ channel, active in a wide membrane potential range, AKT2 could be such a system. In sources, K+ supply by the xylem sap would increase the apoplasmic concentration, favoring K+ loading in the phloem sap. In the sinks, continuous K+ retrieval by surrounding cells would decrease the apoplasmic concentration, favoring K+ release from the phloem sap. Besides this thermodynamic control by K+ apoplasmic concentration, kinetic regulation of AKT2-mediated loading/unloading could rely on several functional features of this channel, such as its sensitivity to internal pH (Figure 5), because the phloem sap pH is ∼0.4 to 0.6 pH unit more alkaline at the loading than at the unloading sites (Vreugdenhil and Koot-Gronsveld, 1989). This difference in cytosolic pH would make the channel more active in sources than in sinks. Other features, such as the sensitivity to external pH (see above) or Ca2+ (this work; for the AKT3 channel, see Marten et al., 1999), could also be involved in kinetic regulation of AKT2 activity.
In the stem, AKT2 is expressed in both phloem and xylem tissues. It could therefore be one of the transport systems involved in K+ exchanges between phloem and xylem sap, which are known to control the ionic composition of the xylem sap that reaches young leaves (Jeschke and Stelter, 1976).
Finally, the effect of ABA on AKT2 transcript level (Figure 1C) supports the hypothesis that upregulation of AKT2 expression could be involved in the plant response to drought by favoring K+ recirculation toward the root. Root growth under conditions of low soil water content requires osmotic adjustment in the growing extremities to maintain a high turgor. The largest part of the adjustment is achieved by increased K+ contents (Sharp et al., 1990). ABA-induced upregulation of AKT2 expression (Figure 1C) and downregulation of SKOR expression (Gaymard et al., 1998) could be key events in the plant response to drought.
In conclusion, from the present results, two main characteristics of AKT2 can be underlined: AKT2 is predominantly expressed in vascular tissues of both source and sink organs, and it is capable of mediating both influx and efflux of K+. Taken together, our results support the view that AKT2 is involved in K+ transport in phloem tissues, playing a role in both K+ loading in sources and unloading in sinks. With the identification of AKT1, SKOR, and AKT2, molecular tools are now available to study regulation of K+ transport in whole plants and responses to hormonal and environmental signals.
METHODS
AKT2 cDNA Cloning
The 5′ region of AKT2 cDNA (Figure 1D; GenBank/EMBL accession number AJ243703) was determined by nested polymerase chain reaction (PCR) with an Arabidopsis thaliana cDNA library (Minet et al., 1992), with two primers hybridizing with the vector (pFL61) and two primers hybridizing with the second exon of AKT2 (primer A, 5′-GGGTAAACCCACGCAGAGTATG-3′; and primer B, 5′-GCACCATATAAAATTCCCAGC-3′). Comparison of the amplified fragment sequence with that of genomic clones previously identified (Cao et al., 1995; Ketchum and Slayman, 1996) and with that of AKT3 cDNA indicated that the first intron had been correctly spliced and confirmed that PCR had introduced no mutation. A similar experiment was performed by rapid amplification of cDNA 5′ ends (5′ RACE) with poly(A)+ RNA isolated from 14-day-old plantlet leaves. First-strand synthesis was conducted at 42°C for 1 hr with 1 μg of mRNA, 10 pmol of AKT2-specific primer hybridizing downstream from the sixth intron (5′-CCTCTCTTGGTGGTATATACTCAGCCTTC-3′), and 200 units of Superscript II (Life Technologies, Gaithersburg, MD).
Nested PCR were performed with primers A and B and with two primers hybridizing with the linker ligated at the 5′ end of the cDNA. Five randomly chosen PCR fragments were sequenced. The shortest was 56 bp shorter at its 5′ end than was the fragment isolated from the cDNA library, but it still contained the ATG codon previously indicated as the translational start site for the AKT2 cDNA (Cao et al., 1995) (Figure 1D). The longest fragment was 13 bp shorter at its 5′ end than the cDNA isolated from the cDNA library. This latter cDNA thus displays the longest 5′ region identified up to now for AKT2 transcripts.
The full-length AKT2 open reading frame (ORF) was then isolated from a cDNA library by PCR using a primer hybridizing at the ATG codon and containing an SpeI site (5′-ACTAGTATGGACCTCAAGTATTCAGCATC-3′) and a reverse primer hybridizing at the stop codon and containing a NotI site (5′-GCGGCCGCCTAAATTATCTTGTTTACGACAAAG-3′). The amplified fragment (2.4 kb) was cloned at the EcoRV site of pBluescript SK+ (Stratagene, La Jolla, CA) and sequenced. It is identical to the AKT2 ORF identified by Cao et al. (1995).
RNA Gel Blot and Reverse Transcription–PCR Experiments
Plants were grown in vitro in GA-7 Magenta boxes (Sigma), and abscisic acid (ABA) treatments were performed as previously described (Gaymard et al., 1998). Total RNA extraction and gel blot were performed as described by Lobréaux et al. (1992). Reverse transcription (RT)–PCR were performed with Superscript II (Life Technologies) and Extra-PolI (Eurobio, Les Ulis, France), respectively, following the manufacturers' recommendations.
Transgenic Plants and β-Glucuronidase Assay
The AKT2 promoter region was isolated from genomic DNA (ecotype Columbia) by PCR walking (Devic et al., 1997), using a reverse primer to introduce a unique NcoI site just upstream from the ATG codon (5′-CCATGGTATTTCTCCTGAACAAAGAAAATTTAGCAC-3′). A 1.5-kb fragment was isolated, cloned into pBluescript SK+, and sequenced. The construct was digested by KpnI and NcoI and introduced into pBI 320.X (R. Derose, Texas A & M University, College Station, TX; this plasmid bears a unique NcoI site at the initiation codon of the promoterless GUS–3′ nopaline synthase gene), leading to a translational fusion between the AKT2 promoter region and β-glucuronidase (GUS) coding sequence. This construct was digested by KpnI and SacI and introduced into pMOG.402 binary vector (H. Hoekema, MOGEN International, Leiden, The Netherlands). The resulting plasmid was introduced into Agrobacterium tumefaciens MP90 (Höfgen and Willmitzer, 1988). Arabidopsis (ecotype Columbia) was transformed with agrobacteria by the floral dip method (Clough and Bent, 1998). T1 seedlings were selected in vitro on half-strength Murashige and Skoog medium (Murashige and Skoog, 1962) supplemented with 1% sucrose, 0.7% agar, and 50 μg mL−1 kanamycin under the following conditions: 21 and 18°C for day and night temperatures, respectively, with a 16-hr photoperiod, 150 μmol of electrons m−2 sec−1. For the GUS assay, plants were cultivated either in vitro on the same medium and under the same conditions as described above or grown in a greenhouse on attapulgite-peat compost (Gaymard et al., 1998). GUS histochemical staining was performed according to Lagarde et al. (1996). Cross-sections of GUS-stained material were prepared with a microtome (LKB, Bromma, Sweden) from tissues embedded in hydroxyethyl methacrylate (Technovit 7100; Heraus-Kulzer GmBH, Wehrheim, Germany) and counterstained in purple with periodic acid Schiff reagents.
Expression in Xenopus Oocytes
The pBluescript SK+/AKT2 vector was digested by SpeI and NotI and cloned in pCI (a plasmid designed for protein expression in mammalian cells; Promega) between the NheI and NotI sites. The resulting construct was called pCI-AKT2. Mutagenesis (the second ATG of the AKT2 cDNA was changed to TTG) was performed by PCR using pBluescript SK+/AKT2 as template. All constructs were checked by sequencing.
Expression plasmid injection into Xenopus oocytes and two-electrode voltage–clamp experiments were performed as previously described (Véry et al., 1995). For patch–clamp experiments (cell-attached configuration; Hamill et al., 1981), devitellinized oocytes were placed in a bath solution containing 100 mM KCl, 2 mM MgCl2, and 5 mM Hepes-NaOH, pH 7.4. Pipettes were filled with the same solution. Currents were recorded by using a patch–clamp amplifier (model Axopatch 200-A; Axon Instruments, Foster City, CA). Data were filtered at 2 kHz and digitized at 10 kHz through a 1200 Digidata AC/DC converter using pClamp6 software (Axon Instruments). The single-channel data were subsequently filtered at 500 Hz and analyzed with WINASCD software (G. Droogmans, Laboratory of Physiology, Leuven, Belgium). As is the convention for cell-attached experiments, all data (voltage and current) were scaled by –1 before being displayed in Figure 4.
Intracellular pH Measurements
Intracellular pH was monitored by using pH-sensitive microelectrodes prepared and used as previously described (Lacombe et al., 2000). Briefly, the interior of the microelectrode was treated with N,N-dimethyltrimethylsilylamine vapor (Fluka, Buchs, Switzerland). A column of H+ cocktail (hydrogen ionophore II cocktail A; Fluka) ∼300 μm long was established at the tip of the microelectrode. The microelectrode was then back-filled with a solution of 300 mM KCl buffered with 10 mM Tris-Mes to pH 6.0. Only electrodes that showed linear slopes >55 mV/pH unit change over the calibration range and stable calibration before and after penetration were used. Signals were recorded with an electrometer (Axoprobe; Axon Instruments). On the basis of the calibration curve for the pH-sensitive microelectrodes, the oocyte internal pH was calculated from the difference between the potential of the pH-sensitive microelectrode and the membrane potential measured simultaneously with a 3 M KCl microelectrode.
Expression in COS Cells
The AKT2 coding sequence was introduced into pIRES-CD8 (Reyes et al., 1998), which is a pCI-derived vector that allows coexpression of the inserted sequence and of CD8 protein. The construct, designated pIRES-CD8-AKT2, was obtained as described above for pCI-AKT2. COS cells were plated at a density of 20,000 cells per 35-mm-diameter dishes. After 24 hr, the cells were transiently transfected with 1 μg of pIRES-CD8-AKT2 plasmid per dish. Transfected cells were detected 48 hr later with the anti–CD8 antibody-coated bead method (Jurman et al., 1994). For whole-cell and single-channel recordings (cell-attached configuration; Hamill et al., 1981), the pipette solution contained 150 mM KCl, 3 mM MgCl2, 5 mM EGTA, and 10 mM Hepes-NaOH, pH 7.2. The bath solution contained 150 mM KCl, 3 mM MgCl2, 1 mM CaCl2, and 10 mM Hepes-NaOH, pH 7.4. Single-channel current recordings and analysis were performed as described for recordings in Xenopus oocytes (see above).
Acknowledgments
We thank Drs. Eric Honoré and Amanda Patel for the gift of pCI-CD8 and pIRES-CD8 plasmids as well as for their help in COS cell handling. We are grateful to Drs. Claude Grignon, Nicole Grignon, and Isabel Lefevre for helpful comments and critical reading of the manuscript; to Dr. Claude Plassard for pH microelectrodes; and to Jossia Boucherez for expert technical assistance. This work was supported in part by the European Community BIOTECH Program (BIO4-CT96) and Rhône-Poulenc.
References
- Barhanin, J., Lesage, F., Guillemare, E., Fink, M., Lazdunski, M., and Romey, G. (1996). KvLQT1 and IsK (MinK) proteins associate to form the IKs cardiac potassium current. Nature 384, 78–83. [DOI] [PubMed] [Google Scholar]
- Blatt, M.R. (1992). K+channels of stomatal guard cells: Characteristics of the inward rectifier and its control by pH. J. Gen. Physiol. 99, 615–644. [DOI] [PMC free article] [PubMed] [Google Scholar]
- Cao, Y., Ward, J.M., Kelly, W.B., Ichida, A.M., Gaber, R.F., Anderson, J.A., Uozumi, N., Schroeder, J.I., and Crawford, N.M. (1995). Multiple genes, tissue specificity, and expression-dependent modulation contribute to functional diversity of potassium channels in Arabidopsis thaliana. Plant Physiol. 109, 1093–1106. [DOI] [PMC free article] [PubMed] [Google Scholar]
- Clough, S.J., and Bent, A.F. (1998). Floral dip: A simplified method for Agrobacterium-mediated transformation of Arabidopsis thaliana. Plant J. 16, 735–743. [DOI] [PubMed] [Google Scholar]
- Daram, P., Urbach, S., Gaymard, F., Sentenac, H., and Chérel, I. (1997). Tetramerization of the AKT1 plant potassium channel involves its C-terminal cytoplasmic domain. EMBO J. 16, 3455–3463. [DOI] [PMC free article] [PubMed] [Google Scholar]
- De Boer, A.H. (1999). Potassium translocation into the root xylem. Plant Biol. 1, 36–45. [Google Scholar]
- Devic, M., Albert, S., Delseny, M., and Roscoe, T.J. (1997). Efficient PCR walking on plant genomic DNA. Plant Physiol. Biochem. 35, 331–339. [Google Scholar]
- DeWitt, N.D., and Sussman, M.R. (1995). Immunocytological localization of an epitope-tagged plasma membrane proton pump H+ ATPase in phloem companion cells. Plant Cell 7, 2035–2067. [DOI] [PMC free article] [PubMed] [Google Scholar]
- DeWitt, N.D., Harper, J.F., and Sussman, M.R. (1991). Evidence for a plasma membrane proton pump in the phloem cells of higher plants. Plant J. 1, 121–128. [DOI] [PubMed] [Google Scholar]
- Doi, T., Fakler, B., Schultz, J.H., Schulte, U., Brändle, U., Weidemann, S., Zenner, H.P., Lang, F., and Ruppersberg, J.P. (1996). Extracellular K+ and intracellular pH allosterically regulate renal Kir1.1 channels. J. Biol. Chem. 271, 17261–17266. [DOI] [PubMed] [Google Scholar]
- Drew, M.C., and Saker, L.R. (1984). Uptake and long-distance transport of phosphate, potassium and chloride in relation to internal ion concentrations in barley: Evidence for a non-allosteric regulation. Planta 160, 500–507. [DOI] [PubMed] [Google Scholar]
- Dreyer, I., Horeau, C., Lemaillet, G., Zimmermann, S., Bush, D.R., Rodriguez-Navarro, A., Schachtman, D.P., Spalding, E.P., Sentenac, H., and Gaber, R.F. (1999). Identification and characterization of plant transporters using heterologous expression systems. J. Exp. Bot. 50, 1073–1087. [Google Scholar]
- Dynan, W.S. (1986). Promoters for housekeeping genes. Trends Genet. 2, 196–197. [Google Scholar]
- Fink, M., Lesage, F., Duprat, F., Heurteaux, C., Reyes, R., Fosset, M., and Lazdunski, M. (1998). A neuronal two P domain K+ channel stimulated by arachidonic acid and polyunsaturated fatty acids. EMBO J. 17, 3297–3308. [DOI] [PMC free article] [PubMed] [Google Scholar]
- Fischer, D.B. (1987). Changes in the concentration and composition of peduncle sieve tube sap during grain filling in normal and phosphate-deficient wheat plants. Aust. J. Plant Physiol. 14, 147–156. [Google Scholar]
- Fromm, J., and Eschrich, W. (1989). Correlation of ionic movements with phloem unloading and loading in barley leaves. Plant Physiol. Biochem. 27, 577–585. [Google Scholar]
- Gaymard, F., Cerutti, M., Horeau, C., Lemaillet, G., Urbach, S., Ravallec, M., Devauchelle, G., Sentenac, H., and Thibaud, J.B. (1996). The baculovirus/insect cell system as an alternative to Xenopus oocytes: First characterization of the AKT1 K+ channel from Arabidopsis thaliana. J. Biol. Chem. 271, 22863–22870. [DOI] [PubMed] [Google Scholar]
- Gaymard, F., Pilot, G., Lacombe, B., Bouchez, D., Bruneau, D., Boucherez, J., Michaux-Ferriere, N., Thibaud, J.B., and Sentenac, H. (1998). Identification and disruption of a plant Shaker-like outward channel involved in K+ release into the xylem sap. Cell 94, 647–655. [DOI] [PubMed] [Google Scholar]
- Hamill, O.P., Marty, A., Neher, E., Sakmann, B., and Sigworth, F.J. (1981). Improved patch-clamp techniques for high-resolution current recording from cells and cell-free membrane patches. Pflugers Arch. 391, 85–100. [DOI] [PubMed] [Google Scholar]
- Hayashi, H., and Chino, M. (1990). Chemical composition of phloem sap from the uppermost internode of the rice plant. Plant Cell Physiol. 31, 247–251. [Google Scholar]
- Hirsch, R.E., Lewis, B.D., Spalding, E.P., and Sussman, M.R. (1998). A role for the AKT1 potassium channel in plant nutrition. Science 280, 918–921. [DOI] [PubMed] [Google Scholar]
- Höfgen, R., and Willmitzer, L. (1988). Storage of competent cells for Agrobacterium transformation. Nucleic Acids Res. 20, 9877. [DOI] [PMC free article] [PubMed] [Google Scholar]
- Honoré, E., Attali, B., Lesage, F., Barhanin, J., and Lazdunski, M. (1992). Receptor-mediated regulation of IsK, a very slowly activating, voltage-dependent K+ channel in Xenopus oocytes. Biochem. Biophys. Res. Commun. 184, 1135–1141. [DOI] [PubMed] [Google Scholar]
- Hoshi, T. (1995). Regulation of voltage dependence of the KAT1 channel by intracellular factors. J. Gen. Physiol. 105, 309–328. [DOI] [PMC free article] [PubMed] [Google Scholar]
- Hoth, S., and Hedrich, R. (1999). Distinct molecular bases for pH sensitivity of the guard cell K+ channels KST1 and KAT1. J. Biol. Chem. 274, 11599–11603. [DOI] [PubMed] [Google Scholar]
- Hoth, S., Dreyer, I., Dietrich, P., Becker, D., Müller-Röber, B., and Heidrich, R. (1997). Molecular basis of plant-specific acid activation of K+ uptake channels. Proc. Natl. Acad. Sci. USA 94, 4806–4810. [DOI] [PMC free article] [PubMed] [Google Scholar]
- Jan, L.Y., and Jan, Y.N. (1997). Cloned potassium channels from eukaryotes and prokaryotes. Annu. Rev. Neurosci. 20, 91–123. [DOI] [PubMed] [Google Scholar]
- Jeschke, W.D., and Stelter, W. (1976). Measurement of longitudinal ion profiles in single roots of Hordeum and Atriplex by use of flameless atomic absorption spectroscopy. Planta 128, 107–112. [DOI] [PubMed] [Google Scholar]
- Joshi, C.P. (1987). An inspection of the domain between putative TATA box and translation start site in 79 plant genes. Nucleic Acids Res. 15, 6643–6653. [DOI] [PMC free article] [PubMed] [Google Scholar]
- Joshi, C.P., Zhou, H., Huang, X., and Chiang, V.L. (1997). Context sequences of translation initiation codon in plants. Plant Mol. Biol. 35, 993–1001. [DOI] [PubMed] [Google Scholar]
- Jurman, M.E., Boland, L.M., Liu, Y., and Yellen, G. (1994). Visual identification of individual transfected cells for electrophysiology using antibody-coated beads. BioTechniques 17, 876–881. [PubMed] [Google Scholar]
- Kammerloher, W., Fischer, U., Piechottka, G.P., and Schaffner, A.R. (1994). Water channels in the plant plasma membrane cloned by immunoselection from a mammalian expression system. Plant J. 6, 187–199. [DOI] [PubMed] [Google Scholar]
- Ketchum, K.A., and Slayman, C.W. (1996). Isolation of an ion channel gene from Arabidopsis thaliana using the H5 signature sequence from voltage-dependent K+ channels. FEBS Lett. 378, 19–26. [DOI] [PubMed] [Google Scholar]
- Kochian, L.V., and Lucas, W.J. (1988). Potassium transport in roots. Adv. Bot. Res. 15, 136–151. [Google Scholar]
- Kühn, C., Franceschi, V.R., Schulz, A., Lemoine, R., and Frommer, W.B. (1997). Macromolecular trafficking indicated by localization and turnover of sucrose transporters in enucleate sieve elements. Science 275, 1298–1300. [DOI] [PubMed] [Google Scholar]
- Kühn, C., Barker, L., Bürkle, L., and Frommer, W.B. (1999). Update on sucrose transport in higher plants. J. Exp. Bot. 50, 935–953. [Google Scholar]
- Lacombe, B., Pilot, G., Gaymard, F., Sentenac, H., and Thibaud, J.B. (2000). pH control of the plant outwardly rectifying potassium channel SKOR. FEBS Lett. 466, 351–354. [DOI] [PubMed] [Google Scholar]
- Lagarde, D., Basset, M., Lepetit, M., Conejero, G., Gaymard, F., Astruc, S., and Grignon, C. (1996). Tissue-specific expression of Arabidopsis AKT1 gene is consistent with a role in K+ nutrition. Plant J. 9, 195–203. [DOI] [PubMed] [Google Scholar]
- Lagrange, T., Franzetti, B., Axelos, M., Mache, R., and Lerbs-Mache, S. (1993). Structure and expression of the nuclear gene coding for the chloroplast ribosomal protein L21: Developmental regulation of a housekeeping gene by alternative promoters. Mol. Cell. Biol. 13, 2614–2622. [DOI] [PMC free article] [PubMed] [Google Scholar]
- Lang, A. (1983). Turgor-related translocation. Plant Cell Environ. 6, 683–689. [Google Scholar]
- Lesage, F., Guillemare, E., Fink, M., Duprat, F., Lazdunski, M., Romey, G., and Barhanin, J. (1996). TWIK-1, a ubiquitous human weakly inward rectifying K+ channel with a novel structure. EMBO J. 15, 1004–1011. [PMC free article] [PubMed] [Google Scholar]
- Lobréaux, S., Massenet, O., and Briat, J.F. (1992). Iron induces ferritin synthesis in maize plantlets. Plant Mol. Biol. 19, 563–575. [DOI] [PubMed] [Google Scholar]
- Mager, W.H. (1988). Control of ribosomal protein gene expression. Biochim. Biophys. Acta 949, 1–15. [DOI] [PubMed] [Google Scholar]
- Marschner, H., Kirkby, E.A., and Cakmak, I. (1996). Effect of mineral nutritional status on shoot–root partitioning of photoassimilates and cycling of mineral nutrients. J. Exp. Bot. 47, 1255–1263. [DOI] [PubMed] [Google Scholar]
- Marten, I., and Hoshi, T. (1997). Voltage-dependent gating characteristics of the K+ channel KAT1 depend on the N and C termini. Proc. Natl. Acad. Sci. USA 94, 3448–3453. [DOI] [PMC free article] [PubMed] [Google Scholar]
- Marten, I., and Hoshi, T. (1998). The N-terminus of the K channel KAT1 controls its voltage-dependent gating by altering the membrane electric field. Biophys. J. 74, 2953–2962. [DOI] [PMC free article] [PubMed] [Google Scholar]
- Marten, I., Hoth, S., Deeken, R., Ache, P., Ketchum, K.A., Hoshi, T., and Hedrich, R. (1999). AKT3, a phloem-localized K+ channel, is blocked by protons. Proc. Natl. Acad. Sci. USA 96, 7581–7586. [DOI] [PMC free article] [PubMed] [Google Scholar]
- Mengel, K., and Haeder, H.E. (1977). Effect of potassium supply on the rate of phloem sap exudation and the composition of phloem sap of Ricinus communis. Plant Physiol. 59, 282–284. [DOI] [PMC free article] [PubMed] [Google Scholar]
- Minet, M., Dufour, M.E., and Lacroute, F. (1992). Complementation of Saccharomyces cerevisiae auxotrophic mutants by Arabidopsis thaliana cDNAs. Plant J. 2, 417–422. [DOI] [PubMed] [Google Scholar]
- Murashige, T., and Skoog, F. (1962). A revised medium for rapid growth and bio-assays with tobacco tissue cultures. Physiol. Plant. 15, 473–497. [Google Scholar]
- Nairn, C.J., Winesett, L., and Ferl, R.J. (1988). Nucleotide sequence of an actin gene from Arabidopsis thaliana. Gene 65, 247–257. [DOI] [PubMed] [Google Scholar]
- Oparka, K.J., and Turgeon, R. (1999). Sieve elements and companion cells—Traffic control centers of the phloem. Plant Cell 11, 739–750. [DOI] [PMC free article] [PubMed] [Google Scholar]
- Oparka, K.J., Duckett, C.M., Prior, D.A.M., and Fischer, D.B. (1994). Real-time imaging of phloem unloading in the root tip of Arabidopsis. Plant J. 6, 759–766. [Google Scholar]
- Patrick, J.W. (1997). Phloem unloading: Sieve element unloading and post-sieve element transport. Annu. Rev. Plant Physiol. Plant Mol. Biol. 48, 191–222. [DOI] [PubMed] [Google Scholar]
- Qu, Z., Zhu, G., Yang, Z., Cui, N., Li, Y., Chanchevalap, S., Sulaiman, S., Haynie, H., and Jiang, C. (1999). Identification of a critical motif responsible for the gating of Kir2.3 channel by intracellular protons. J. Biol. Chem. 274, 13783–13789. [DOI] [PubMed] [Google Scholar]
- Reimann, F., Tucker, S.J., Proks, P., and Ashcroft, F.M. (1999). Involvement of the N terminus of Kir6.2 in coupling to the sulphonylurea receptor. J. Physiol. 518, 325–336. [DOI] [PMC free article] [PubMed] [Google Scholar]
- Rentsch, D., and Frommer, W.B. (1996). Molecular approaches towards an understanding of loading and unloading of assimilates in higher plants. J. Exp. Bot. 47, 1199–1204. [DOI] [PubMed] [Google Scholar]
- Reyes, R., Duprat, F., Lesage, F., Fink, M., Salinas, M., Farman, N., and Lazdunski, M. (1998). Cloning and expression of a novel pH-sensitive two-pore domain K+ channel from human kidney. J. Biol. Chem. 273, 30863–30869. [DOI] [PubMed] [Google Scholar]
- Riesmeier, J.W., Willmitzer, L., and Frommer, W.B. (1994). Evidence for an essential role of the sucrose transporter in phloem loading and assimilate partitioning. EMBO J. 13, 1–7. [DOI] [PMC free article] [PubMed] [Google Scholar]
- Romano, L.A., Miedema, H., and Assmann, S.M. (1998). Ca2+ permeable, outwardly rectifying K+ channels in mesophyll cells of Arabidopsis thaliana. Plant Cell Physiol. 39, 1133–1144. [DOI] [PubMed] [Google Scholar]
- Roos, A., and Boron, W.F. (1981). Intracellular pH. Physiol. Rev. 61, 296–433. [DOI] [PubMed] [Google Scholar]
- Schroeder, J.I., Ward, J.M., and Gassmann, W. (1994). Perspective on the physiology and structure of inward-rectifying K+ channels in higher plants: Biophysical implications for K+ uptake. Annu. Rev. Biophys. Biomol. Struct. 23, 441–471. [DOI] [PubMed] [Google Scholar]
- Sewing, S., Roeper, J., and Pongs, O. (1996). Kvb1 subunit binding specific for Shaker-related potassium channel a subunits. Neuron 16, 455–463. [DOI] [PubMed] [Google Scholar]
- Sharp, R.E., Hsiao, T.C., and Silk, W.K. (1990). Growth of the maize primary root at low water potentials. II. Role of growth and deposition of hexose and potassium in osmotic adjustment. Plant Physiol. 93, 1337–1346. [DOI] [PMC free article] [PubMed] [Google Scholar]
- Sjölund, R.D. (1997). The phloem sieve element: A river runs through it. Plant Cell 9, 1137–1146. [DOI] [PMC free article] [PubMed] [Google Scholar]
- Sonnewald, U., and Willmitzer, L. (1992). Molecular approaches to sink–source interactions. Plant Physiol. 99, 1267–1270. [DOI] [PMC free article] [PubMed] [Google Scholar]
- Soreq, H., and Seidman, S. (1992). Xenopus oocyte microinjection: From genes to protein. Methods Enzymol. 207, 225–266. [DOI] [PubMed] [Google Scholar]
- Spalding, E.P., and Goldsmith, M.H.M. (1993). Activation of K+ channels in the plasma membrane of Arabidopsis by ATP produced photosynthetically. Plant Cell 5, 477–484. [DOI] [PMC free article] [PubMed] [Google Scholar]
- Spalding, E.P., Slayman, C.L., Goldsmith, M.H.M., Gradmann, D., and Bertl, A. (1992). Ion channels in Arabidopsis plasma membrane: Transport characteristics and involvement in light-induced voltage changes. Plant Physiol. 99, 96–102. [DOI] [PMC free article] [PubMed] [Google Scholar]
- Touraine, B., Grignon, N., and Grignon, C. (1988). Charge balance in NO3 fed soybean: Estimation of K+ and carboxylate recirculation. Plant Physiol. 88, 605–612. [DOI] [PMC free article] [PubMed] [Google Scholar]
- Truernit, E., and Sauer, N. (1995). The promoter of the Arabidopsis thaliana SUC2 sucrose-H+ symporter gene directs expression of glucuronidase to the phloem: Evidence for phloem loading by SUC2. Planta 196, 564–570. [DOI] [PubMed] [Google Scholar]
- Tsai, T.D., Shuck, M.E., Thompson, D.P., Bienkowski, M.J., and Lee, K.S. (1995). Intracellular H+ inhibits a cloned rat kidney outer medulla channel expressed in Xenopus oocytes. Am. J. Physiol. 268, C1173–C1178. [DOI] [PubMed] [Google Scholar]
- Uozumi, N., Nakamura, T., Schroeder, J.I., and Muto, S. (1998). Determination of transmembrane topology of an inward-rectifying potassium channel from Arabidopsis thaliana based on functional expression in Escherichia coli. Proc. Natl. Acad. Sci. USA 95, 9773–9778. [DOI] [PMC free article] [PubMed] [Google Scholar]
- Véry, A.A., Gaymard, F., Bosseux, C., Sentenac, H., and Thibaud, J.B. (1995). Expression of a cloned plant K+ channel in Xenopus oocytes: Analyses of macroscopic currents. Plant J. 7, 321–332. [DOI] [PubMed] [Google Scholar]
- Vreugdenhil, D. (1985). Source-to-sink gradient of potassium in the phloem. Planta 163, 238–240. [DOI] [PubMed] [Google Scholar]
- Vreugdenhil, D., and Koot-Gronsveld, E.A.M. (1989). Measurements of pH, sucrose and potassium ions in the phloem sap of castor bean (Ricinus communis) plants. Physiol. Plant. 77, 385–388. [Google Scholar]
- Wolf, O., Munns, R., Tonnet, M.L., and Jeschke, W.D. (1991). The role of the stem in the partitioning of Na+ and K+ in salt-tolerant barley. J. Exp. Bot. 42, 697–704. [Google Scholar]