Abstract
Ca2+-ATPases are key regulators of Ca2+ ion efflux in all eukaryotes. Animal cells have two distinct families of Ca2+ pumps, with calmodulin-stimulated pumps (type IIB pumps) found exclusively at the plasma membrane. In plants, no equivalent type IIB pump located at the plasma membrane has been identified at the molecular level, although related isoforms have been identified in non–plasma membrane locations. Here, we identify a plant cDNA, designated SCA1 (for soybean Ca2+-ATPase 1), that encodes Ca2+-ATPase and is located at the plasma membrane. The plasma membrane localization was determined by sucrose gradient and aqueous two-phase membrane fractionations and was confirmed by the localization of SCA1p tagged with a green fluorescent protein. The Ca2+-ATPase activity of the SCA1p was increased approximately sixfold by calmodulin (K1/2 ∼10 nM). Two calmodulin binding sequences were identified in the N-terminal domain. An N-terminal truncation mutant that deletes sequence through the two calmodulin binding sites was able to complement a yeast mutant (K616) that was deficient in two endogenous Ca2+ pumps. Our results indicate that SCA1p is structurally distinct from the plasma membrane–localized Ca2+ pump in animal cells, belonging instead to a novel family of plant type IIB pumps found in multiple subcellular locations. In plant cells from soybean, expression of this plasma membrane pump was highly and rapidly induced by salt (NaCl) stress and a fungal elicitor but not by osmotic stress.
INTRODUCTION
Ca2+ plays a central role as a second messenger in signal transduction of all eukaryotes (Bootman and Berrige, 1995; Clapham, 1995). The transient increase of cytosolic free Ca2+ concentration, [Ca2+]cyt, is correlated with a variety of external signals such as touch, temperature shift, abscisic acid, auxin, red light, fungal elicitors, salinity/drought, anoxia, gravity, gibberellic acid, cytokinin, oxidative stress, and hypoxia (Bush, 1995; Sanders et al., 1999). In turn, the increased [Ca2+]cyt triggers many signal transduction pathways, including the regulation of enzyme activity, ion channel activity, and gene expression, which results in diverse cellular responses (Bush, 1995). In addition to its role as a second messenger, Ca2+ also is important in regulating the processing of proteins in secretory pathways (Rudolph et al., 1989). Thus, cells require carefully regulated transport systems to control [Ca2+] in the cytoplasm and endomembrane compartments. Influx of Ca2+ to the cytosol occurs as a “downhill” transport through Ca2+ channels (Sanders et al., 1999). In contrast, the efflux of Ca2+ from the cytosol is mediated by two active Ca2+ transporters—Ca2+ pumps and Ca2+/H+ antiporters—which are powered by ATP hydrolysis and proton motive force, respectively (Bush, 1995). In plants, Ca2+-ATPases are believed to be a major Ca2+ transporter for the endoplasmic reticulum (ER), Golgi apparatus, vacuole, plastid inner membrane, and plasma membrane (Sanders et al., 1999).
Plant and animal cells utilize two distinct types of Ca2+ pumps, identified as type IIA and type IIB, based on their protein sequences (Axelson and Palmgren, 1998). Type IIA Ca2+ pumps include sarcoplasmic reticulum–type or ER-type Ca2+-ATPases. None of these pumps appears to be directly activated by calmodulin. Evidence suggests that members of this family in plants may be located at the tonoplast and plasma membrane (Ferrol and Bennett, 1996; Hwang et al., 1997) as well as at the ER (Liang et al., 1997).
Type IIB Ca2+ pumps include the plasma membrane–type Ca2+-ATPases, first characterized in animals (Carafoli, 1994), and a subgroup of novel Ca2+ pumps recently identified in plants, including ACA2p (Harper et al., 1998), which was identified from the model plant system Arabidopsis, and BCA1p (Malmstrom et al., 1997), identified from cauliflower. In contrast to type IIA Ca2+ pumps, type IIB Ca2+ pumps are stimulated by binding calmodulin.
Two features distinguish the currently known plant type IIB pumps from those found in animals. First, the plant isoforms have regulatory domains located at the N terminus instead of the C terminus of the pump and show little sequence identity to the regulatory domain of an animal pump. Second, unlike type IIB pumps from animals, which are thought to be located exclusively in the plasma membrane, the plant isoforms have been found only in non–plasma membrane locations, such as ACA2p in the ER membrane (Hong et al., 1999), BCA1p in the tonoplast (Malmstrom et al., 1997), and ACA1p, which is thought to reside in the chloroplast inner membrane (Huang et al., 1993). Despite the biochemical evidence for a calmodulin-regulated Ca2+-ATPase in the plant cell plasma membrane (Evans, 1994; Askerlund, 1997; Dainese et al., 1997; Hwang et al., 1997; Bonza et al., 1998), the corresponding gene for this has not been cloned, and it is not known whether the anticipated pump is more similar to an animal type IIB pump or to the calmodulin-regulated pumps found in plant cell endomembranes.
In this article, we report the isolation and characterization of a gene, SCA1 (for soybean Ca2+-ATPase 1), encoding a calmodulin-regulated Ca2+-ATPase that is located at the plasma membrane in soybean cells. Both biochemical and genetic evidence demonstrate that SCA1p has an N-terminal calmodulin-regulated autoinhibitor. This indicates that SCA1p is structurally distinct from the analogous plasma membrane–localized Ca2+ pump in animal cells and belongs instead to a novel family of plant type IIB pumps previously found in non–plasma membrane locations. We also report that the expression of SCA1 mRNA is rapidly induced by salt (NaCl) stress or by a fungal elicitor but not by osmotic stresses, suggesting that the activity of this pump may be involved in the response to specific biotic and abiotic stresses.
RESULTS
Primary Structure of SCA1p
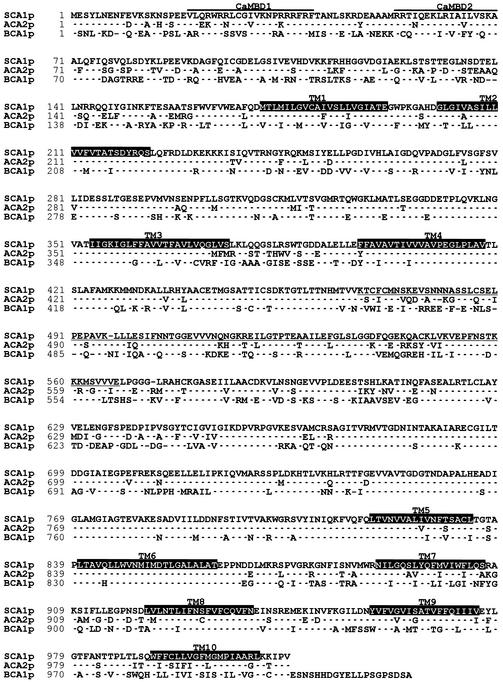
A full-length cDNA clone encoding a putative type IIB Ca2+-ATPase was isolated from a soybean hypocotyl cDNA library (Hong et al., 1995) by using a partial cDNA clone (F955) that encodes another putative Ca2+ pump from Brassica (Lim et al., 1996). For this gene, named SCA1, the cDNA sequence showed an open reading frame of 3042 bp that encodes a polypeptide (SCA1p) with a molecular mass of 110.4 kD (Figure 1). Ten transmembrane domains were predicted by hydropathy analysis and comparisons with other P-type ATPases. This predicted topology suggested that SCA1p has a long N-terminal regulatory domain similar to other type IIB pumps in plants. Overall, SCA1p showed the greatest sequence identity to the plant type IIB Ca2+-ATPases ACA2p (80%) and ACA1p (78%) from Arabidopsis and BCA1p (63%) from Brassica (Figure 1). In contrast, SCA1p showed only 45% identity to a typical mammalian plasma membrane–type Ca2+-ATPase and even less identity (<30%) to typical ER-type (type IIA) Ca2+-ATPases, such as ECA1p from Arabidopsis (Liang et al., 1997) or SERCA1p from rabbit (Brandl et al., 1986).
Figure 1.
Amino Acid Sequence Alignment Showing a High Degree of Identity between SCA1p, ACA2p, and BCA1p.
SCA1p, ACA2p (Harper et al., 1998), and BCA1p (Malmstrom et al., 1997) are identical to gene products of SCA1 (GenBank accession number AF195028), ACA2 (GenBank accession number AF025842), and BCA1 (EMBL accession number X99972), respectively. Identical residues are indicated with dots. Dashes indicate the absence of residues. Ten transmembrane domains (TM1 to TM10) were predicted by a transmembrane prediction program (ExPASy Web server; http://www.expasy.ch/tools/) based on hydropathy plot and are indicated by white letters on a black background. Two predicted calmodulin binding sequences are indicated by lines above the sequences and marked as CaMBD1 and CaMBD2. The sequence used as an antigen to generate an anti-SCA1p antibody is underlined.
Tissue-Specific Expression of SCA1 mRNA
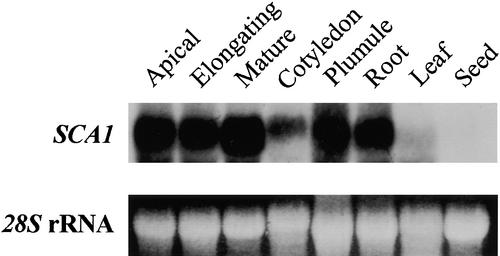
To determine whether SCA1 has tissue-specific expression, we subjected the RNA isolated from various soybean tissues to RNA gel blot analysis. The transcript was highly abundant in apical hypocotyl, elongating hypocotyl, mature hypocotyl, plumule, and root tissues and much less abundant in cotyledon and leaf tissues (Figure 2). The message was almost undetectable in immature seeds.
Figure 2.
SCA1 Is Expressed in Many Parts of the Soybean Plant.
Each lane was loaded with 20 μg of total RNA isolated from tissues of soybean seedling or whole plant. The resulting gel blots were probed with a 32P-labeled SCA1 gene–specific probe, washed at high stringency at 60°C in 0.1 × SSC (1 × SSC is 0.15 M NaCl and 0.015 M sodium citrate), and exposed to x-ray film at −80°C for 1 day. The 28S rRNA band stained with ethidium bromide also is shown to verify that similar amounts of RNA were loaded per lane. Apical, apical hypocotyl; Elongating, elongating hypocotyl; Mature, mature hypocotyl; Seed, immature seed.
SCA1p Is Located at the Plasma Membrane
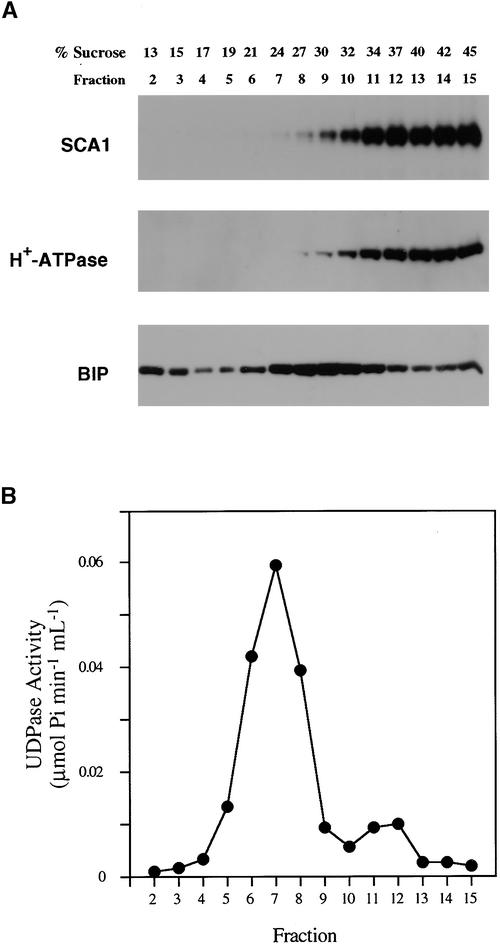
To determine the localization of SCA1p, we fractionated soybean microsomal membranes by using two procedures. First, centrifugation through a continuous sucrose gradient was used to compare the distribution of SCA1p with that of markers for the plasma membrane, ER, and Golgi. As shown in Figure 3, SCA1p was most abundant in fractions with sucrose content between 34 and 45%, similar to the H+-ATPase commonly used as a marker for the plasma membrane (DeWitt et al., 1996; Liang et al., 1997). In contrast, peak fractions containing an ER marker (homolog of the ER-residence immunoglobulin heavy chain binding protein [BIP]; Haas, 1994) or a Golgi marker (latent UDPase activity; Nagahashi and Kane, 1982) were found in lighter (less sucrose) fractions.
Figure 3.
SCA1p Cofractionates with a Plasma Membrane Marker in Sucrose Gradient Fractionation of Plant Membranes.
(A) Protein gel blot analyses of fractions after sucrose gradient fractionation of microsomal membrane from soybean. Soybean microsomal membranes were fractionated over continuous sucrose gradients of 15 to 45% (w/w), and 0.8-mL fractions were collected from the top of the gradients. Samples (10 μL) from each fraction were separated by 8% SDS-PAGE, transferred to an Immobilon-P membrane (Millipore), and probed with affinity-purified anti-SCA1p antibody (0.25 μg/mL), anti–H+-ATPase antibody (DeWitt et al., 1996; 1:5000 dilution), and anti-BIP antibody (Denecke et al., 1991; Hofte and Chrispeels, 1992; 1:3000 dilution). Bands were detected by electrochemiluminescence and exposed to x-ray film.
(B) Marker enzyme assay using 10 μL of samples from membrane fractions for Triton-stimulated UDPase activity as a Golgi marker (Nagahashi and Kane, 1982).
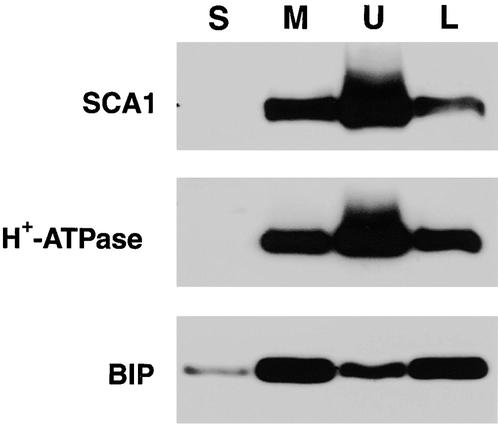
To corroborate a cofractionation of SCA1p with the plasma membrane, we used a second fractionation procedure to purify plasma membrane by an aqueous two-phase partitioning method (Figure 4). In this procedure, SCA1p was found to be enriched in the upper phase along with a plasma membrane marker (H+-ATPase), which is consistent with SCA1p being located at the plasma membrane. Controls indicated that endomembranes were fractionated to the lower phase, as indicated by the enrichment there of the ER marker (BIP) (Figure 4) and chlorophyll (not shown).
Figure 4.
SCA1p Cofractionates with a Plasma Membrane Marker in Aqueous Two-Phase Partitioning of Plant Membranes.
Total proteins from 2-day-old soybean seedlings were fractionated into the soluble fraction (S) and the total microsomal membranes (M). Total microsomal membranes were fractionated into an upper phase (U) and a lower phase (L), corresponding to plasma membrane and endomembrane-enriched fractions, respectively. Samples (10 μg) from each fraction were separated by 8% SDS-PAGE and transferred to Immobilon-P membranes. Parallel protein gel blot analyses were performed by the procedure described in Figure 3.
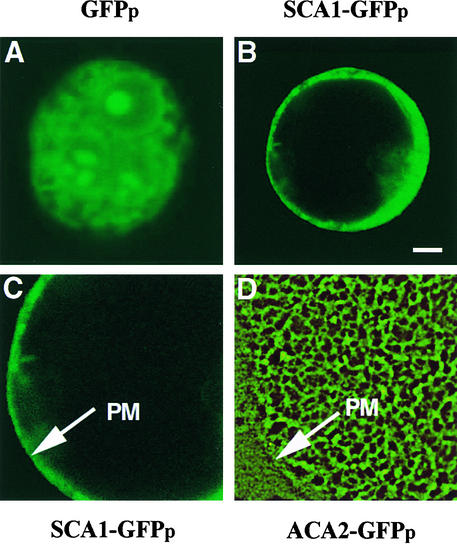
To provide cytological confirmation of the membrane fractionation result, we expressed a green fluorescent protein (GFP)–tagged version of SCA1p (encoded by construct p35S-SCA1-GFP) in tobacco protoplast (Watanabe et al., 1987), and the spatial distribution of the GFP fluorescence was observed by confocal laser scanning microscopy. Without optically sectioning the cells, we could see that the fluorescent signal appeared to cover the entire surface of the cell (data not shown). Optical sectioning through the center of the cell, however, verified that the fluorescent signal was localized to the cell periphery, consistent with a plasma membrane location (Figures 5B and 5C). This pattern was distinct from controls that showed non–plasma membrane locations such as a GFPp-tagged ER-localized pump (ACA2-GFPp; Hong et al., 1999) (Figure 5D) or a soluble GFPp (Figure 5A).
Figure 5.
Confocal Microscopy Showing a Plasma Membrane Location for SCA1p Tagged with GFPp.
(A) Confocal microscopy images of green fluorescence from protoplasts expressing a GFPp-only control.
(B) Optical sectioning microscopy image of green fluorescence from protoplasts expressing SCA1-GFPp.
(C) and (D) The fluorescence image of SCA1-GFPp (C) compared with that of ACA2-GFPp (D), which is located at the ER membrane (Hong et al., 1999). Fluorescence images of SCA1-GFPp and ACA2-GFPp in protoplasts were detected under the same conditions by optical sectioning microscopy. Arrows indicate plasma membrane (PM).
 .
.
The N-Terminal Domain Contains Two Calmodulin Binding Sequences
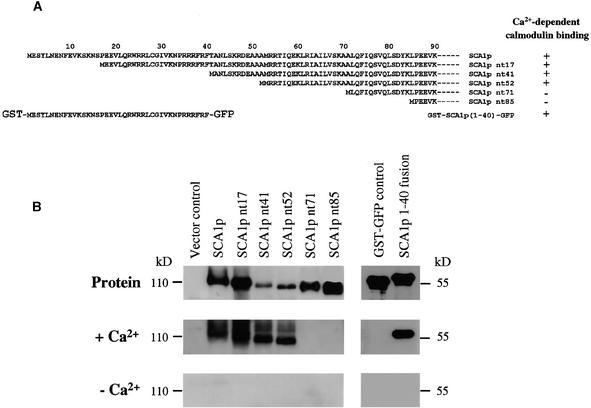
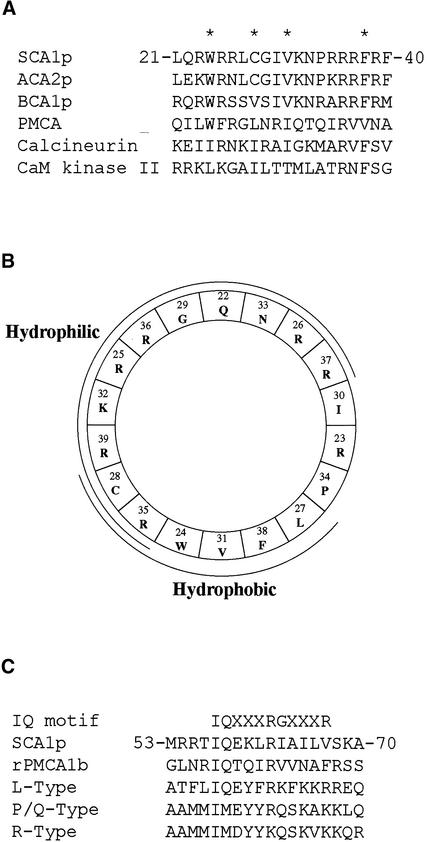
To determine whether a calmodulin binding sequence was present in the N-terminal domain, we produced a series of proteins truncated at their respective N termini in yeast and a fusion protein containing the first 40 N-terminal residues in Escherichia coli (Figure 6A). Calmodulin overlay assays were performed to test for calmodulin binding to these proteins. As shown in Figure 6B, soybean calmodulin-1 conjugated with horseradish peroxidase (HRP-SCaM-1; Lee et al., 1997, 1999) bound in a Ca2+-dependent manner to SCA1p, SCA1p nt17, SCA1p nt41, SCA1p nt52, and the fusion protein containing the N-terminal first 40 residues but did not bind to SCA1p nt71 and SCA1p nt85. (In the names of the mutant proteins, nt means N-terminal truncation, and the number indicates the number of truncated residues.) These results suggest that the N-terminal region of SCA1p contains two Ca2+-dependent calmodulin binding sequences, the first (CaMBD1) lying within the first 40 residues and the second (CaMBD2) between residues 52 and 71. Analysis of the sequence of the first 40 residues identified a likely candidate for CaMBD1 as a potential amphipathic basic helix, characteristic of a typical calmodulin binding domain (CaMBD) (Figures 7A and 7B). Most CaMBDs are stretches of 16 to 35 amino acids that show the segregation of having basic and polar residues on one side and hydrophobic amino acids on the others (James et al., 1995). An analysis of sequence downstream of position 52 revealed a potential modified IQ motif (Penniston and Enyedi, 1998), as shown in Figure 7C by the alignment of CaMBD2 with characterized modified IQ motifs that exhibit Ca2+-dependent binding with calmodulin.
Figure 6.
Calmodulin Overlay Assays Indicate Two Calmodulin Binding Sites in the N-Terminal Region of SCA1p.
(A) A schematic representation showing SCA1p pumps with N-terminal truncations and a fusion protein containing the first 40 residues. In N-terminal–truncated mutants, nt refers to the N-terminal truncation, and the numbers indicate the numbers of residues truncated from the N terminus. A glutathione S-transferase (GST)-SCA1p (1-40)–GFP fusion protein has the first 40 residues of SCA1p placed between a GST in the N terminus and a GFP in the C terminus. Ca2+-dependent calmodulin binding ability is indicated as + (calmodulin binding) or − (no calmodulin binding).
(B) Calmodulin overlay assays of SCA1p full-length and mutant pumps and a fusion protein containing the first 40 residues. Total microsomal membranes were isolated from yeasts expressing the full-length pump and five mutant pumps. Microsomal membranes were subjected to 8% SDS-PAGE and transferred to an Immobilon-P membrane. Fusion proteins were purified, subjected to 10% SDS-PAGE, and similarly transferred to an Immobilon-P membrane. The gel blots were probed with 12 nM HRP-SCaM-1 (Lee et al., 1997). At the top are protein gel blots of the SCA1p full-length and mutant pumps as detected by anti-SCA1p antibody and the fusion proteins detected by anti-GST antibody. In the center are the results of calmodulin overlay assays in the presence of 1 mM Ca2+ (+Ca2+). At the bottom are the results of calmodulin overlay assays in the presence of 5 mM EGTA (−Ca2+).
Figure 7.
Comparison of the Two Predicted Calmodulin Binding Domains (CaMBD1 and CaMBD2) with Motifs of Other Calmodulin Binding Proteins.
(A) Amino acid sequences of the first calmodulin binding domain (CaMBD1; 21 to 40 residues) were compared with other CaMBDs. Asterisks indicate the positions of SCA1p key residues Trp24, Cys28, Val31, and Phe38, which are believed to be important for binding to calmodulin. Conserved amino acid residues of CaMBD1 and other CaMBDs were aligned with these important positions. The other CaMBDs were ACA2p (Harper et al., 1998), BCA1p (Malmstrom et al., 1997), plasma membrane Ca2+ pump (PMCA; Kataoka et al., 1991), calcineurin (Kincaid et al., 1988), and calmodulin (CaM) kinase II (Meader et al., 1993).
(B) Amino acid residues 21 to 38 of SCA1p, plotted as an α-helical wheel. A basic hydrophilic face and a hydrophobic face are underlined with corresponding notes.
(C) A modified IQ motif of SCA1p (CaMBD2; 53 to 70 residues) aligned with other modified IQ motifs from rPMCA1b (Penniston and Enyedi, 1998), L-type Ca2+ channel (Zuhlke et al., 1999), P/Q-type Ca2+ channel, and R-type Ca2+ channel (Peterson et al., 1999). The consensus sequence for an IQ motif is shown at the top (Rhoads and Friedberg, 1997).
N-Terminal–Truncated Mutant Pump (SCA1p nt85) Complement Disruption of Yeast Ca2+ Pump
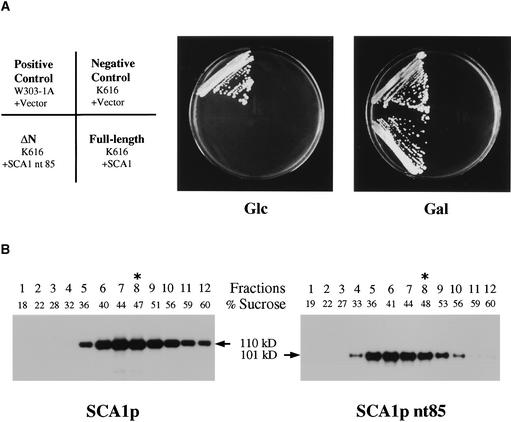
To determine if SCA1p functions as a Ca2+ pump in vivo, we expressed a wild-type (SCA1p) and an N-terminal–truncated mutant (SCA1 nt85) protein in a yeast strain (K616) harboring a disruption of three genes encoding proteins involved in Ca2+ homeostasis: PMR1p, PMC1p, and CNB1p (Cunningham and Fink, 1994). PMR1 and PMC1 encode Ca2+-ATPases in the vacuole and Golgi, respectively. CNB1 encodes the B subunit of calcineurin, protein phosphatase 2B, which regulates a H+/Ca2+ exchanger. Because of the disruption of the yeast Ca2+-ATPases, the K616 strain shows poor growth on Ca2+-depleted media (i.e., containing 10 mM EGTA). Both SCA1 and SCA1 nt85 cDNAs were cloned in a yeast expression vector, pYES2 (Invitrogen, Carlsbad, CA), to express proteins under the control of the galactose promoter. The constructs were introduced into K616, and the transformed yeasts were grown in Ca2+-depleted media containing glucose or galactose. As controls, the growth patterns of the wild type and of K616 transformed with the vector alone were compared. Only K616 expressing SCA1p nt85 was able to grow on 10 mM EGTA-galactose medium (Figure 8A). This result suggests that SCA1p nt85, an N-terminal–truncation mutant of SCA1p, functions as an active Ca2+-ATPase in yeast. To confirm the expression of SCA1p and SCA1p nt85, we fractionated microsomal membranes from yeasts over continuous sucrose gradients from 20 to 60%. Protein gel blot analyses of these gradients indicated that in yeast, SCA1p and SCA1p nt85 were most abundant in the endomembrane fractions rather than in the plasma membrane (Figure 8B).
Figure 8.
Complementation of Yeast Mutant K616 through Expression of SCA1p nt85.
(A) Complementation of yeast Ca2+-ATPases mutant by an N-terminal–truncated mutant pump (SCA1p nt85). Wild-type (W303-1A) and triple mutant (K616) cells were transformed with a vector (pYES2) alone, or with pYES2-SCA1 and pYES2-SCA1 nt85. The cells were streaked onto SC-URA plates containing 10 mM EGTA, pH 6.0, and either glucose (Glc) or galactose (Gal); the cells were incubated for 4 days at 30°C. A diagram indicates yeast strains and transformed vectors. Full-length and ΔN indicate SCA1p and SCA1p nt85, respectively.
(B) Sucrose gradient fractionation of SCA1p and SCA1p nt85. Microsomal membranes isolated from yeasts transformed with pYES2-SCA1 and pYES2-SCA1 nt85 were fractionated over a continuous sucrose gradient of 20 to 60% (w/w), and 1-mL fractions were collected from the top of each gradient. Samples (10 μL) from each gradient fraction were subjected to 8% SDS-PAGE and transferred to Immobilon-P membranes. The gel blots were probed with purified anti-SCA1 antibody. Immunoreactive bands were detected by electrochemiluminescence and exposure to x-ray film. Asterisks indicate the peak fractions for plasma membrane fractions, as determined by assays for vanadate-sensitive (calcium-independent) H+-ATPase activity.
SCA1p Has Ca2+/Calmodulin–Dependent Ca2+-ATPase Activity
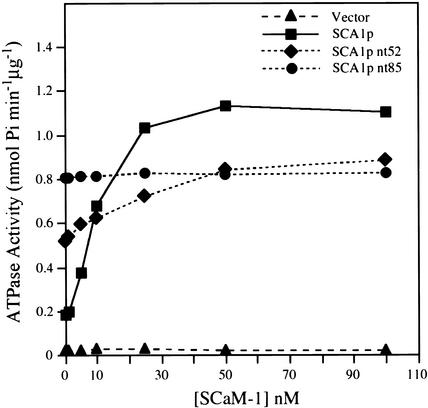
To determine the enzymatic activity of SCA1p as a Ca2+-ATPase, we produced the full-length enzyme (SCA1p) and N-terminal truncation mutant proteins (SCA1p nt52 and SCA1p nt85) in yeast. The mutant pumps, SCA1p nt52 and SCA1p nt85, have deletions of the first calmodulin binding domain (CaMBD1) or of both calmodulin binding domains (CaMBD1 and CaMBD2), respectively. These enzymes were partially purified as an endomembrane-enriched fraction obtained by sucrose gradient fractionation of total microsomal membranes (Figure 8B). Enzymes present in the lighter sucrose fractions (e.g., fraction 5) were used to avoid the high background H+-ATPase activity in the denser plasma membrane fractions. As a control, the equivalent fraction was analyzed from microsomal membranes from a yeast transformed with the vector only, pYES2, which were processed in parallel. To test these pumps for calmodulin-stimulated activity, we assayed samples from fraction 5 (∼36% sucrose) for ATPase activity with increasing concentrations of calmodulin at a relatively high, fixed concentration of Ca2+ (5 μM). To compare the specific activities of a full-length pump and two mutant pumps, we corrected each activity for expression level, as determined by a scanned protein gel blot probed with affinity-purified anti-SCA1p antibody.
In the absence of calmodulin, the basal activity of SCA1p was very low; the activity was stimulated approximately sixfold by calmodulin in a dose-dependent manner (Figure 9). In contrast, the specific activities of SCA1p nt52 and SCA1p nt85 were ∼280 and 440%, respectively, of the basal activity of SCA1p in the absence of calmodulin. SCA1p nt52 was further stimulated ∼1.7-fold by calmodulin, but neither SCA1p nt85 nor the vector control was. Calmodulin activated SCA1p and SCA1p nt52 half-maximally at ∼10 and 20 nM, respectively.
Figure 9.
Activation of SCA1p by Calmodulin.
Ca2+-dependent ATPase activity was determined in samples from gradient fraction 5. The vanadate-sensitive ATPase activities of vector control (triangles), SCA1p (squares), SCA1p nt52 (diamonds), and SCA1p nt85 (circles) were determined at 5 μM free [Ca2+]. The concentration of soybean calmodulin isoform 1 (SCaM-1; Lee et al., 1995) was varied from 0 to 100 nM. Data shown are the average of three independent experiments.
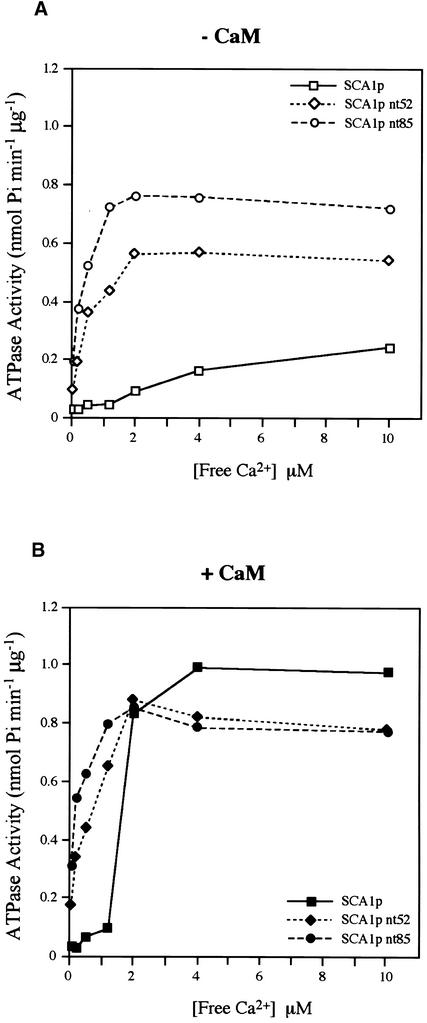
The Ca2+ dependence of these enzymes also was determined in the absence or presence of 100 nM calmodulin (Figures 10A and 10B). Samples from fraction 5 of each gradient were used for ATPase activity at different concentrations of free Ca2+. In the absence of calmodulin, SCA1p, SCA1p nt52, and SCA1p nt85 were half-maximally activated at ∼15, 0.6, and 0.2 to 0.3 μM free Ca2+, respectively. The equivalent fraction from the vector control had little ATPase activity (results not shown). When calmodulin was added, the K1/2 for Ca2+ of SCA1p was shifted from 15 to 1.5 μM. However, the K1/2 values for Ca2+ of SCA1p nt52 and SCA1p nt85 were not substantially affected.
Figure 10.
Ca2+-Dependent Activation of Full-Length and N-Terminal Deletion Pumps.
Vanadate-sensitive ATPase activities of SCA1p (squares), SCA1p nt52 (diamonds), and SCA1p nt85 (circles) were determined at different concentrations of free Ca2+. Free Ca2+ concentration was determined using fluo-3, pentapotassium salt, and the Calcium Calibration Concentrated Buffer Kit, according to the manufacturer's instructions (Molecular Probes). Representative data from one of three similar experiments are shown.
(A) ATPase activities measured in the absence of calmodulin (open symbols).
(B) ATPase activities measured in the presence of 100 nM SCaM-1 (filled symbols).
SCA1 Gene Expression Is Induced by Environmental Stresses
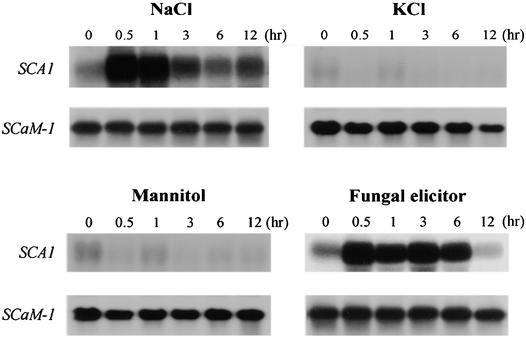
To examine if SCA1 gene expression can be altered in response to abiotic and biotic stress, we treated soybean suspension cells (SB-P cells; Horn et al., 1989) with 100 mM NaCl, 100 mM KCl, 200 mM mannitol, or 50 μg/mL of total reducing sugar prepared from Fusarium solani. Gel blots of total RNA isolated from treated suspension cells were probed for SCA1 mRNA (Figure 11). NaCl stress and fungal elicitor produced a marked 20-fold increase in SCA1 mRNA within 30 min. In controls using KCl and mannitol to produce an osmotic stress equivalent to 100 mM NaCl, we observed no increase in SCA1 mRNA. This result indicated that the accumulation of SCA1 mRNA was increased in response to a sodium ion stress rather than a general osmotic stress. In response to the NaCl stress treatment, the SCA1 mRNA was sustained at high quantities for 1 hr, then returned to nearly its basal value by 6 hr, despite the continued presence of 100 mM NaCl. In contrast, fungal elicitor–treated cells sustained high quantites of SCA1 mRNA for the first 6 hr after treatment before declining ∼12 hr after treatment.
Figure 11.
NaCl Stress and a Fungal Elicitor Increase SCA1 mRNA.
Each lane was loaded with 10 μg of total RNA isolated from SB-P cells treated with NaCl (100 mM), KCl (100 mM), mannitol (200 mM), or fungal elicitor for the times indicated. The gel blots were hybridized with a 32P-labeled SCA1 gene–specific probe and washed at high stringency at 60°C in 0.1 × SSC (see Methods). The parallel RNA gel blot analysis of SCaM-1 mRNA provides a control, showing the expression of gene that did not respond to any of the stress treatments. Equal loading of total RNA was verified by using ethidium bromide staining to detect rRNA (not shown).
DISCUSSION
Biochemical evidence previously suggested the presence of a calmodulin-regulated Ca2+ pump in the plant cell plasma membrane (Evans, 1994; Bonza et al., 1998), but the corresponding gene for this was not identified until now. In this study, both membrane fractionation and cytology indicated that SCA1p was located in the plasma membrane, and biochemical and genetic evidence demonstrated that SCA1p was a calmodulin-stimulated Ca2+ pump.
The localization of SCA1p in the plasma membrane was determined by two different membrane fractionation protocols, buoyant density sucrose gradients and aqueous two-phase partitioning. In both protocols, SCA1p cofractionated with a typical plasma membrane marker, H+-ATPase (Figures 3 and 4), rather than with control markers for endomembranes, such as the ER, chloroplasts, tonoplasts, and Golgi. This plasma membrane location was corroborated by cytological imaging of SCA1p tagged with a GFPp. In contrast to the fluorescent signal from a similarly tagged Ca2+ pump ACA2p, which showed a reticulate-like endomembrane localization (Hong et al., 1999), SCA1-GFPp showed a peripheral pattern of fluorescence, consistent with a plasma membrane location (Figure 5). This evidence from a GFPp-tagged pump was important because it provided an isoform-specific analysis coupled to a cytological verification.
Biochemical evidence that SCA1p was a calmodulin-stimulated ATPase was demonstrated by enzyme assays. Calmodulin stimulated ATPase activity by approximately sixfold in a dose-dependent manner, showing a half-maximum activation at ∼10 nM for SCaM-1 (Figure 9) or bovine calmodulin (not shown). This value represents a higher K1/2 than that reported for ACA2p (K1/2 = 30 nM bovine calmodulin), in agreement with prior findings on the biochemical properties of enzymes purified from plant tissues, that is, that Ca2+ pumps from the plasma membrane have a stronger binding affinity for calmodulin than do pumps from the tonoplast (Askerlund, 1996, 1997) or other endomembranes (Dainese et al., 1997; Bonza et al., 1998). The greater calmodulin binding affinity of SCA1p also might be attributable to the presence of two CaMBDs, delineated here as CaMBD1 and CaMBD2 (Figure 6).
The presence of an N-terminal regulatory domain in SCA1p was demonstrated by an N-terminal deletion that resulted in a calmodulin-independent (i.e., deregulated) pump with kinetic properties similar to those of a full-length pump stimulated by calmodulin. Calmodulin stimulation of a full-length pump showed a five- to sixfold increase in Vmax (Figure 10A) and a 10-fold increase in Ca2+ affinity (from K1/2 = 15 μM to K1/2 = 1.5 μM) (Figure 10B), like a typical plasma membrane–type Ca2+ pump (Enyedi et al., 1987). In comparison, even in the absence of calmodulin, the Vmax of a truncated pump SCA1p nt85 was similar to that of a calmodulin-stimulated wild-type pump. This high constitutive activity of SCA1p nt85 was accompanied by a high affinity for Ca2+ (K1/2 = 0.2 to 0.3 μM), regardless of whether calmodulin was present. Compared with ACA2p, a calmodulin-regulated Ca2+ pump in the ER membrane, SCA1p showed much lower affinity for Ca2+ (0.67 μM versus 15 μM for ACA2p) in the absence of calmodulin. When calmodulin was added, the K1/2 of SCA1p for Ca2+ was shifted by ∼10-fold, but that of ACA2p was shifted only 1.5-fold (Hwang et al., 2000).
Genetic complementation of yeast mutant K616 by SCA1p nt85 confirmed that SCA1p can function as a Ca2+ pump in vivo. Both full-length and truncated mutants were expressed in yeast K616, in which not only its two endogenous Ca2+ pumps (PMR1p and PMC1p) but also a Ca2+/calmodulin–dependent protein phosphatase, calcineurin (CNB1p), are disrupted (Cunningham and Fink, 1994). An N-terminally truncated mutant (SCA1p nt85) allowed the yeast K616 to grow on Ca2+-depleted media, whereas full-length SCA1p did not (Figure 8A). This ability of the truncated but not the full-length enzyme to provide complementation is probably the result of a higher constitutive Ca2+-ATPase activity of the truncated enzyme. This hypothesis is consistent with in vitro ATPase assays, which show that the truncated enzyme has 4.4-fold more activity than the basal activity of the full-length enzyme (Figure 10). Under normal cytosolic conditions, the full-length SCA1p is expected to remain in a basal state because calmodulin activation requires above-normal calcium concentrations. Activation of the full-length enzyme is even less likely in cells grown on Ca2+-depleted media (i.e., starved for calcium). However, we cannot rule out an alternative explanation that complementation by the truncated SCA1p is related to its relatively greater accumulation in a particular endomembrane compartment (Figure 8B). The unique ability of a truncated version of SCA1p to provide complementation also was seen with a truncated version of ACA2p (Harper et al., 1998). Although SCA1p is a plasma membrane pump in plants, its capacity to provide complementation in yeast probably resulted from an artifactual accumulation in the yeast secretory pathway (Figure 8B). Such mistargeting of heterologous proteins in yeast is common. For example, when a plant plasma membrane H+-ATPase was expressed in yeast, most of the enzyme was retained in the ER membrane (Villalba et al., 1992). For complementation in K616 to occur, a Ca2+ pump is presumed to function in the ER–Golgi to scavenge enough Ca2+ from the cytosol for proper functioning of the secretory pathway.
Calmodulin binding overlay assays demonstrated that SCA1p contains two separable Ca2+-dependent calmodulin binding sites in its N-terminal domain (Figure 6). The first calmodulin binding site (CaMBD1) is located in the first 40 residues and is probably a putative amphipathic basic helix between Leu21 and Phe40. The second (CaMBD2) includes the residues between positions 52 and 71 is probably a modified IQ motif between Ile57 and Val67. The modified IQ motif is similar to the CaMBD of an L-type Ca2+ channel (Zuhlke et al., 1999). Whether other related plant pumps also contain a second binding site functionally equivalent to this modified IQ motif is unclear, given that similar deletion analyses have not been done. However, the modified IQ motif in SCA1p (CaMBD2) appears to facilitate a regulatory binding interaction, as shown by the ability of calmodulin to stimulate a truncation mutant (SCA1p nt52) in which the first site has been deleted but the second remains intact. In an example from an animal plasma membrane–type Ca2+ pump (hPMCA 4a), the presence of a second CaMBD was noted (Kessler et al., 1992; Verma et al., 1996). Whether a two-binding-site organization is common to all of the plant type IIB pumps or instead endows specific isoforms with a different mode of regulation awaits further investigation.
The abundance of SCA1 mRNA was rapidly and highly induced by NaCl stress and fungal elicitor (Figure 11). This increase was specific, given that a control transcript from SCaM-1 did not show a similar response. NaCl stress, osmotic stress, and a fungal elicitor have been shown to cause increases in [Ca2+]cyt in plant cells (Knight et al., 1997; Sanders et al., 1999), providing a basis for speculating that a calcium signaling pathway upregulates SCA1 transcription. At the same osmolality, however, KCl and mannitol did not increase the SCA1 mRNA. These results suggest that calcium signals specific to a NaCl stress or elicitor treatment evoke an increase in SCA1 transcription or mRNA stability. Although there are no prior reports of stress inducing the gene expression of a plant type IIB Ca2+ pump, NaCl stress has been reported to induce the expression of type IIA Ca2+ pump genes in tobacco and tomato (Perez-Prat et al., 1992; Wimmers et al., 1992). However, the induction reported here for SCA1 was at least 20-fold faster than in those studies. Interestingly, for SCA1 the NaCl stress and fungal elicitor produced different patterns of transcription activation, with the induction sustained twice as long by the elicitor. The consequences of upregulating the Ca2+ pump in response to these abiotic and biotic stresses is not understood, but we speculate it provides an adaptive response such that a stimulated cell would acquire an enhanced efflux capacity capable of subsequently decreasing the magnitude or duration of a calcium release in response to further exposure to a given stimulus.
In summary, the discovery of SCA1p identifies a pathway for calmodulin-stimulated Ca2+ efflux across the plasma membrane in plant cells. In contrast to the analogous pump in animal cells, this plant pump belongs to a structurally unique subfamily of calmodulin-stimulated pumps harboring an N-terminal instead of a C-terminal regulatory domain. Members of this family have now been identified in four different subcellular locations in plant cells, providing a dramatic contrast to animal cells, in which calmodulin-regulated pumps appear to be used exclusively in the plasma membrane. It is not clear how members of the plant type IIB pumps are targeted to their different locations or what their specific functions may be.
METHODS
Plant Material and Yeast and Escherichia coli Strains
Soybean (Glycine max cv Williams) and soybean suspension cells (SB-P; Horn et al., 1989) were used for plant materials. Saccharomyces cerevisiae strains used for complementation studies, protein expression, and ATPase assays were W303-1A (MATα, leu2, his3, ade2, ura3) and K616 (MATα pmr1::HIS3 pmc1::TRP1 cnb1::LEU2, ura3) (Cunningham and Fink, 1994). For DNA cloning, we used the E. coli stains XL1-Blue (Stratagene) and DH 5α (Stratagene). The expression of fusion protein was performed in E. coli BL21 (pLysS) DE3.
Isolation of Ca2+-ATPase cDNA from Soybean cDNA Library and 5′ Rapid Amplification of cDNA Ends
As a probe, a 32P-labeled F955 cDNA was used to screen a λ ZAPII (Stratagene)–based cDNA library constructed from half-apical and half-elongating regions of hypocotyls (0.3- to 1.3-cm-long sections below cotyledon tissues) of 4-day-old etiolated soybean seedlings (Hong et al., 1995). The F955 clone was a partial cDNA that encoded a putative plasma membrane–type Ca2+-ATPase isolated from Brassica flower bud cDNA (Lim et al., 1996). Positive plaques from the primary screening were purified by two additional rounds of plaque hybridizations. To isolate cDNA inserts from phages, we excised the purified positive plaques in vivo with a helper phage R408 (Stratagene).
To obtain 5′ regions of a SCA1 cDNA, we performed 5′ rapid amplification of cDNA ends (RACE) with a Marathon cDNA amplification kit according to the manufacturer's instructions (Clontech, Palo Alto, CA). cDNA was synthesized from 1 μg of mature hypocotyl region poly(A)+ RNA by using oligo(dT) primer (5′-TTTTT30NN-3′) and Moloney Murine Leukemia Virus (MMLV) reverse transcriptase, and a unique adaptor (Clontech) was ligated to both of the cDNA ends. The oligonucleotides used for the 5′ RACE were a SCA1-specific oligonucleotide (5′-CATCCCCGGTCCAGCTCCGTAAGC-3′) and an adapter primer from Clontech. For polymerase chain reaction (PCR) amplification of 5′ cDNA ends, a 1:250 portion of the adaptor-ligated cDNA and the expand long polymerase (Boehringer Mannheim) were used in reactions with primer combinations subjected to the following amplification cycles: 30 cycles at 95°C for 2 min and at 68°C for 5 min and a final extension step at 68°C for 10 min. The amplified product was subcloned into the SmaI site of pBluescript SK+ (Stratagene). A full-length cDNA clone, obtained by subcloning the 5′ RACE product of SCA1 into the 5′ regions of the SCA1 partial cDNA clone, was named pSCA1.
Constructs
We used standard PCR and subcloning procedures to modify SCA1 sequences into the clones described below. Standard molecular techniques were used (Sambrook et al., 1989). PCR was performed using Ampli-Taq (Perkin-Elmer) or the expand long template PCR system (Boehringer Mannheim). All PCR-produced sequences were sequenced to verify the absence of PCR mistakes.
pSCA1-wt, which encodes a full-length SCA1p, was derived from pSCA1 by deleting the 5′ and 3′ untranslated regions. The following oligomers were synthesized: start primer S, 5′-AAAACTCGAGGATCCATGGAGAGTTATTTAAATGAGAAT-3′; and end primer AS, 5′-TTTGGTACCTCAGCCGTCTAGACCGCCAACAGGAATCTTCTTTAAGCGAGC-3′). Start primer S corresponded to the cDNA sequence encoding SCA1p and introduced XhoI and BamHI sites. End primer AS corresponded to the complement sequence of the coding strand and introduced a XbaI site. PCR was performed with pSCA1 as a template, and the fragment obtained was subcloned into the BamHI and XbaI sites of pBluescript SK−.
pYES-SCA1 encodes the SCA1p full-length protein and was subcloned from a BamHI-XbaI fragment of pSCA1-wt into the BamHI-XbaI site of pYES2 (Invitrogen). pYes2-SCA1 nt17, pYes2-SCA1 nt41, pYes2-SCA1 nt52, pYes2-SCA1 nt71, and pYes2-SCA1 nt85 encode SCA1p nt17, SCA1p nt41, SCA1p nt52, SCA1p nt71, and SCA1p nt85, respectively. The following oligonucletides were synthesized: SCA1 nt17S, 5′-AAAGGATCCATGGAAGAGGTTCTTCAACGATGG-3′; SCA1 nt41S, 5′-AAAGGATCCATGGCAAAT-CTCTCCAAGAGGGAC-3′; SCA1 nt52S, 5′-AAAGGATCCATG-CGTCGTACCATTCAGGAG-3′); SCA1 nt71S, 5′-AAAGGATCCATGGCACTTCAATTTATCCAAAGC-3′; and SCA1 nt85S, 5′-AATGGATCCATGCCAGAGGAAGTTAAAGATGC-3′. These oligonucleo-tides corresponded to the coding strands and introduced BamHI sites; the ATG start codons are underlined. PCR was performed with pSCA1 as a template and by using each primer mentioned and end primer AS, and the BamHI-XbaI fragments were subcloned into the BamHI-XbaI sites of pYES2.
pGST-SCA1Ag encodes GST-SCA1Ag, which contains residues K468 to E567 of SCA1p as a fusion with glutathione S-transferase (GST) at the N terminus. The primer SCA1Ag-S (5′-AAACCATGGGATCCAAAACATGCTTTTGCATGAACAGC-3′) was synthesized. The SCA1Ag-S oligonucleotide corresponded to the cDNA encoding SCA1 and introduced NcoI and BamHI sites. PCR was performed by using pSCA1 as a template and SCA1Ag-S primer and end primer AS. The pGST-SCA1Ag was derived from subcloning the NcoI-Ecl136II PCR fragment into the NcoI-SmaI sites of pAK-SS, a modified pGEX-2T vector (Amersham Pharmacia Biotech).
pGST-SCA1p (1-40)–GFP encodes the first 40 residues of SCA1p as a fusion protein with GST at the N terminus and a green fluorescent protein (GFP) at the C terminus. It was constructed by subcloning a PCR fragment into the BamHI-SmaI site of a GST–GFP fusion vector. A GST–GFP fusion vector was derived by inserting a GFP fragment into the SmaI-EcoRI site of pAK-SS. The sequence at the fusion site between SCA1 and GFP is TTCCCGGGAACCATG, where the first codon is the codon of SCA1 that encodes Phe40, the SmaI site is underlined, and the last codon is the start codon of GFP.
p35S-SCA1-GFP encodes a full-length SCA1–GFPp fusion protein. The XhoI-XbaI fragment of pSCA1-wt was subcloned into the XhoI-SpeI site of p35S-GFP-JFH1 (Hong et al., 1999). The nucleotide sequence at the fusion site between SCA1 and GFP is GTTGGCGGTCTAGTGATG, where the first codon is the last codon of SCA1 that encodes Val1014, the following two codons introduce two codons that encode Gly residues, the ligated XbaI-SpeI site is underlined, and the last codon is the start codon of GFP.
DNA Sequencing and Data Analysis
Nucleotide sequences were determined from both strands of cDNAs by using a Taq dye primer sequencing kit on an automated DNA sequencer (model 373A; Applied Biosystems, Foster City, CA). Primary analyses of nucleotide and deduced amino acid sequences were performed using MacVector program (IBI Kodak, Rochester, NY). Transmembrane domains of Ca2+-ATPases were predicted using TMpred and the PROSITE program at the ExPASy website.
RNA Gel Blot Analyses
Tissues and organs from various parts of 4-day-old etiolated soybean seedlings and 5-week-old mature soybean plants were divided into sections as described (Hong et al., 1989). Isolation of total RNA and RNA gel blot hybridization were performed as described (Lee et al., 1995). SB-P cell culture was maintained in KN-1 medium as described (Horn et al., 1989). For NaCl or KCl treatment, 5 M NaCl or 3 M KCl solution was used to make a final concentration of 100 mM. For mannitol treatment, 1 M mannitol solution dissolved in KN-1 medium was added to make a final concentration of 200 mM. The fungal elicitor was prepared from Fusarium solani grown on potato dextrose agar (Difco) medium as described (Heo et al., 1999); the elicitor was carefully added into the flask of the cultured SB-P cells at a final total reducing sugar concentration of 50 μg/mL. A 32P-labeled 642-bp ApaI fragment including the 3′ untranslated regions of SCA1 cDNA was used as a gene-specific probe.
Purification of Fusion Proteins
GST fusion proteins were expressed in E. coli (BL21 [pLys S] DE3) containing pGST fusion construct as described (Harper et al., 1998). The fusion protein was purified by GST affinity column chromatograpy. Protein concentration was determined using a protein assay kit (Bio-Rad) standardized with BSA (Sigma).
Preparation of Polyclonal Antibody and Protein Gel Blots
Polyclonal antibody against GST-SCA1Ag was produced as described (Lee et al., 1995) with minor modifications. Immunized serum was precipitated with 50% (w/v) ammonium sulfate and resuspended in PBS. Polyclonal antiserum to SCA1Ag was purified to remove any remaining minor cross-reactivities by antigen affinity chromatographies with SCA1Ag peptide–Sepharose columns. The column was prepared by conjugating SCA1Ag peptide (residues K468 to E567) to cyanogen bromide–activated Sepharose 4B according to the procedure recommended by the manufacturer (Amersham Pharmacia Biotechnology). SCA1Ag peptide (residues K468 to E567) was obtained by thrombin digestion of purified GST–SCA1Ag fusion protein. Briefly, anti-SCA1Ag antiserum was bound to a SCA1Ag peptide–Sepharose column and washed with PBS. Anti-SCA1Ag antibody was eluted with 0.1 M glycine, pH 2.7, immediately neutralized with 0.1 M Tris-HCl, pH 8.0, and dialyzed against PBS in a Centricon (Millipore Corp., Bedford, MA) dialyzer. Protein gel blots were performed as described (Harper et al., 1998).
Preparation of Soybean Membrane Fractions
Microsomal membrane from 2-day-old etiolated soybean seedlings was prepared as described (Hong et al., 1999). All procedures were performed on ice or in a cold room (4°C) with prechilled buffers. Two-day-old etiolated soybean seedlings were homogenized with a mortar and pestle under a homogenization buffer of 20% (w/w) sucrose, 50 mM Tris-HCl, pH 8.0, 2 mM EDTA, 4 mM DTT, 2 mM phenylmethylsulfonyl fluoride, 20 μg/mL chymostatin, 20 μg/mL pepstatin, and 40 μM leupeptin. After filtration through two layers of Miracloth (Calbiochem), the homogenate was centrifuged at 12,000g for 10 min to remove intact organelles and cell walls. The supernatant was centrifuged in a Type SW28 rotor (Beckman) at 100,000g for 1 hr. The resulting supernatants were used as the soluble protein fraction. Membrane pellets were resuspended in homogenizing buffer (1 mL/10 g starting material) by using glass homogenizers. Microsomes (1 mL) were applied onto a continuous sucrose gradient from 15 to 45% (w/w) in a centrifugation buffer (10 mM Tris-HCl, pH 7.5, 1 mM EDTA, 1 mM DTT, 2 mM phenylmethylsulfonyl fluoride, 20 μg/mL chymostatin, and 40 μM leupeptin). Gradients were centrifuged in a type SW41 rotor (Beckman Instruments) at 110,000g for 18 hr. Fractions (0.8 mL) were collected from the top, frozen in liquid nitrogen, and stored at −80°C until used. A refractometer was used to determine the sucrose concentration of each fraction.
Aqueous Two-Phase Partitioning
Plant microsomal membranes were prepared as described above. After ultracentrifugation, the membrane pellet was resuspended in resuspension buffer (0.33 M sucrose, 4 mM KCl, and 5 mM KHPO4, pH 7.8). Plasma membranes were partially purified by aqueous two-phase partitioning as described by Harper et al. (1998).
Preparation and Transformation of Protoplast
Protoplasts of the tobacco cell line BY-2 were prepared and transformed by electroporation as previously described (Watanabe et al., 1987). Approximately 106 protoplasts were transformed by electroporation with 15 μg of p35S-SCA1-GFP plasmid. After transformation, the protoplasts were resuspended in 10 mL of medium and cultured in 35-mm-diameter Petri dishes in the dark at 28°C for 24 hr before examination under a confocal microscope. Confocal laser scanning micrographs of a transformed protoplast were recorded using a Zeiss microscope (Axivert 100; Zeiss, Inc., Thornwood, NY) equipped with a laser scanning unit (LSM 510). Focal planes were scanned at 488 nm with an argon krypton laser, using a 550-nm barrier filter and a plan-Apo 63×, 1.4 NA oil-immersion objective lens. Optical sections were made using a software program provided by the manufacturer.
Calmodulin Binding Overlay Assays
Calmodulin gel overlay was performed as described (Lee et al., 1997) with minor modifications. Samples (1 to 5 μg) mixed with SDS sample buffer were separated on 8 or 10% SDS–polyacrylamide gels. After the proteins were transferred onto an Immobilon-P membrane (Millipore), the gel blot was blocked by incubating for 1 hr with TBS-T (Tris-buffered saline [25 mM Tris-HCL, pH 7.4, 137 mM NaCl, 27 mM KCI] plus 0.1% [w/v] Tween 20) containing 6% (w/v) nonfat dry milk. After being washed three times in TBS-T for 5 min, the gel blot was equilibrated in buffer G (50 mM imidazole, pH 7.5, and 150 mM NaCl) for 1 hr. The gel blot was further blocked for another 2 hr in buffer G containing 9% (w/v) gelatin from cold-water fish skin (Sigma), 0.5% (w/v) Tween 20, and 1 mM CaCl2. The horseradish peroxidase (HRP)–conjugated SCaM-1 (Lee et al., 1997) used as a probe was added to the gelatin-containing buffer G at a final concentration of 0.2 μg/mL (∼12 nM). After incubation for 2 hr with the probe, the gel blot was sequentially washed five times with each of the following (5-min period) washes: buffer W (TBS-T containing 1 mM CaCl2 and 50 mM imidazole, pH 7.5), buffer W containing 0.2 M KCl, and finally 20 mM Tris-HCl, pH 7.5, containing 1 mM CaCl2, 0.1% (w/v) Tween 20, and 1 mM MgCl2. After the washing, bound SCaM-1 conjugated with HRP was detected using the ECL detection kit (Amersham Pharmacia Biotechnology). As a control, the same procedure was repeated in the presence of 5 mM EGTA instead of 1 mM Ca2+.
Yeast Transformation
For transformations, W303-1A and K616 were grown in standard yeast extract peptone dextrose (1% [w/w] yeast extract, 2% [w/w] peptone, 2% [w/w] dextrose) (YPD) media supplemented with 10 mM CaCl2. Yeast was transformed with the pYES2 vector (Invitrogen) and with pYES2-SCA1, pYES2-SCA1 nt17, pYES2-SCA1 nt41, pYES2-SCA1 nt52, pYES2-SCA1 nt71, and pYES2-SCA1 nt85 by using the lithium acetate/polyethylene glycol methods (Elble, 1992). Transformants were selected for uracil prototrophy by plating on synthetic complete medium minus uracil (SC-URA) supplemented with 2% (w/v) glucose as a carbon source and 2% (w/v) agar. For complementation studies, colonies were streaked on SC-URA agar plates containing 2% (w/v) glucose or galactose and 10 mM EGTA, pH 6.0, and incubated for 4 days at 30°C.
Isolation of Yeast Membranes
Yeast cells were grown to late log phase with shaking at 30°C in 500 mL of SC-URA containing 10 mM CaCl2, harvested, and washed with cold water. Yeast cells were homogenized and fractionated on a continuous gradient of 20 to 60% (w/w) sucrose (Harper et al., 1998). One-milliliter fractions were collected from the top, frozen in liquid N2, and stored at −70°C until used. A refractometer was used to determine the sucrose concentration of each fraction.
ATPase Assays
ATPase assays were performed as described by Lanzetta et al. (1979). All samples (10 μL) were assayed at 25°C in a buffer of 20 mM MOPS, 8 mM MgSO4, 50 mM KNO3, 0.25 mM K2MoO4, 3 mM ATP, 5 mM NaN3, and 1 mM EGTA in the presence or absence of 0.1 mM sodium vanadate. Liberated free phosphate was measured using malachite green (Lanzetta et al., 1979). ATPase activity was calculated as the amount of vanadate-sensitive phosphate released. Calmodulin stimulation was tested by the addition of SCaM-1 or bovine calmodulin at ∼5 μM free [Ca2+ ]. To measure Ca2+ affinity, we measured the activities at several different concentrations of free Ca2+ in the presence or absence of SCaM-1. SCaM-1 was purified as described (Lee et al., 1995), and bovine brain calmodulin was obtained from Sigma. Free [Ca2+] was determined by the use of fluo-3, pentapotassium salt, and the Calcium Calibration Concentrated Buffer Kit (Molecular Probes, Eugene, OR), according to the manufacturer's instructions. In brief, a 1 mM fluo-3 stock was made in distilled water, aliquoted, and stored in the dark at −20°C. Using a final 1-μM concentration of fluo-3, we constructed a calibration curve based on known free [Ca2+] by exciting the sample at 425 nm and reading the emission at 520 nm in a spectrofluorometer. The emission at 520 nm of the 425-nm excited samples containing the ATPase reaction mix and various free Ca2+ concentrations were determined, and free [Ca2+] was calculated from the calibration curve.
Acknowledgments
We thank Amy Curran for assistance with ATPase assay, Dr. Audrey Ichida for the picture of ACA2-GFPp in a BY-2 cell, Dr. Barbara Pickard for assistance with microscopy, Dr. Kyle Cunningham for kindly providing the yeast strains, Dr. Jack Widholm for providing SB-P cells, and Dr. Maarten Chrispeels for providing anti-BIP antibody. This work was supported by a nondirected research grant from the Korea Research Foundation (1996) and a G7 grant (08-04-A27) to M.J.C., a grant from the Korea Science and Engineering Foundation to the Plant Molecular Biology and Biotechnology Research Center, and Department of Energy (DOE) Grants DE-FG03-94ER20152, DE-FG07-96ER20252, and IBN-9416038 to J.F.H.
References
- Askerlund, P. (1996). Modulation of an intracellular calmodulin-stimulated Ca2+-pumping ATPase in cauliflower by trypsin. The use of Calcium Green-5N to measure Ca2+ transport in membrane vesicles. Plant Physiol. 110, 913–922. [DOI] [PMC free article] [PubMed] [Google Scholar]
- Askerlund, P. (1997). Calmodulin-stimulated Ca2+-ATPase in the vacuolar and plasma membrane in cauliflower. Plant Physiol. 114, 999–1007. [DOI] [PMC free article] [PubMed] [Google Scholar]
- Axelson, K.B., and Palmgren, M.G. (1998). Evolution of substrate specificities in the P-type ATPase superfamily. J. Mol. Evol. 46, 84–101. [DOI] [PubMed] [Google Scholar]
- Bonza, C., Carnelli, A., De Michelis, M.I., and Rasi-Caldogno, F. (1998). Purification of the plasma membrane Ca2+-ATPase from radish seeding by calmodulin-agarose affinity chromatography. Plant Physiol. 116, 845–851. [DOI] [PMC free article] [PubMed] [Google Scholar]
- Bootman, M.D., and Berrige, M.J. (1995). The elemental principles of calcium signaling. Cell 83, 675–678. [DOI] [PubMed] [Google Scholar]
- Brandl, C.J., Green, N.M., Korczak, B., and MacLennan, D.H. (1986). Two Ca2+-ATPase genes: Homologies and mechanistic implications of deduced amino acid sequences. Cell 44, 597–607. [DOI] [PubMed] [Google Scholar]
- Bush, D.S. (1995). Calcium regulation in plant cells and its role in signaling. Annu. Rev. Plant Physiol. Plant Mol. Biol. 46, 95–122. [Google Scholar]
- Carafoli, E. (1994). Biogenesis: Plasma membrane calcium ATPase: 15 years of work on the purified enzyme. FASEB J. 8, 993–1002. [PubMed] [Google Scholar]
- Clapham, D.E. (1995). Calcium signaling. Cell 80, 259–268. [DOI] [PubMed] [Google Scholar]
- Cunningham, K.W., and Fink, G.R. (1994). Calcineurin-dependent growth control in Saccharomyces cerevisiae mutants lacking PMC1, a homolog of plasma membrane Ca2+-ATPases. J. Cell Biol. 124, 351–363. [DOI] [PMC free article] [PubMed] [Google Scholar]
- Dainese, P., James, P., Baldan, B., and Carafoli, E. (1997). Subcellular and tissue distribution, partial purification, and sequencing of calmodulin-stimulated Ca2+-transporting ATPases from barley (Hordeum vulgara L.) and tobacco (Nicotiana tabacum). Eur. J. Biochem. 244, 31–38. [DOI] [PubMed] [Google Scholar]
- Denecke, J., Goldman, M.H., Demolder, J., Seurinck, J., and Botterman, J. (1991). The tobacco lumenal binding protein is encoded by a multigene family. Plant Cell 3, 1025–1035. [DOI] [PMC free article] [PubMed] [Google Scholar]
- DeWitt, N.D., Hong, B., Sussman, M.R., and Harper, J.F. (1996). Targeting of two Arabidopsis H+-ATPase isoforms to the plasma membrane. Plant Physiol. 112, 833–844. [DOI] [PMC free article] [PubMed] [Google Scholar]
- Elble, R. (1992). A simple and efficient procedure for transformation of yeasts. Biotechniques 13, 18–20. [PubMed] [Google Scholar]
- Enyedi, A., Flura, M., Sarkadi, B., Gardos, G., and Carafoli, E. (1987). The maximal velocity and the calcium affinity of the red cell calcium pump may be regulated independently. J. Biol. Chem. 262, 6425–6430. [PubMed] [Google Scholar]
- Evans, D.E. (1994). Calmodulin-stimulated calcium pumping ATPases located at higher plant intracellular membranes: A significant divergence from other eukaryotes? Physiol. Plant. 90, 420–426. [Google Scholar]
- Ferrol, N., and Bennett, A.B. (1996). A single gene may encode differently localized Ca2+-ATPases in tomato. Plant Cell 8, 1159–1169. [DOI] [PMC free article] [PubMed] [Google Scholar]
- Haas, I.G. (1994). BiP (GRP78), an essential hsp70 resident protein in the endoplasmic reticulum. Experientia 50, 1012–1020. [DOI] [PubMed] [Google Scholar]
- Harper, J.F., Hong, B., Hwang, I., Guo, H.Q., Stoddard, R., Hwang, J.F., Palmgren, M.G., and Sze, H. (1998). A novel calmodulin-regulated Ca2+-ATPase (ACA2) from Arabidopsis with an N-terminal autoinhibitory domain. J. Biol. Chem. 273, 1099–1106. [DOI] [PubMed] [Google Scholar]
- Heo, W.D., Lee, S.H., Kim, M.C., Kim, J.C., Chung, W.S., Chun, H.J., Lee, K.J., Park, C.Y., Park, H.C., Choi, J.Y., and Cho, M.J. (1999). Involvement of specific calmodulin isoforms in salicylic acid–independent activation of plant disease resistance responses. Proc. Natl. Acad. Sci. USA 96, 766–771. [DOI] [PMC free article] [PubMed] [Google Scholar]
- Hofte, H., and Chrispeels, M.J. (1992). Protein sorting to the vacuolar membrane. Plant Cell 4, 995–1004. [DOI] [PMC free article] [PubMed] [Google Scholar]
- Hong, B., Ichida, A., Wang, Y., Gens, J.S., Pickard, B.G., and Harper, J.F. (1999). Identification of a calmodulin regulated Ca2+-ATPase in the endoplasmic reticulum. Plant Physiol. 119, 1165–1175. [DOI] [PMC free article] [PubMed] [Google Scholar]
- Hong, J.C., Nagao, R.T., and Key, J.L. (1989). Developmentally regulated expression of soybean proline-rich cell wall protein genes. Plant Cell 1, 937–943. [DOI] [PMC free article] [PubMed] [Google Scholar]
- Hong, J.C., Cheong, Y.H., Nagao, R.T., Bahk, J.D., Key, J.L., and Cho, M.J. (1995). Isolation of two soybean G-box binding factors which interact with a G-box sequence of an auxin-responsive gene. Plant J. 8, 199–211. [DOI] [PubMed] [Google Scholar]
- Horn, M.E., Widholm, J.M., and Ogren, W.N. (1989). Photoautotrophic growth of soybean cells in suspension culture. Plant Physiol. 72, 426–429. [DOI] [PMC free article] [PubMed] [Google Scholar]
- Huang, L., Berkelman, T., Franklin, A.E., and Hoffman, N.E. (1993). Characterization of a gene encoding Ca2+-ATPase–like protein in the plastid envelope. Proc. Natl. Acad. Sci. USA 90, 10066–10070. [DOI] [PMC free article] [PubMed] [Google Scholar]
- Hwang, I., Ratterman, D.M., and Sze, H. (1997). Distinction between endoplasmic reticulum-type and plasma membrane–type Ca2+ pumps. Plant Physiol. 113, 535–548. [DOI] [PMC free article] [PubMed] [Google Scholar]
- Hwang, I., Harper, J.F., Liang, F., and Sze, H. (2000). Calmodulin activation of an endoplasmic reticulum–located calcium pump involves an interaction with the N-terminal autoinhibitory domain. Plant Physiol. 122, 157–167. [DOI] [PMC free article] [PubMed] [Google Scholar]
- James, P., Vorherr, T., and Carafoli, E. (1995). Calmodulin-binding domains: Just two-faced or multi-faceted? Trends Biochem. Sci. 20, 38–42. [DOI] [PubMed] [Google Scholar]
- Kataoka, M., Head, J.F., Vorherr, T., Krebs, J., and Carafoli, E. (1991). Small-angle x-ray scattering study of calmodulin bound to parts of the calmodulin-binding domain of the plasma membrane Ca2+ pump. Biochemistry 30, 6247–6251. [DOI] [PubMed] [Google Scholar]
- Kessler, F., Falchetto, R., Heim, R., Meili, R., Vorherr, T., Strehler, E.E., and Carafoli, E. (1992). Study of calmodulin binding to the alternatively spliced C-terminal domain of the plasma membrane Ca2+ pump. Biochemistry 31, 11785–11792. [DOI] [PubMed] [Google Scholar]
- Kincaid, R.L., Nightingale, M.S., and Martin, B.R. (1988). Characterization of a cDNA clone encoding the calmodulin-binding domain of mouse brain calcineurin. Proc. Natl. Acad. Sci. USA 85, 8983–8987. [DOI] [PMC free article] [PubMed] [Google Scholar]
- Knight, H., Trewavas, A.J., and Knight, M.R. (1997). Calcium signaling in Arabidopsis thaliana responding to drought and salinity. Plant J. 12, 1067–1078. [DOI] [PubMed] [Google Scholar]
- Lanzetta, P.A., Alvarez, L.J., Reinach, P.S., and Camia, O.A. (1979). An improved assay for nanomolar amounts of inorganic phosphate. Anal. Biochem. 100, 95–97. [DOI] [PubMed] [Google Scholar]
- Lee, S.H., Kim, J.C., Lee, M.S., Heo, W.D., Seo, H.Y., Yoon, H.W., Hong, J.C., Lee, S.Y., Bahk, J.D., Hwang, I., and Cho, M.J. (1995). Identification of a novel divergent calmodulin isoform from soybean which has a different ability to activate calmodulin-dependent enzymes. J. Biol. Chem. 270, 21806–21812. [DOI] [PubMed] [Google Scholar]
- Lee, S.H., Seo, H.Y., Kim, J.C., Heo, W.D., Chung, W.S., Lee, K.J., Kim, M.C., Cheong, Y.H., Choi, J.Y., Lim, C.O., and Cho, M.J. (1997). Differential activation of NAD kinase by plant calmodulin isoforms. The critical role of domain I. J. Biol. Chem. 272, 9252–9259. [DOI] [PubMed] [Google Scholar]
- Lee, S.H., et al. (1999). Competitive binding of calmodulin isoforms to calmodulin-binding proteins: Implication for function of calmodulin isoforms in plant. Biochim. Biophys. Acta 1433, 56–67. [DOI] [PubMed] [Google Scholar]
- Liang, F., Cunningham, K.W., Harper, J.F., and Sze, H. (1997). ECA1 complements yeast mutants defective in Ca2+ pumps and encodes an endoplasmic reticulum–type Ca2+-ATPase in Arabidopsis thaliana. Proc. Natl. Acad. Sci. USA 94, 8579–8584. [DOI] [PMC free article] [PubMed] [Google Scholar]
- Lim, C.O., Kim, H.Y., Kim, M.G., Lee, S.I., Chung, W.S., Park, S.H., Hwang, I., and Cho, M.J. (1996). Expressed sequence tags of Chinese cabbage flower bud cDNA. Plant Physiol. 111, 577–588. [DOI] [PMC free article] [PubMed] [Google Scholar]
- Malmstrom, S., Askerlund, P., and Palmgren, M.G. (1997). A calmodulin-stimulated Ca2+-ATPase from plant vacuolar membranes with a putative regulatory domain at its N-terminus. FEBS Lett. 400, 324–328. [DOI] [PubMed] [Google Scholar]
- Meader, W.E., Means, A.R., and Quiocho, F.A. (1993). Target enzyme recognition by calmodulin: 2.4 Å structure of a calmodulin–peptide complex. Science 262, 1718–1721. [DOI] [PubMed] [Google Scholar]
- Nagahashi, J., and Kane, A.P. (1982). Triton-stimulated nucleoside diphosphatase activity: Subcellular localization in corn root homogenates. Protoplasma 112, 167–173. [Google Scholar]
- Penniston, J.T., and Enyedi, A. (1998). Modulation of plasma membrane Ca2+ pump. J. Membr. Biol. 165, 101–109. [DOI] [PubMed] [Google Scholar]
- Perez-Prat, E., Narasimhan, M.L., Binzel, M.L., Botella, M.A., Chen, Z., Valpuestra, V., Bressan, R.A., and Hasegawa, P.M. (1992). Induction of a putative Ca2+-ATPase mRNA in NaCl-adapted cells. Plant Physiol. 100, 1471–1478. [DOI] [PMC free article] [PubMed] [Google Scholar]
- Peterson, B.Z., DeMaria, C.D., and Yue, D.T. (1999). Calmodulin is the Ca2+ sensor for Ca2+-dependent inactivation of L-type calcium channels. Neuron 22, 549–558. [DOI] [PubMed] [Google Scholar]
- Rhoads, A.R., and Friedberg, F. (1997). Sequence motifs for calmodulin recognition. FASEB J. 11, 331–340. [DOI] [PubMed] [Google Scholar]
- Rudolph, H.K., Antebi, A., Fink, G.R., Buckley, C.M., Dorman, T.E., LeVitre, J., Davidow, L.S., Mao, J.I., and Moir, D.T. (1989). The yeast secretory pathway is perturbed by mutations in PMR1, a member of a Ca2+ ATPase family. Cell 58, 133–145. [DOI] [PubMed] [Google Scholar]
- Sambrook, J., Fritch, E.F., and Maniatis, T. (1989). Molecular Cloning: A Laboratory Manual, 2nd ed. (Cold Spring Harbor, NY: Cold Spring Harbor Laboratory Press).
- Sanders, D., Brownlee, C., and Harper, J.F. (1999). Communicating with calcium. Plant Cell 11, 691–706. [DOI] [PMC free article] [PubMed] [Google Scholar]
- Verma, A.K., Enyedi, A., Filoteo, A.G., Strehler, E.E., and Penniston, J.T. (1996). Plasma membrane calcium pump isoform 4a has a longer calmodulin binding domain than 4b. J. Biol. Chem. 271, 3714–3718. [DOI] [PubMed] [Google Scholar]
- Villalba, J.M., Palmgren, M.G., Berberian, G.E., Ferguson, C., and Serrano, R. (1992). Functional expression of plant plasma membrane H+-ATPase in yeast endoplasmic reticulum. J. Biol. Chem. 267, 12341–12349. [PubMed] [Google Scholar]
- Watanabe, Y., Meshi, T., and Okada, Y. (1987). Infection of tobacco protoplasts with in vitro transcribed tobacco mosaic virus RNA using an improved electroporation method. FEBS Lett. 219, 65–69. [Google Scholar]
- Wimmers, L.E., Ewing, N.N., and Bennett, A.B. (1992). Higher plant Ca2+-ATPase: Primary structure and regulation of mRNA abundance by salt. Proc. Natl. Acad. Sci. USA 89, 9205–9209. [DOI] [PMC free article] [PubMed] [Google Scholar]
- Zuhlke, R.D., Pitt, G.S., Deisseroth, K., Tsien, R.W., and Reuter, H. (1999). Calmodulin supports both inactivation and facilitation of L-type calcium channels. Nature 399, 159–162. [DOI] [PubMed] [Google Scholar]


