

Abstract
Onconase® (ONC) is a homolog of RNase A that is in clinical trials as a cancer chemotherapeutic agent. The toxicity of ONC and RNase A variants relies on their ability to evade the cytosolic ribonuclease inhibitor protein (RI) and degrade cellular RNA. We find that these ribonucleases are more toxic for more rapidly growing cells. The enhanced cytotoxicity does not arise from variation in the endogenous level of RI, which is virtually constant. Overproduction of RI diminishes the potency of toxic RNase A variants, but has no effect on the cytotoxicity of ONC. Thus, RI constrains the cytotoxicity of RNase A. These data provide new insights for the development of an optimal ribonuclease-based cancer chemotherapy.
INTRODUCTION
Bovine pancreatic ribonuclease (RNase A, EC 3.1.27.5) is likely the most studied nuclease. For most of the last century, RNase A was an important model for the study of protein chemistry, protein folding and stability and enzymatic catalysis (1). Recent work on the RNase A superfamily has focused instead on exploring the biological functions and medical applications of ribonucleases (for reviews, see 2–7). In 1973, bovine seminal ribonuclease (BS-RNase), a homolog of RNase A, was shown to reduce transplanted Crocker tumors in mice (8). The toxicity of BS-RNase is not limited to tumor cells in vivo, as BS-RNase is also toxic to embryonic cells (9), testicular tissue (10,11) and oocytes (12). Onconase® (ONC) (13), an RNase A homolog from Rana pipiens, has anticancer and antiviral activity (14). ONC is also toxic to non-cancerous cells and high concentrations lead to renal toxicity in mice (15). ONC is now in Phase III clinical trials for the treatment of malignant mesothelioma (16).
Nearly 50 years ago, RNase A itself was shown to be cytotoxic, but only at extremely high levels (17,18). Recently, variants of RNase A have been shown to be cytotoxic at low concentrations. For example, G88R RNase A, which is a monomeric variant with Gly88 replaced with an arginine residue, is toxic to human leukemia cells (19). Replacing Lys7 with an alanine residue in G88R RNase A (K7A/G88R RNase A) creates an even more potent toxin (20). The tumor cell specificity for toxic variants of RNase A is unknown.
The molecular basis for cell susceptibility to toxic ribonucleases is poorly understood. The proposed mechanism of ribonuclease-mediated cytotoxicity involves cell surface binding and internalization, translocation to the cytosol, evasion of the cytosolic ribonuclease inhibitor protein (RI) and degradation of cellular RNA. Differences in the efficiency of any of these steps could enhance or decrease the amount of active ribonuclease within the cytosol and, hence, cell susceptibility.
Every mammalian cell studied contains RI. This oxidation-sensitive cytosolic protein binds to RNase A and other members of the RNase A superfamily (for reviews, see 21–23). The binding of RI to ribonucleases results in the complete loss of ribonucleolytic activity. The crystalline structure of porcine RI·RNase A complex reveals that extensive contacts are made with the active site of RNase A (24). RI interacts with RNase A with extremely high affinity [Ki ≈ 10–13 M (25,26)]. In contrast, RI has low (if any) affinity for ONC [Ki ≥ 10–6 M (27)]. RI has an intermediate affinity for the G88R and K7A/G88R variants of RNase A [Ki = 0.4 × 10⁻⁹ and 7 × 10⁻⁹ M, respectively (19,20)], which retain the conformational stability and ribonucleolytic activity of the wild-type enzyme. The cytotoxicity of RNase A variants correlates with their ability to evade endogenous RI (19,20,28). Nonetheless, the importance of intracellular RI concentration has not been directly investigated.
Here, we measure the toxicity of ONC, G88R RNase A and RNase A for human cell lines derived from normal tissue along with those derived from a cancerous origin. We then probe characteristics of these cells that could contribute to their susceptibility toward toxic ribonucleases. Most significantly, we find that the overproduction of RI makes cells resistant to toxic RNase A variants. This result reveals an important constraint on the cytotoxicity of RNase A and the first direct evidence that RI can act as an intracellular sentry. In contrast, ONC is unconstrained by intracellular RI.
MATERIALS AND METHODS
Materials
K-562, JAR, HeLa, WI-38, IMR-90, SK-HEP-1 and 293 cells were obtained from the American Type Culture Collection (Manassas, VA). HL-60 and Jurkat cells were kindly provided by L.L. Kiessling (Madison, WI). Cell culture medium and supplements were from Invitrogen (Carlsbad, CA).
Enzymes used for DNA manipulation were from Promega (Madison, WI) or New England Biolabs (Beverly, MA). Oligonucleotides and 6-FAM–dArU(dA)2–6-TAMRA were from Integrated DNA Technologies (Coralville, IA). [methyl-3H]Thymidine was from Perkin Elmer Life Sciences (Boston, MA). All other commercial chemicals and biochemicals were of reagent grade or better and were used without further purification.
Analytical instruments
Ultraviolet and visible absorption was measured with a Cary model 50 spectrophotometer (Varian, Sugarland, TX). Flow cytometry and fluorescence-activated cell sorting (FACS) were performed with a FACSVantage SE instrument (Becton Dickinson, San Jose, CA). Fluorescence was measured with a QuantaMaster1 photon-counting spectrophotometer from Photon Technology International (South Brunswick, NJ). Cells were transfected with a Gene Pulser from Bio-Rad (Hercules, CA). Radioactivity was measured with a Beckman model LS 3801 liquid scintillation counter (Beckman Instruments, Fullerton, CA).
Creation of pECFP–RI
A plasmid containing human RI cDNA was the generous gift of Promega (Madison, WI). The RI cDNA was ampli fied by PCR with the oligonucleotides RI-2b (5′-CGA CTGCAGAATTCTCAGGAGATGACCCTCAGG-3′) and RI-1f (5′-ACGAGCTGTACAAGGGCGGAGGCATGAGC CTGGACATCCAGAGCC-3′). The PCR fragment was ligated into plasmid pCR®-TOPO® (Invitrogen, Carlsbad, CA). The RI cDNA fragment was digested at the underlined sites with EcoRI and BsrGI and the resulting fragment was inserted into expression vector pECFP-C1 (Clontech, Palo Alto, CA) that had been digested with the same enzymes. The resulting plasmid, pECFP–RI, directs the production of an ECFP–RI fusion protein in human cells.
Production of ribonucleases
Wild-type RNase A, G88R RNase A, K7A/G88R RNase A and ONC were produced by using methods described previously (19,20,29). Protein concentrations were determined by UV spectroscopy using ε = 0.72 ml mg–1 cm–1 at 277.5 nm for RNase A (30) and its variants and ε = 0.87 ml mg–1 cm–1 at 280 nm for ONC (31). For cytotoxicity assays, ribonucleases were dialyzed versus phosphate-buffered saline (PBS), which contained (in 1.00 l) KCl (0.20 g), KH2PO4 (0.20 g), NaCl (8.0 g) and Na2HPO4 (2.16 g).
Cell culture
K-562, JAR and Jurkat cells were grown in RPMI medium 1640. HeLa, HL-60 and 293 cells were grown in DMEM. WI-38, IMR-90 and SK-HEP-1 cells were grown in MEM with Earle’s salts, l-glutamine (2 mM), non-essential amino acids (0.1 mM) and sodium pyruvate (1 mM). All culture medium contained fetal bovine serum (10% v/v), penicillin (100 U/ml), and streptomycin (100 µg/ml). Cells were cultured at 37°C in a humidified incubator containing 5% CO2(g). All studies were performed using asynchronous log phase cultures.
Transfection of human cells
Twenty-four hours before transfections, HeLa cells (3 × 10⁶) were plated in 10 cm dishes and K-562 cells were split (0.5 × 10⁴ cells/ml) with fresh medium. Between 5 and 6 h before transfections, the culture medium was refreshed. HeLa cells (10 × 106) were treated with trypsin and collected by centrifugation at 150 g. Cell pellets were resuspended in PBS (0.8 ml) and incubated with pECFP or pECFP–RI (20 µg) in a 4.0 mm electroporation cuvette for 10 min at 25°C. K-562 cells were collected and incubated with DNA as described for HeLa cells. Cells were transfected by electroporation at 320 and 230 V for HeLa and K-562 cells, respectively.
ECFP and ECFP–RI production was visualized directly in living cells. After electroporation, HeLa cells were grown on coverslips in the wells of a 6-well plate. After 24 h, ECFP fluorescence was visualized by using a Zeiss Axiovert microscope with 433 and 475 nm as the excitation and emission wavelengths, respectively.
Flow cytometry
FACS was performed 24 h after electroporation, on the basis of ECFP fluorescence with 413 and 470 nm as the excitation and emission wavelengths, respectively. Wild-type HeLa and K-562 cells were used to establish the background fluorescence. Only single cells were collected.
Cytotoxicity assays
The effect of ONC, RNase A and G88R RNase A on the proliferation of wild-type or flow-sorted cells was determined by measuring the incorporation of [methyl-3H]thymidine into newly synthesized DNA as described previously (20). Data were analyzed with the programs SigmaPlot (SPSS Science, Chicago, IL) and DeltaGraph (DeltaPoint, Monterey, CA). Each data point represents the mean (± SE) of at least three experiments, each performed in triplicate. The IC50 value for each variant was calculated by using the equation: S = {IC50/(IC50 + [ribonuclease]} × 100, where S is the percent of total DNA synthesis after the incubation period (48 h).
Microscopy
The cytotoxicity of ONC, RNase A and G88R RNase A was visualized directly by fluorescence microscopy. JAR or HeLa cells (5 × 10⁴ cells/ml) were grown on coverslips in the wells of a 6-well plate. Cells were incubated with ONC, RNase A or G88R RNase A (10 µM) at 37°C in a humidified incubator containing 5% CO2(g) for 48 h. After incubation, the cells were washed with PBS, fixed for 15 min with paraformaldehyde (4% w/v) and then permeabilized for 5 min with Triton X-100 (0.1% v/v). Samples were then washed with PBS and the nuclei were stained for 5 min with TOTO-3 iodide (0.1 µM) (Molecular Probes, Eugene, OR). Stained cells were viewed with a Zeiss Axiovert 100 TV microscope.
Growth curves
Cells (2.5 × 10⁵) were added in duplicate or triplicate to the wells of a 24-well plate. The plates of cells were incubated at 37°C in a humidified incubator containing 5% CO2(g). Cells were counted every 24 h, until cultures reached confluency, in the presence of trypan blue (0.2% w/v) using a hemacytometer. The exponential portion of the growth curve was fitted with the equation (32,33): Nt = Noekt, where Nt is the number of cells at time t, No is the initial number of cells and k is the growth rate constant. Population doubling time (τ) was then calculated with the equation: τ = ln 2/k.
Cytoplasmic protein purification
Cytoplasmic protein was extracted from each cell line as described by Hofsteenge and co-workers (34). All steps were completed at 4°C using ice-cold solutions. Briefly, cells were grown on 10 cm plates to 70% confluency and washed three times with PBS. Cells were lysed in lysis buffer [400 µl of 10 mM Tris–HCl buffer (pH 7.5) containing EDTA (1 mM), dithiothreitol (0.5 mM), saccharose (0.25 M), Triton X-100 (0.1% w/v), leupeptin (0.1 µg/ml), pepstatin A (0.1 µg/ml), benzamidine HCl (1 µg/ml) and phenylmethylsulfonyl fluoride (0.1 mM)] and harvested with a rubber cell scraper. Cells were vortexed and incubated on ice for 10 min. Samples were centrifuged at 3000 g for 10 min and supernatants were centrifuged at 270 000 g for 30 min. The resulting supernatants were analyzed immediately or stored in aliquots at –80°C until further use. The total protein concentration in cytoplasmic extracts was determined by using the Bradford method (35) as adapted by Pierce (Rockford, IL).
Immunoblotting
Cytoplasmic protein extracts (5–15 µg) were analyzed by gel electrophoresis in 10% (w/v) polyacrylamide gels according to the method of Laemmli (36). Human RI (50–200 ng) from Promega (Madison, WI) was used as a standard. Proteins were transferred to nitrocellulose and then blocked overnight in TBS-T [20 mM Tris–HCl buffer (pH 7.6), containing NaCl (0.137 M) and Tween 20 (0.1% w/v)] containing non-fat dry milk (2% w/v). An antibody raised in rabbit against recombinant porcine RI was a generous gift of J. Hofsteenge (Basel, Switzerland). Blots were incubated in blocking buffer containing a 1:103 dilution of anti-RI antibody for 1 h at room temperature or overnight at 4°C. Next, blots were washed three times for 10 min in TBS-T. Blots were then incubated with a goat anti-rabbit secondary antibody conjugated to alkaline phosphatase (Sigma, St Louis, MO) at a 1:104 dilution. After the blots were washed, RI was detected using the Atto Phos Plus substrate from JBL Scientific (San Luis Obispo, CA). Bands were visualized using a Vistra Fluorimager SI and analyzed with the program ImageQuant, both from Molecular Dynamics (Sunnyvale, CA).
Ribonuclease inhibition assays
Cytoplasmic protein extract from wild-type, ECFP and ECFP–RI HeLa cells were prepared and the RI activity in each extract was determined by measuring the inhibition of the ribonucleolytic activity of RNase A. Assays were performed at 23 ± 2°C in 2.00 ml of 0.10 M MES–NaOH buffer (pH 6.0) containing NaCl (0.10 M), in the presence of RNase A (10 pM) and the fluorogenic substrate 6-FAM–dArU(dA)2–6-TAMRA (50 nM) (37). Inhibitory activity was recorded as percent inhibition per µg cytosplasmic protein.
RESULTS
Ribonuclease-mediated toxicity to immortalized cell lines
The ability of ONC and G88R RNase A to inhibit cellular DNA synthesis was assessed with a series of human cell lines, derived from both cancerous and non-cancerous origins. A description of each cell line is listed in Table 1. Data for representative cell lines are shown in Figure 1. The toxicities of ONC and G88R RNase A towards each cell line tested, described as IC50 values, are listed in Table 1.
Table 1. Properties of cell lines and IC50 values for cytotoxic ribonucleases.
| Cell line | Tissue/origina | Doubling time (h) | IC50 (µM) | |
|---|---|---|---|---|
| ONC | G88R RNase A | |||
| K-562 | Chronic myelogenous leukemia | 18 | 0.54 ± 0.04 | 5.7 ± 0.4 |
| JAR | Placenta, choriocarcinoma | 21 | 0.074 ± 0.005 | 4.1 ± 0.3 |
| Jurkat | T cell leukemia | 22 | 0.22 ± 0.02 | 10 ± 1 |
| HeLa | Cervix, adenocarcinoma | 25 | 0.83 ± 0.05 | >25b |
| SK-Hep-1 | Liver, adenocarcinoma | 27 | 0.41 ± 0.03 | >25b |
| HL-60 | Promyelocytic leukemia | 30 | 0.42 ± 0.03 | >25b |
| IMR-90 | Lung, fibroblast | 34 | 0.57 ± 0.07 | c |
| WI-38 | Lung, fibroblast | 36 | 4.5 ± 0.3 | c |
| HEK 293 | Kidney, epithelial | 40 | 3.2 ± 0.7 | c |
aInformation from American Type Culture Collection.
bA protein concentration of 25 µM resulted in >30% but <50% cell death.
cA protein concentration of 25 µM resulted in <10% cell death.
Figure 1.

Proliferation of human cells exposed to a ribonuclease. Cells (5 × 10⁴) were incubated with increasing concentrations of ONC (A) or G88R RNase A (B). Plots for representative cell lines are shown to illustrate the potency of ONC and G88R RNase A. Each data point represents the mean (± SE) of at least three sets of triplicate experiments. IC50 values for all cell lines are listed in Table 1.
ONC was highly toxic to all transformed cells tested, with IC50 values in the sub-micromolar range (Fig. 1A and Table 1). ONC was most toxic to the JAR choriocarcinoma cell line, with an IC50 value of 0.074 µM. The leukemia-derived K-562, HL-60 and Jurkat cell lines were susceptible, with IC50 values of 0.54, 0.42 and 0.22 µM, respectively. The adenocarcinoma-derived HeLa and SK-HEP-1 cell lines were also susceptible to ONC-mediated toxicity, with IC50 values of 0.83 and 0.41 µM, respectively. The transformed cell line of a non-cancerous origin, 293, was more resistant to ONC, with an IC50 value of 3.2 µM. Thus, ONC was more toxic to tumor cell lines than to this non-tumor cell line. Nonetheless, 10 µM ONC resulted in >90% cell death for every cell line tested.
G88R RNase A was toxic to only a few of the tumor cell lines (Fig. 1B and Table 1). As for ONC, the JAR cell line was the most susceptible to G88R RNase A-mediated toxicity, with an IC50 value of 4.1 µM. K-562 and Jurkat cells, both leukemia-derived, were also susceptible, with IC50 values of 5.7 and 10 µM, respectively. The HL-60 leukemia-derived cell line was, however, not susceptible to G88R RNase A. HeLa and SK-Hep-1 cells were also resistant to G88R RNase A. Cells from these three lines began to die only when exposed to >25 µM protein and IC50 values could not be determined from the experimental data. When exposed to 25 µM G88R RNase A, <10% of 293 cells died. Wild-type RNase A was not toxic to any cell line at the levels tested.
Toxicity to primary cells
To investigate further the toxicity to normal fibroblast cells, we measured the IC50 values of ONC and G88R RNase A for the IMR-90 and WI-38 cells. ONC was toxic to both cell lines, with IC50 values of 1 and 5 µM, respectively (Table 1). G88R RNase A concentrations of 25 µM did not result in significant cell death. These results suggest that normal cells are resistant to G88R RNase A-mediated toxicity.
Cell microscopy
To verify that inhibition of cell proliferation was due to cell death, the effect of ribonucleases on HeLa or JAR cells was observed directly by using fluorescence microscopy. The resulting images are shown in Figure 2. RNase A had no detectable effect on cell viability, morphology or staining of the nucleus. HeLa cells treated with 10 µM G88R RNase A showed nuclear staining similar to that of cells treated with wild-type RNase A. HeLa cells treated with ONC demonstrated two characteristics of apoptosis: nuclear condensation and fragmentation. JAR cells treated with either G88R RNase A or ONC showed the presence of apoptotic bodies. These results are consistent with measured IC50 values, as JAR cells are more susceptible than are HeLa cells to G88R RNase A (Table 1).
Figure 2.

Microscopy of human cells exposed to a ribonuclease. HeLa and JAR cells were grown and exposed to 10 µM of wild-type RNase A, G88R RNase A or ONC for 48 h. Cell nuclei were stained using TOTO-3 iodide immunofluorescent reagent. Bar: 10 µm.
Cell growth curves
To determine whether the growth rate of a cell correlates with its vulnerability to ribonucleases, population doubling times were measured and compared to IC50 values. As listed in Table 1, cells derived from a cancerous origin had a more rapid growth rate than did those derived from normal tissue. In addition, cells derived from a similar origin did not necessarily have similar growth rates. A trend was observed: an increase in cell susceptibility is associated with faster doubling times.
Intracellular RI levels
We investigated whether cellular RI levels correlated with the apparent resistance of cell lines. Control experiments using RI standards showed that the amount of RI (ng) could be detected accurately by integrating each band (data not shown). As shown in Figure 3, RI was readily detectable in all cells tested. The intensity of each band was compared to the RI standard to determine RI levels in each cell line (Fig. 3C). No cell lines differed by more than 2-fold in RI level. In addition, RI levels did not vary between cell extracts from different protein purifications (data not shown). Thus, differences in RI concentrations did not correlate with susceptibility to toxic ribonucleases. RI represents ∼0.08% (= 120 ng/15 µg) of total cytoplasmic protein (Fig. 3). A similar value had been reported previously for HeLa cells (34) and brain tissue (38). These levels are higher than had been observed for RI purified from other tissues (for reviews, see 21,39).
Figure 3.
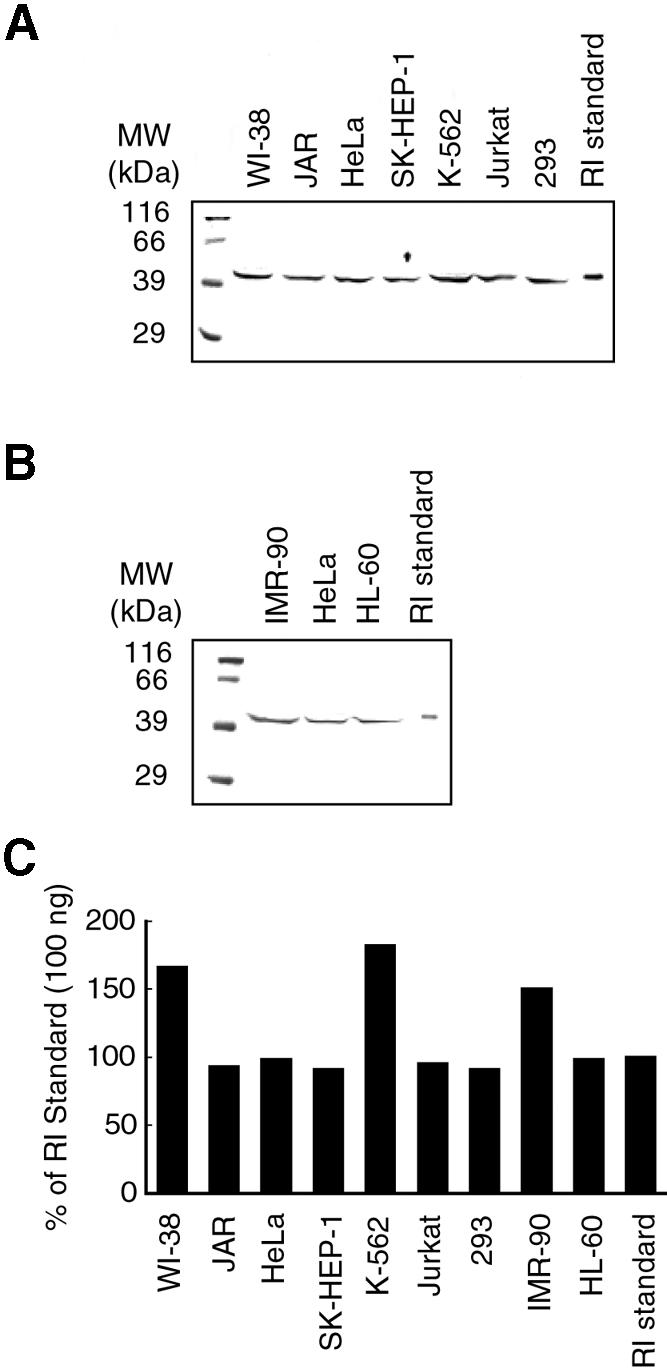
Immunoblot of RI in human cell extracts. Lanes contain protein (15 µg) from cytoplasmic extracts or a human RI standard: (A) 100 ng; (B) 50 ng. After electrophoresis, gels were probed with rabbit anti-porcine RI antibody. The quantity of RI in each lane is depicted in a bar graph (C).
Design of RI overproduction system
To explore further the role of RI, we designed a system to overproduce RI in mammalian cells. Our system had to meet several criteria. Most importantly, the RI fusion protein had to retain the characteristics of endogenous RI, i.e. it had to be located in the cytosol and be able to bind and inhibit the ribonucleolytic activity of RNase A. Also, the overproduced RI had to be easy to detect so that its overproduction would be apparent.
An ECFP–RI fusion protein satisfies these requirements. ECFP is an enhanced fluorescence analog of GFP (40–43) and monitoring its production is facile. The C-terminus of RI provides many contact points with RNase A in the RI·RNase A complex (24,44). In contrast, the N-terminus of RI is not involved in binding RNase A. In addition, the N-terminus of human RI contains four residues that extend away from the plane of the RI fold (45), acting as a natural linker. As GFP is a compact, cylindrical protein (46) and RI is a modular protein (47), we hypothesized that fusing ECFP to the N-terminus of RI would not impair the function of RI. To increase the distance between the ECFP and RI domains, three glycine residues were added as a spacer.
Production of ECFP–RI fusion protein
Under control of the CMV IE promoter, the ECFP–RI fusion protein was produced in the cytosol of HeLa and K-562 cells. ECFP alone was produced in these cells as a control. Transfection efficiencies were determined by FACS and ranged from 15–50 and 5–10% for HeLa and K-562 cells, respectively. Fluorescence microscopy was used to monitor the fluorescence of ECFP–RI or ECFP in transfected K-562 and HeLa cells. Results from a representative transfection of HeLa cells are shown in Figure 4A. Wild-type HeLa cells did not have detectable fluorescence. Cells transfected with pECFP had a strong fluorescence that was diffuse throughout the nucleus and cytoplasm. Cells producing ECFP–RI had a stronger fluorescence in the cytoplasm than in the nucleus.
Figure 4.

Transient overproduction of RI. (A) Microscopy of HeLa cells 24 h after transfection with pECFP or pECFP–RI. Bar: 20 µm. (B) Histogram of representative flow sorting experiment. HeLa cells producing ECFP–RI represented 14.8% of the total cell population before sorting (white area) and 94.6% of the population after sorting (gray area). (C) Immunoblot of cytoplasmic extract from flow-sorted K-562 and HeLa cells (50 000–100 000 cells/lane) that produce ECFP or ECFP–RI. RI was detected with an anti-porcine RI antibody and bands were compared to a human RI control. (D) Inhibition of ribonucleolytic activity by HeLa cell extracts. Extract (20 ng protein) from HeLa cells and flow-sorted HeLa cells producing ECFP–RI was added to a solution containing RNase A (10 pM) and 6-FAM–dArU(dA)2–6-TAMRA (50 nM). Less than 10% of the substrate was cleaved during the assay.
FACS was used to enrich the cell population with those cells that produce the most ECFP–RI. The sorting window was adjusted to collect only the 50% most fluorescent cells. A representative histogram for ECFP–RI production in HeLa cells is shown in Figure 4B. Prior to fluorescence-based sorting, only 15% of the total cell population produced ECFP–RI, but after sorting, 95% of the cells were fluorescent. All experiments on RI overproduction were performed on sorted cells.
Production of the ECFP–RI fusion protein was monitored by immunoblot analysis using a rabbit polyclonal antibody, which is specific for RI (Fig. 4C). As described previously, endogenous RI can be detected in all cell lines tested. Likewise, a 50 kDa band corresponding to the human RI control was detected in cells that were transfected with pECFP and pECFP–RI. HeLa and K-562 cells that were transfected with pECFP–RI produced an additional, high molecular weight band that was consistent with the addition of the 238 residues of ECFP to RI. The production of ECFP–RI in K-562 and HeLa cells results in a 2- and 10-fold increase, respectively, in total RI concentration as compared to endogenous RI levels in the same cells.
To verify that the ECFP–RI fusion protein contained a functional RI domain, the ability of cytoplasmic extract from ECFP–RI-producing HeLa cells to inhibit ribonucleolytic activity was measured. ECFP–RI extract inhibited RNase A activity 5-fold more than did extract containing the same concentration of protein from wild-type or ECFP-producing HeLa cells (Fig. 4D).
Cytotoxicity to transiently transfected cells
The toxicity of ribonucleases was measured for K-562 and HeLa cells that produced ECFP or the ECFP–RI fusion protein. As wild-type HeLa cells are normally resistant to the toxicity of G88R RNase A, we also tested a more toxic variant of G88R RNase A, K7A/G88R RNase A (20). In K-562 cells, production of ECFP had no effect on the toxicity of either ONC, G88R RNase A or K7A/G88R RNase A as compared to wild-type cells (Fig. 5A and Table 2). K-562 cells that produce the ECFP–RI fusion protein were 3- to 4-fold more resistant to the toxicity of G88R RNase A and K7A/G88R RNase A. In contrast, the toxicity of ONC was unaffected by the higher levels of RI in these cells.
Figure 5.

Proliferation of human cells that overproduce RI and are exposed to a ribonuclease. Flow-sorted K-562 or HeLa cells producing ECFP (open symbols) or ECFP–RI (filled symbols) were incubated for 48 h with varying concentrations of ONC (A and B, squares), G88R RNase A (A, circles) or K7A/G88R RNase A (B, circles). Cytotoxicity was analyzed as described for Figure 1. IC50 values are listed in Table 2.
Table 2. IC50 values (µM) of ribonucleases for transiently transfected cells.
| Cell line | ONC | G88R RNase A | K7A/G88R RNase A |
|---|---|---|---|
| K-562 | 0.54 ± 0.04 | 5.7 ± 0.4 | 1.0 ± 0.1 |
| K-562 ECFP | 0.47 ± 0.02 | 4.2 ± 0.5 | 1.0 ± 0.1 |
| K-562 ECFP–RI | 0.51 ± 0.03 | 15 ± 2 | 2.5 ± 0.3 |
| HeLa | 0.83 ± 0.05 | >25a | 14 ± 1 |
| HeLa ECFP | 0.60 ± 0.04 | >25a | 11 ± 1 |
| HeLa ECFP–RI | 0.65 ± 0.06 | >25a | >25a |
aA protein concentration of 25 µM resulted in <50% cell death.
In HeLa cells, the toxicity of ribonucleases was not affected by ECFP production (Fig. 5B and Table 2). Although G88R RNase A was not toxic to wild-type or ECFP-producing HeLa cells, K7A/G88R RNase A was toxic to these cells, with IC50 values of 11 and 14 µM, respectively. HeLa cells that produced the ECFP–RI fusion protein were highly resistant to the toxicity of K7A/G88R RNase A. These cells were not susceptible, even at a K7A/G88R RNase A concentration of 25 µM. The toxicity of ONC was not affected by the production of ECFP–RI in HeLa cells.
DISCUSSION
The mechanism of ribonuclease-mediated cell death consists of two main steps: uptake into cells and catalytic cleavage of cellular RNA. Internalization of a ribonuclease is necessary but not sufficient for cytotoxicity. After internalization, ribonucleases must be able to degrade cellular RNA. The cytosol of every cell contains RI. When bound in a complex with RI, ribonucleases are not active catalysts. Thus, evading RI is necessary to maintain ribonucleolytic activity and correlates with the cytotoxicity of RNase A variants (19,20,28).
Cell susceptibility to toxic ribonucleases
The toxicity of ribonucleases towards nine transformed cell lines reveals several distinctions between G88R RNase A and ONC (Figs 1 and 2 and Table 1). First, G88R RNase A is a less potent cytotoxin than is ONC. At a concentration of 10 µM, ONC kills 90% of every cell population tested herein. The same concentration of G88R RNase A results in significant toxicity to only three cell lines: K-562, JAR and Jurkat. Second, the relative vulnerability of cell lines differs for the two ribonucleases. Cells that are highly susceptible to ONC are not necessarily vulnerable to G88R RNase A. For example, HL-60 cells are sensitive to ONC, with an IC50 value of 0.3 µM. Yet, HL-60 cells are insensitive to G88R RNase A at a concentration of 25 µM.
The different rank order of cell vulnerability to G88R RNase A and ONC suggests that the mechanisms of action of these two ribonucleases are not identical. Plasma clearance assays in mice showed that the organ distribution pattern of ONC differs from that of mammalian ribonucleases (15). Hence, ONC and G88R RNase A could preferentially target different cell types. They could also be internalized into different cell types with differing efficiency. In addition, they could degrade a different cellular substrate. In vitro the preferred homopolymeric substrate of ONC [poly(U)] does indeed differ from that of RNase A [poly(C)] (14). The in vivo substrate specificities of RNase A and ONC also differ. In Xenopus oocytes, RNase A inhibits protein synthesis by degrading rRNA, but ONC does so by degrading tRNA (48). Moreover, ONC and G88R RNase A have different affinities for RI (19,27). These and other differences could be manifested as differences in cytotoxic activity and cell type specificity.
In general, the cytotoxicity of ONC and G88R RNase A correlates with cellular growth rate (Table 1). The cancer-derived cell lines in this study have a faster population doubling time than do cells isolated from normal tissue. The former lines are vulnerable to both ONC and G88R RNase A. In contrast, cell lines derived from non-cancerous tissues are the most resistant to ONC, and completely resistant to G88R RNase A. One molecular explanation for cancer cell susceptibility is that the molar ratio of ethanolamine phospholipids to choline phospholipids in the plasma membrane increases upon neoplastic transformation (49). This increase results in a more anionic membrane that is more attractive to ribonucleases, which are cationic proteins [pI > 8.9 for ONC (50), pI = 9.3 for RNase A (30)].
Are some cells more susceptible to ribonuclease-mediated toxicity because of a low RI level? As one test of this hypothesis, we determined the cytoplasmic RI concentration in each of the nine transformed cell lines. Intracellular RI levels are difficult to measure accurately and can fluctuate within a cell line depending on the growth phase (51). We measured the RI level in asynchronous cells during log phase growth. To prevent RI oxidation and its subsequent degradation (34), we prepared cytoplasmic extracts in a reducing environment and in the presence of multiple protease inhibitors. Moreover, we compared intracellular RI levels by using immunoblots, so our data are not dependent on RI activity. RI levels differed by less than 2-fold among the cell lines tested herein (Fig. 3). Thus, variations in the cytoplasmic RI levels of cultured cells cannot explain the differences in susceptibility between the cell lines.
Characteristics other than RI level must account for the observed differences in the vulnerability of cells to ribonuclease-mediated toxicity. Two such characteristics could be cell surface affinity (vide supra) and internalization efficiency. Facilitating the internalization of a ribonuclease is known to enhance its cytotoxicity. For example, ribonucleases that are microinjected into the cytosol are more toxic than are ribonucleases added to cells externally (52). The toxicity of ribonucleases can also be enhanced by adding drugs that alter cellular routing (53,54) or by conjugating the ribonuclease to delivery molecules (55,56).
Role of cytoplasmic RI
The physiological relevance of RI concentration and its necessity as a modulator of intracellular ribonucleolytic activity is not clear. The literature is full of conflicting data (for reviews, see 21,22). RI expression seems to correlate with anabolic activity, such as cell proliferation, as increased RI levels are found both in rat liver after treatment with 2-acetamidofluorene to induce tumors (57) and in developing neonatal rats (58). Yet, RI levels are not elevated in SV-40-transformed hamster embryo fibroblast cells, stimulated HL-60 cells (59) or many hepatoma cell lines (60,61). Moreover, a high RI level actually decreases angiogenesis and tumor formation in mouse xenographs (62).
A definitive test for RI acting as a safeguard against invading ribonucleases requires the use of cells with different RI levels. In the absence of RI level variation, it is not possible to reveal a role for RI in cytotoxicity. To generate variation in RI levels, we overproduced RI as a fusion protein with ECFP (Fig. 4). By using ECFP as a fusion partner, we could easily enrich our cell population for those cells that overproduce the most RI. The ECFP–RI fusion protein is functional, as it can inhibit the ribonucleolytic activity of RNase A. Although oxidized and (presumably) misfolded, RI is degraded rapidly in cells (34), the ECFP–RI fusion protein can be detected 72 h after DNA transfection (data not shown).
RI does not modulate ONC-mediated cytotoxicity (Fig. 5 and Table 2). Thus, RI is not involved in regulating the intracellular ribonucleolytic activity of ONC. This finding provides the first evidence that RI has no affinity for ONC in a cell: every molecule of ONC that enters the cytosol is uninhibited in its ability to degrade cellular RNA. Hence, the only apparent barriers to ONC toxicity are its entry into the cytosol and its intrinsic ribonucleolytic activity there. Variation in the IC50 values of ONC for different cell lines (Table 1) are presumably due to differences in the cell surface binding and cytosolic internalization of ONC.
Although intrinsic RI levels do not vary (Fig. 3) and do not correlate with the vulnerability of cells to a toxic ribonuclease (Fig. 1 and Table 1), increasing RI levels decrease the vulnerability of cells to toxic variants of RNase A (Fig. 5 and Table 2). This apparent paradox can be resolved by considering that the ability of a ribonuclease to manifest its catalytic activity in the cytosol is related to its values of kcat/Km and Kd, which is the equilibrium dissociation constant of the RI·ribonuclease complex, as in equation 1 (2,28,63):
(kcat/Km)cyto = (kcat/Km)/[1 + ([RI]cyto/Kd)]1
By assuming that RI constitutes 0.08% of cytosolic protein (Fig. 3) and that the total concentration of protein in the cytosol is 250 mg/ml (64), the value of [RI]cyto can be estimated to be 4 µM. This value increases to 8 and 40 µM in transiently transfected K-562 and HeLa cells, respectively (Fig. 4C). The value of Kd for the RI·ONC complex is unknown, but has been estimated to be ≥1 µM (27). If indeed Kd >> 40 µM, then (kcat/Km)cyto ≈ kcat/Km for ONC in all cells tested herein. In contrast, Kd = 7.2 nM for the RI·K7A/G88R RNase A complex and Kd = 0.54 nM for the RI·G88R RNase A complex (20). Thus, Kd << [RI]cyto and (kcat/Km)cyto ≈ (kcat/Km) × Kd/[RI]cyto for these RNase A variants. Accordingly, the ribonucleolytic activity of RNase A variants in the cytosol, unlike that of ONC, is limited by the concentration of cytosolic RI. To be cytotoxic, an RNase A variant has the additional challenge of evading RI.
The cell lines tested herein do not differ dramatically in RI levels (Fig. 3). Yet, RI levels are known to vary in vivo, according to temporal and spatial regulation (for reviews, see 21,22). Moreover, RI is sensitive to oxidation and can therefore be regulated by the reduction potential of the cytosol (34). In addition, secretory ribonucleases circulate systemically through the blood (65,66). As a result, many cell types are exposed to these ribonucleases. Thus, variations in RI levels in vivo, as in our transient transfection experiments, could lead to enhanced cellular resistance or susceptibility to endogenous ribonucleases.
CONCLUSIONS
We have revealed new aspects of the cytotoxicity of secretory ribonucleases. We have measured their toxicity towards a variety of human cell lines and found that cellular growth rate correlates with ribonuclease susceptibility. Cytoplasmic RI levels do not vary substantially among these cell lines. Nonetheless, overproducing RI does diminish the toxicity of RNase A variants. This finding provides the first direct evidence that RI can act as an intracellular sentry against invading secretory ribonucleases. In contrast, the cytotoxicity of ONC is unaffected by RI levels, indicating that this ribonuclease (unlike toxic RNase A variants) cannot be made more toxic by decreasing its affinity for RI. Our findings provide a rationale for designing RNase A variants that are better able to evade RI, as well as choosing which tumor cell types to target with ribonuclease-based cancer chemotherapeutics.
Acknowledgments
ACKNOWLEDGEMENTS
We thank L. L. Kiessling for HL-60 and Jurkat cell lines and J. Hofsteenge for anti-porcine RI antibody. We thank K. M. Haigis, K. A. Dickson, E. A. Kersteen and R. L. Abel for contributive discussions and critical reading of the manuscript. We thank K. Schell and J. M. Batchelder at the University of Wisconsin–Madison Comprehensive Cancer Center for assistance with flow cytometry experiments.
REFERENCES
- 1.Raines R.T. (1998) Ribonuclease A. Chem. Rev., 98, 1045–1065. [DOI] [PubMed] [Google Scholar]
- 2.Raines R.T. (1999) Ribonuclease A: from model system to cancer chemotherapeutic. In Frey,P.A. and Northrop,D.B. (eds), Enzymatic Mechanisms. IOS Press, Washington, DC, pp. 235–249.
- 3.D’Alessio G. (1993) New and cryptic biological messages from RNases. Trends Cell Biol., 3, 106–109. [DOI] [PubMed] [Google Scholar]
- 4.Schein C.H. (1997) From housekeeper to microsurgeon: the diagnostic and therapeutic potential of ribonucleases. Nat. Biotechnol., 15, 529–536. [DOI] [PubMed] [Google Scholar]
- 5.Leland P.A. and Raines,R.T. (2001) Cancer chemotherapy—ribonucleases to the rescue. Chem. Biol., 8, 405–413. [DOI] [PMC free article] [PubMed] [Google Scholar]
- 6.Rybak S.M. and Newton,D.L. (1999) Natural and engineered cytotoxic ribonucleases: therapeutic potential. Exp. Cell Res., 253, 325–335. [DOI] [PubMed] [Google Scholar]
- 7.Matousek J. (2001) Ribonucleases and their antitumor activity. Comp. Biochem. Physiol., 129C, 175–191. [DOI] [PubMed] [Google Scholar]
- 8.Matousek J. (1973) The effect of bovine seminal ribonuclease (AS RNase) on cells of crocker tumour in mice. Experientia, 29, 858–859. [DOI] [PubMed] [Google Scholar]
- 9.Matousek J. (1975) Embryotoxic effect of bull seminal ribonuclease and tissue absorption studies in rats. J. Reprod. Fertil., 43, 171–174. [DOI] [PubMed] [Google Scholar]
- 10.Dostál J. and Matousek,J. (1972) Purification of aspermatogenic substance (AS) from the bull seminal vesicle fluid. J. Reprod. Fertil., 31, 273–275. [DOI] [PubMed] [Google Scholar]
- 11.Matousek J. (1994) Aspermatogenic effect of the bull seminal ribonuclease (BS RNase) in the presence of anti BS RNase antibodies in mice. Anim. Genet., 25 (suppl. 1), 45–50. [DOI] [PubMed] [Google Scholar]
- 12.Slavik T., Matousek,J., Fulka,J. and Raines,R.T. (2000) Effect of bovine seminal ribonuclease and bovine pancreatic ribonuclease A on bovine oocyte maturation. J. Exp. Zool., 287, 394–399. [PubMed] [Google Scholar]
- 13.Darzynkiewicz Z., Carter,S.P., Mikulski,S.M., Ardelt,W.J. and Shogen,K. (1988) Cytostatic and cytotoxic effect of Pannon (P-30 protein), a novel anticancer agent. Cell Tissue Kinet., 21, 169–182. [DOI] [PubMed] [Google Scholar]
- 14.Youle R.J. and D’Alessio,G. (1997) Antitumor RNases. In D’Alessio,G. and Riordan,J.F. (eds), Ribonucleases: Structures and Functions. Academic Press, New York, NY, pp. 491–514.
- 15.Vasandani V.M., Wu,Y.-N., Mikulski,S.M., Youle,R.J. and Sung,C. (1996) Molecular determinants in the plasma clearance and tissue distribution of ribonucleases of the ribonuclease A superfamily. Cancer Res., 56, 4180–4186. [PubMed] [Google Scholar]
- 16.Juan G., Ardelt,B., Li,X., Mikulski,S.M., Shogen,K., Ardelt,W., Mittelman,A. and Darzynkiewicz,Z. (1998) G1 arrest of U937 cells by onconase is associated with suppression of cyclin D3 expression, induction of p16INK4A, p21WAF1/CIP1 and p27KIP and decreased pRb phosphorylation. Leukemia, 12, 1241–1248. [DOI] [PubMed] [Google Scholar]
- 17.Ledoux L. (1955) Action of ribonuclease on certain ascites tumours. Nature, 175, 258–259. [DOI] [PubMed] [Google Scholar]
- 18.Ledoux L. (1955) Action of ribonuclease on two solid tumours in vivo. Nature, 176, 36–37. [DOI] [PubMed] [Google Scholar]
- 19.Leland P.A., Schultz,L.W., Kim,B.-M. and Raines,R.T. (1998) Ribonuclease A variants with potent cytotoxic activity. Proc. Natl Acad. Sci. USA, 98, 10407–10412. [DOI] [PMC free article] [PubMed] [Google Scholar]
- 20.Haigis M.C., Kurten,E.L. and Raines,R.T. (2002) KFERQ sequence in ribonuclease A-mediated cytotoxicity. J. Biol. Chem., 277, 11576–11581. [DOI] [PubMed] [Google Scholar]
- 21.Lee F.S. and Vallee,B.L. (1993) Structure and action of mammalian ribonuclease (angiogenin) inhibitor. Prog. Nucleic Acid Res. Mol. Biol., 44, 1–30. [DOI] [PubMed] [Google Scholar]
- 22.Hofsteenge J. (1997) Ribonuclease inhibitor. In D’Alessio,G. and Riordan,J.F. (eds), Ribonucleases: Structures and Functions. Academic Press, New York, NY, pp. 621–658.
- 23.Shapiro R. (2001) Cytoplasmic ribonuclease inhibitor. Methods Enzymol., 341, 611–628. [DOI] [PubMed] [Google Scholar]
- 24.Kobe B. and Deisenhofer,J. (1995) A structural basis of the interactions between leucine-rich repeats and protein ligands. Nature, 374, 183–186. [DOI] [PubMed] [Google Scholar]
- 25.Lee F.S., Shapiro,R. and Vallee,B.L. (1989) Tight-binding inhibition of angiogenin and ribonuclease A by placental ribonuclease inhibitor. Biochemistry, 28, 225–230. [DOI] [PubMed] [Google Scholar]
- 26.Vicentini A.M., Kieffer,B., Mathies,R., Meyhack,B., Hemmings,B.A., Stone,S.R. and Hofsteenge,J. (1990) Protein chemical and kinetic characterization of recombinant porcine ribonuclease inhibitor expressed in Saccharomyces cerevisiae. Biochemistry, 29, 8827–8834. [DOI] [PubMed] [Google Scholar]
- 27.Boix E., Wu,Y., Vasandani,V.M., Saxena,S.K., Ardelt,W., Ladner,J. and Youle,R.J. (1996) Role of the N terminus in RNase A homologues: differences in catalytic activity, ribonuclease inhibitor interaction and cytotoxicity. J. Mol. Biol., 257, 992–1007. [DOI] [PubMed] [Google Scholar]
- 28.Bretscher L.E., Abel,R.L. and Raines,R.T. (2000) A ribonuclease A variant with low catalytic activity but high cytotoxicity. J. Biol. Chem., 275, 9893–9896. [DOI] [PubMed] [Google Scholar]
- 29.del Cardayré S.B., Ribó,M., Yokel,E.M., Quirk,D.J., Rutter,W.J. and Raines,R.T. (1995) Engineering ribonuclease A: production, purification and characterization of wild-type enzyme and mutants at Gln11. Protein Eng., 8, 261–273. [DOI] [PubMed] [Google Scholar]
- 30.Sela M., Anfinsen,C.B. and Harrington,W.F. (1957) The correlation of ribonuclease activity with specific aspects of tertiary structure. Biochim. Biophys. Acta, 26, 502–512. [DOI] [PubMed] [Google Scholar]
- 31.Pace C.N., Vajdos,F., Fee,L., Grimsley,G. and Gray,T. (1995) How to measure and predict the molar absorption coefficient of a protein. Protein Sci., 4, 2411–2423. [DOI] [PMC free article] [PubMed] [Google Scholar]
- 32.Segel L.A. (1980) Mathematical Models in Molecular and Cellular Biology. Cambridge University, London, UK, pp. 502–522.
- 33.Malthus T.R. (1798) An Essay on the Principle of Population, as it Affects the Future Improvement of Society, with Remarks on the Speculations of Mr. Godwin, M. Condorcet and Other Writers. Johnson, London, UK.
- 34.Blázquez M., Fominaya,J.M. and Hofsteenge,J. (1996) Oxidation of sulfhydryl groups of ribonuclease inhibitor in epithelial cells is sufficient for its intracellular degradation. J. Biol. Chem., 271, 18638–18642. [DOI] [PubMed] [Google Scholar]
- 35.Bradford M.M. (1976) A rapid and sensitive method for the quantitation of microgram quantities of protein utilizing the principle of protein-dye binding. Anal. Biochem., 72, 248–252. [DOI] [PubMed] [Google Scholar]
- 36.Laemmli U.K. (1970) Cleavage of structural proteins during the assembly of the head of bacteriophage T4. Nature, 227, 680–685. [DOI] [PubMed] [Google Scholar]
- 37.Kelemen B.R., Klink,T.A., Behlke,M.A., Eubanks,S.R., Leland,P.A. and Raines,R.T. (1999) Hypersensitive substrate for ribonucleases. Nucleic Acids Res., 27, 3696–3701. [DOI] [PMC free article] [PubMed] [Google Scholar]
- 38.Nadano D., Yasuda,T., Takeshita,H., Uchide,K. and Kishi,K. (1994) Purification and characterization of human brain ribonuclease inhibitor. Arch. Biochem. Biophys., 312, 421–428. [DOI] [PubMed] [Google Scholar]
- 39.Blackburn P. and Moore,S. (1982) Pancreatic ribonuclease. Enzymes, XV, 317–433. [Google Scholar]
- 40.Heim R., Prasher,D.C. and Tsien,R.Y. (1994) Wavelength mutations and posttranslational autoxidation of green fluorescent protein. Proc. Natl Acad. Sci. USA, 91, 12501–12504. [DOI] [PMC free article] [PubMed] [Google Scholar]
- 41.Cubitt A.B., Heim,R., Adams,S.R., Boyd,A.E., Gross,L.A. and Tsien,R.Y. (1995) Understanding, improving and using green fluorescent proteins. Trends Biochem. Sci., 20, 448–455. [DOI] [PubMed] [Google Scholar]
- 42.Heim R. and Tsien,R.Y. (1996) Engineering green fluorescent protein for improved brightness, longer wavelengths and fluorescence resonance energy transfer. Curr. Biol., 6, 178–182. [DOI] [PubMed] [Google Scholar]
- 43.Tsien R.Y. (1998) The green fluorescent protein. Annu. Rev. Biochem., 67, 509–544. [DOI] [PubMed] [Google Scholar]
- 44.Kobe B. and Deisenhofer,J. (1996) Mechanism of ribonuclease inhibition by ribonuclease inhibitor protein based on the crystal structure of its complex with ribonuclease A. J. Mol. Biol., 264, 1028–1043. [DOI] [PubMed] [Google Scholar]
- 45.Papageorgiou A., Shapiro,R. and Acharya,K. (1997) Molecular recognition of human angiogenin by placental ribonuclease inhibitor—an X-ray crystallographic study at 2.0 Å resolution. EMBO J., 16, 5162–5177. [DOI] [PMC free article] [PubMed] [Google Scholar]
- 46.Yang F., Moss,L.G. and Phillips,G.N.,Jr (1996) The molecular structure of green fluorescent protein. Nat. Biotechnol., 14, 1246–1251. [DOI] [PubMed] [Google Scholar]
- 47.Haigis M.C., Haag,E.S. and Raines,R.T. (2002) Evolution of ribonuclease inhibitor by exon duplication. Mol. Biol. Evol., 19, 960–964. [DOI] [PubMed] [Google Scholar]
- 48.Lin J.J., Newton,D.L., Mikulski,S.M., Kung,H.F., Youle,R.J. and Rybak,S.M. (1994) Characterization of the mechanism of cellular and cell free protein synthesis inhibition by an anti-tumor ribonuclease. Biochem. Biophys. Res. Commun., 204, 156–162. [DOI] [PubMed] [Google Scholar]
- 49.Kojima K. (1993) Molecular aspects of the plasma membrane in tumor cells. Nagoya J. Med. Sci., 56, 1–18. [PubMed] [Google Scholar]
- 50.Ardelt W., Mikulski,S.M. and Shogen,K. (1991) Amino acid sequence of an anti-tumor protein from Rana pipiens oocytes and early embryos. J. Biol. Chem., 266, 245–251. [PubMed] [Google Scholar]
- 51.Garcîa-Segura J.M., Fominaya,J.M., Ferreras,M., Cid,C. and Gavilanes,J.G. (1991) On the biological function of the RNase–RNase inhibitor system. In de Llorens,R., Cuchillo,C.M., Nogués,M.V. and Parés,X. (eds), Structure, Mechanism and Function of Ribonucleases. Universitat Autónoma de Barcelona, Bellaterra, Spain, pp. 189–194.
- 52.Saxena S.K., Rybak,S.M., Winkler,G., Meade,H.M., McGray,P., Youle,R.J. and Ackerman,E.J. (1991) Comparison of RNases and toxins upon injection into Xenopus oocytes. J. Biol. Chem., 266, 21208–21214. [PubMed] [Google Scholar]
- 53.Wu Y., Saxena,S.K., Ardelt,W., Gadina,M., Mikulski,S.M., De Lorenzo,V., D’Alessio,G. and Youle,R.J. (1995) A study of the intracellular routing of cytotoxic ribonucleases. J. Biol. Chem., 270, 17476–17481. [DOI] [PubMed] [Google Scholar]
- 54.Wu Y., Mikulski,S.M., Ardelt,W., Rybak,S.M. and Youle,R.J. (1993) A cytotoxic ribonuclease. J. Biol. Chem., 268, 10686–10693. [PubMed] [Google Scholar]
- 55.Newton D.L., Ilercil,O., Laske,D.W., Oldfield,E., Rybak,S.M. and Youle,R.J. (1992) Cytotoxic ribonuclease chimeras. Targeted tumoricidal activity in vitro and in vivo. J. Biol. Chem., 267, 19572–19578. [PubMed] [Google Scholar]
- 56.Suzuki M., Saxena,S.K., Boix,E., Prill,R.J., Vasandani,V.M., Ladner,J.E., Sung,C. and Youle,R.J. (1999) Engineering receptor-mediated cytotoxicity into human ribonucleases by steric blockade of inhibitor interaction [see comments]. Nat. Biotechnol., 17, 265–270. [DOI] [PubMed] [Google Scholar]
- 57.Wojnar R.J. and Roth,J.S. (1965) Ribonuclease inhibitor and latent ribonuclease in rat liver during feeding of 2-acetamidofluorene. Cancer Res., 25, 1913–1918. [PubMed] [Google Scholar]
- 58.Suzuki Y. and Takahashi,Y. (1970) Developmental and regional variations in ribonuclease inhibitor activity in brain. J. Neurochem., 17, 1521–1524. [DOI] [PubMed] [Google Scholar]
- 59.Kyner D., Christman,J.K. and Acs,G. (1979) The effect of 12-O-tetradecanoyl-phorbol 13-acetate on the ribonuclease activity of circulating human lymphocytes. Eur. J. Biochem., 99, 395–399. [DOI] [PubMed] [Google Scholar]
- 60.Gauvreau D., Gagnon,C. and de Lamirande,G. (1974) Purification of a ribonuclease inhibitor from Novikoff hepatoma supernatant fraction. Cancer Res., 34, 2500–2503. [PubMed] [Google Scholar]
- 61.Roth J.S., Hilton,S. and Morris,H.P. (1964) Ribonuclease activity in some transplantable rat hepatomas. Cancer Res., 24, 294–301. [PubMed] [Google Scholar]
- 62.Botella-Estrada R., Malet,G., Revert,F., Dasi,F., Crespo,A., Sanmartin,O., Guillen,C. and Alino,S.F. (2001) Antitumor effect of B16 melanoma cells genetically modified with the angiogenesis inhibitor rnasin. Cancer Gene Ther., 8, 278–284. [DOI] [PubMed] [Google Scholar]
- 63.Futami J., Nukui,E., Maeda,T., Kosaka,M., Tada,H., Seno,M. and Yamada,H. (2002) Optimum modification for the highest cytotoxicity of cationized ribonuclease. J. Biochem. (Tokyo), 132, 223–228. [DOI] [PubMed] [Google Scholar]
- 64.Ellis R.J. (2001) Macromolecular crowding: obvious but underappreciated. Trends Biochem. Sci., 26, 597–604. [DOI] [PubMed] [Google Scholar]
- 65.Futami J., Tsushima,Y., Murato,Y., Tada,H., Sasaki,J., Seno,M. and Yamada,H. (1997) Tissue-specific expression of pancreatic-type RNases and RNase inhibitor in humans. DNA Cell Biol., 16, 413–419. [DOI] [PubMed] [Google Scholar]
- 66.Weickmann J.L., Olson,E.M. and Glitz,D.G. (1984) Immunological assay of pancreatic ribonuclease in serum as an indicator of pancreatic cancer. Cancer Res., 44, 1682–1687. [PubMed] [Google Scholar]