

Abstract
OBJECTIVE
Evaluations of screening or diagnostic tests sometimes incorporate measures of overall accuracy, diagnostic accuracy, or test efficiency. These terms refer to a single summary measurement calculated from 2 × 2 contingency tables that is the overall probability that a patient will be correctly classified by a screening or diagnostic test. We assessed the value of overall accuracy in studies of test validity, a topic that has not received adequate emphasis in the clinical literature.
DESIGN
Guided by previous reports, we summarize the issues concerning the use of overall accuracy. To document its use in contemporary studies, a search was performed for test evaluation studies published in the clinical literature from 2000 to 2002 in which overall accuracy derived from a 2 × 2 contingency table was reported.
MEASUREMENTS AND MAIN RESULTS
Overall accuracy is the weighted average of a test's sensitivity and specificity, where sensitivity is weighted by prevalence and specificity is weighted by the complement of prevalence. Overall accuracy becomes particularly problematic as a measure of validity as 1) the difference between sensitivity and specificity increases and/or 2) the prevalence deviates away from 50%. Both situations lead to an increasing deviation between overall accuracy and either sensitivity or specificity. A summary of results from published studies (N=25) illustrated that the prevalence-dependent nature of overall accuracy has potentially negative consequences that can lead to a distorted impression of the validity of a screening or diagnostic test.
CONCLUSIONS
Despite the intuitive appeal of overall accuracy as a single measure of test validity, its dependence on prevalence renders it inferior to the careful and balanced consideration of sensitivity and specificity.
Keywords: accuracy, screening, diagnostic test, research methods, sensitivity, specificity, validity
Various measures that incorporate both sensitivity and specificity are used to describe the validity of screening or diagnostic tests, including positive likelihood ratio, negative likelihood ratio, area under receiver operator characteristic (ROC) curve, and overall accuracy.1 Of these, the positive likelihood ratio, negative likelihood ratio, and area under ROC curve are based exclusively on sensitivity and specificity so that they—although perhaps exhibiting variability across different populations2—do not vary with disease prevalence. In contrast to these measures, overall accuracy does vary with disease prevalence.3
The prevalence-dependent nature of overall accuracy introduces problems serious enough to have led to warnings against its use.1,3–5 Reflecting this opinion, overall accuracy does not figure among the useful measures for evaluating a clinical test as reported in the Harriet Lane Handbook, a widely used pediatric manual.6 Other authors, however, have either supported the notion that overall accuracy should figure prominently in the clinician's assessment of a test's usefulness,7 or have included overall accuracy as a method of evaluating test validity without addressing its limitations.8 The lack of awareness of such conflicting views on overall accuracy was emphasized in a recent clinical test evaluation study where overall accuracy was presented and utilized as if it were a newly derived—and useful—measure.9
We are not aware of any reports that have focused on the practice—and pitfalls—of using overall accuracy as a measure of test validity. The present investigation was carried out to document that overall accuracy is being used in the contemporary clinical literature and to describe the practical implications and caveats of the fact that overall accuracy is dependent on disease prevalence. Selected examples from the recent clinical literature are used to illustrate how overall accuracy is being used in contemporary clinical reports and its potential detriment to the understanding of the strengths and limitations of diagnostic and screening tests.
METHODS
The conventional data layout for the 2 × 2 contingency table used to calculate sensitivity and specificity, along with relevant formulae, are shown in Table 1. Sensitivity refers to the probability that a person with the disease will test positive. Specificity refers to the probability that a disease-free individual will test negative. Overall accuracy is the probability that an individual will be correctly classified by a test; that is, the sum of the true positives plus true negatives divided by the total number of individuals tested. Hidden in this formulation is the fact that, as shown in Table 1, overall accuracy represents the weighted average of sensitivity and specificity, where sensitivity is weighted by the prevalence (p) of the outcome in the study population, and specificity is weighted by the complement of the prevalence (1 − p).3
Table 1.
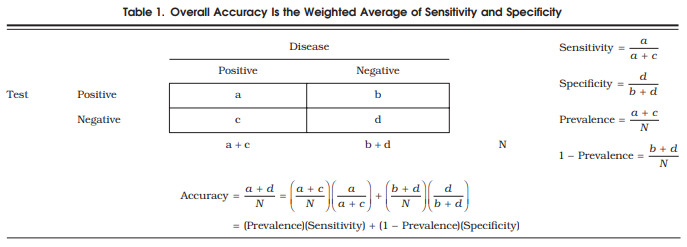
Overall Accuracy Is the Weighted Average of Sensitivity and Specificity.
Using the formula for overall accuracy in Table 1, the values for overall accuracy were calculated and graphed for a specific range of values for sensitivity, specificity, and prevalence (Fig. 1). The specific combinations of values for sensitivity, specificity, and prevalence were obtained by starting with specificity equal to 100%, sensitivity equal to 0%, and prevalence equal to 0%. For each percent increase in prevalence (from 0% to 100%), sensitivity increased by 1% and specificity decreased by 1%. This specific set of values was selected to illustrate the implications of using overall accuracy as a measure of test validity because it depicts the most extreme scenarios for which overall accuracy is problematic.
FIGURE 1.

The relationship of sensitivity, specificity, and prevalence to the overall accuracy of a screening or diagnostic test.
A literature search was conducted to identify recent examples of published clinical research that portray the potential pitfalls of overall accuracy. This literature search did not aim to represent a systematic review of the extent of the use of overall accuracy. The purpose was merely to document that overall accuracy is in fact being used in the contemporary medical literature, and the studies identified then provided real life examples of the misleading use of overall accuracy. The search period was limited to 2000 through 2002 simply to document that this is not an old issue that has been resolved but is a problem that is applicable today. Studies evaluating diagnostic or screening tests were identified through a medline search using the terms accuracy, test, diagnostic, screening, sensitivity, and specificity in various combinations. Abstracts from studies published in the years 2000 through 2002 were reviewed online for mention of the key words accuracy, sensitivity, and specificity, with special attention given to studies mentioning accuracy, accurate, or percentage of correct diagnoses with no accompanying explanation. The first 50 studies whose abstracts met these requirements were further reviewed for the following criteria: 1) reported measures of sensitivity, specificity, and overall accuracy, derived or derivable from 2 × 2 contingency tables, and not derived exclusively using ROC methodology; 2) reported study-specific disease prevalence or provided the data for its derivation; and 3) provided a distribution of disease prevalence spread from 5% to 90%. A final number of 25 studies out of the 50 studies reviewed met these criteria. As given in Table 1, the disease prevalence in each study was defined as the number of patients with the disease divided by the total number of patients in the study. The published data from each study were utilized to verify that reported measures of sensitivity, specificity, and overall accuracy adhered to the Table 1 formulae.
The deviations of overall accuracy from sensitivity and specificity were quantified together as the ratio of the absolute value of the difference between accuracy and sensitivity to the absolute value of the difference between accuracyand specificity. That is:. For graphical pur poses, ratios were transformed by the log10. This measure, , which we refer to as validity deviation, quantifies the degree to which overall accuracy is closer to sensitivity/further from specificity (validity deviation values <0) or closer to specificity/further from sensitivity (validity deviation values >0). The greater the validity deviation differs from 0, the greater the discrepancy between overall accuracy and sensitivity or specificity. The ratio is undefined when sensitivity equals specificity (i.e., overall accuracy is equal to both). An appealing feature of the validity deviation is that, for all defined values, its value is constant for a given prevalence. The data from the studies ascertained in the literature search were used to plot the calculated values of validity deviation versus prevalence for each study. For comparison purposes, the expected values were plotted based on estimates of prevalence ranging from 1% to 99%. Validity deviation is introduced only as a tool for illustrating the deviations of overall accuracy from sensitivity and specificity, not as a clinical measure or guide.
RESULTS
Figure 1 shows a graphic illustration of overall accuracy varying with hypothetical combinations, described above, of specificity, sensitivity, and prevalence. This figure highlights a few major points. First, the less prevalent the disease, the greater the weight applied to specificity in calculating overall accuracy; conversely, the more prevalent the disease, the greater the weight applied to sensitivity. Second, extreme differences in sensitivity and specificity under circumstances where disease prevalence is very low or very high lead to overall accuracy deviating considerably from sensitivity or specificity, respectively.
In practice, such large differences between test sensitivity and test specificity at the extremes of disease prevalence as shown in Fig. 1 may occur only rarely, but even more moderate examples pose concerning disparities between overall accuracy and sensitivity or specificity. Table 2 lists prevalence, sensitivity, specificity, and overall accuracy values reported in the studies ascertained in the search of the clinical literature.10–34 The 25 studies are ordered according to study-specific disease prevalence, demonstrating that disease prevalence varies widely in clinical studies. These data reiterate the point that overall accuracy is influenced more heavily by specificity when the prevalence is less than 50%, and by sensitivity when the prevalence is greater than 50%. These actual clinical applications thus show that overall accuracy can provide a misleading portrait of the validity of a test. These studies represent actual examples of the potential divergence between sensitivity, specificity, and overall accuracy, but cannot be interpreted as a comprehensive assessment of the current research on the validity of new diagnostic or screening tests. However, the ascertainment of these 25 studies presenting overall accuracy estimates calculated from 2 × 2 contingency tables provides evidence that overall accuracy permeates the clinical literature despite its inherent problems.
Table 2.
Selected Examples of the Use of Overall Accuracy Published in the Clinical Literature from 2000 Through 2002
| Reference | Sample Size | Outcome | Test | Prev. (%)* | Sens. (%) | Spec. (%) | Acc. (%) |
|---|---|---|---|---|---|---|---|
| Tong et al.10 | 602 | Liver cancer | α-fetoprotein | 5 | 41 | 95 | 94 |
| McFarland et al.11 | 419 | Superior labral anterior-posterior lesions | Anterior slide | 9 | 8 | 84 | 77 |
| Active compression | 9 | 47 | 55 | 54 | |||
| Compression rotation | 10 | 24 | 76 | 71 | |||
| Krettek et al.12 | 157 | Amputation | Mangled extremity severity score | 11 | 67 | 96 | 93 |
| Postema et al.13 | 103 | Invasive cervical carcinoma | Physical examination | 20 | 44 | 100 | 89 |
| MRI observer 1 | 20 | 89 | 82 | 84 | |||
| MRI observer 2 | 20 | 89 | 64 | 69 | |||
| Yang et al.14 | 43 | Cervical carcinoma metastasis | Dynamic helical CT | 22 | 65 | 97 | 90 |
| Dynamic MR imaging | 22 | 71 | 90 | 86 | |||
| Tsatalpas et al.15 | 21 | Malignant germ cell tumors | Supradiaphragmatic CT | 24 | 60 | 100 | 90 |
| Jee et al.16 | 80 | Superior labral anterior- posterior lesions | MR arthrography reader 3 | 31 | 84 | 69 | 74 |
| Koide et al.17 | 272 | Significant coronary stenosis | Treadmill ECG, females | ||||
| ST-segment depression | 31 | 81 | 68 | 72 | |||
| QT dispersion after exercise | 31 | 77 | 88 | 84 | |||
| Aslam et al.18 | 100 | Ovarian cancer | Models for diagnosis | ||||
| Logistic regression 1 | 33 | 45 | 93 | 77 | |||
| Logistic regression 2 | 33 | 9 | 99 | 69 | |||
| Logistic regression 3 | 33 | 73 | 91 | 85 | |||
| Yeoh and Chan19 | 136 | Thyroid nodule assessment | Fine needle aspiration | 33 | 56 | 90 | 79 |
| Vicini et al.20 | 1,094 | Prostate carcinoma | Biochemical failure | ||||
| Two consecutive rises | 34 | 86 | 61 | 64 | |||
| Three consecutive rises | 34 | 66 | 76 | 75 | |||
| Four consecutive rises | 34 | 46 | 87 | 81 | |||
| Elhendy et al.21 | 240 | Coronary artery disease, multivessel | Single photon emission tomography | 35 | 52 | 93 | 79 |
| Viegi et al.22 | 1,727 | Any chronic respiratory symptom/disease | Lung function test | ||||
| Clinical criteria | 37 | 26 | 64 | 64 | |||
| European Respiratory Soc. | 38 | 19 | 92 | 64 | |||
| American Thoracic Society | 41 | 53 | 69 | 62 | |||
| Nunes et al.23 | 454 | Breast cancer | MR | ||||
| Model w/o new features | 42 | 96 | 75 | 84 | |||
| Expanded model | 42 | 96 | 80 | 87 | |||
| Flamen et al.24 | 75 | Stage IV esophageal cancer | PET | 46 | 74 | 90 | 82 |
| CT | 46 | 41 | 83 | 64 | |||
| Endoscopic ultrasound | 46 | 42 | 94 | 71 | |||
| Koide et al.17 | 272 | Significant coronary stenosis | Treadmill ECG, total: | ||||
| ST-segment depression | 47 | 66 | 72 | 69 | |||
| QT dispersion after exercise | 47 | 76 | 86 | 81 | |||
| Sone et al.25 | 92 | Small cell lung cancer | Chest X-ray | 48 | 23 | 96 | 61 |
| Koide et al.17 | 272 | Significant coronary stenosis | Treadmill ECG, men | ||||
| ST-segment depression | 53 | 62 | 74 | 68 | |||
| QT dispersion after exercise | 53 | 75 | 85 | 80 | |||
| Wong et al.26 | 294 | Helicobacter pylori infection | Histology | 55 | 100 | 100 | 100 |
| 13 C-urea breath test | 55 | 93 | 97 | 95 | |||
| Lin et al.27 | 33 | Postsurgical abdominal infection | Gallium scan | 55 | 100 | 80 | 90.9 |
| C-reactive protein | 55 | 100 | 53 | 79 | |||
| White blood cell count | 55 | 44 | 80 | 61 | |||
| Ear temperature | 55 | 61 | 87 | 73 | |||
| Ahmad et al.28 | 89 | Pancreatic cancer regional lymph node metastases | Endoscopic ultrasound nodal staging | 63 | 49 | 63 | 54 |
| Meyer et al.29 | 47 | Brain tumor | FDG-PET: visual grading scale, region of interest ratios | 65 | 83 | 94 | 87 |
| Tumor/gray matter | 65 | 83 | 63 | 76 | |||
| Tumor/white matter | 65 | 93 | 75 | 87 | |||
| Ogawa et al.30 | 130 | Heart disease | Chest radiography | 66 | 66 | 89 | 74 |
| Lokeshwar et al.31 | 111 | Bladder cancer recurrence | BTA-Stat | 76 | 94 | 63 | 87 |
| Gurleyik et al.32 | 77 | Acute appendicitis | Interleukin-6 measurement | 83 | 84 | 46 | 78 |
| Greco et al.33 | 167 | Breast cancer | PET: T2 axillary metastases | 71 | 98 | 85 | 94 |
| Colao et al.34 | 84 | Cushing's syndrome | MR | 88 | 45 | 87 | 50 |
| CT | 90 | 37 | 75 | 40 |
Prevalence: confirmed number of cases of the disease of interest divided by the total study population.
Prev., prevalence; Sens., sensitivity; Spec., specificity; Acc., accuracy; CT, computed tomography; ECG, electrocardiogram; MR, magnetic resonance; MRI, magnetic resonance imaging; PET, positron emission tomography; FDG, fluoride-18 fluordeoxyglucose.
For each of the studies summarized in Table 2, Fig. 2 shows the calculated values of the validity deviation measure plotted against the reported prevalence. The validity deviation values calculated from the selected studies may differ slightly from the expected validity deviation values across the spectrum of disease prevalence estimates due to rounding. This close fit emphasizes the fact that the formula for overall accuracy stated in Table 1, which shows the prevalence-dependent nature of overall accuracy, applies to the estimates of overall accuracy reported in the selected published studies. The Fig. 2 results also synthesize the results summarized in Table 2 to visually demonstrate that overall accuracy is most problematic as a measure of test validity when the prevalence is very low or very high. When prevalence is low, overall accuracy more closely resembles specificity (validity deviation >0); when prevalence is high, overall accuracy more closely resembles sensitivity (validity deviation <0). Specifically, the combination of prevalence as a weighting factor with values of sensitivity that differed appreciably from specificity leads to overall accuracy deviating from sensitivity, specificity, or both.
FIGURE 2.

The relationship of prevalence to validity deviationlog , showing the prevalence-dependent trendof overall accuracy in relation to sensitivity and specificity, from data in 25 published studies of various screening and diagnostic tests, and the expected trend.
DISCUSSION
The explicit dependence of overall accuracy on disease prevalence renders it a problematic descriptor of test validity. Despite its intuitive appeal as a single summary estimate of test validity, overall accuracy blurs the distinction between sensitivity and specificity, allowing the relative importance of each to be arbitrarily dictated by the level of disease prevalence.
The following examples illustrate the drawback of placing credence in overall accuracy. At a cutoff point of ≥24 ng/ml, the α-fetoprotein (AFP) test for hepatocellular carcinoma had an accuracy of 94% and specificity of 95%.10 The high overall accuracy gives a false impression of the AFP test's usefulness in detecting liver cancer, as the test's sensitivity was 41%. The disparity between the AFP test's accuracy and sensitivity is explained by the low prevalence (5%) of liver cancer in the study population, which leads to a dramatically asymmetrical weighting of the test's high specificity in the calculation of overall accuracy. Now consider a study of interleukin-6 (IL-6) as a test for acute appendicitis in a population where the disease prevalence was high (83%).32 The IL-6 test had a sensitivity of 84% and a specificity of 46%. The high prevalence of acute appendicitis in the study population led to an asymmetric weighting of the test's sensitivity so that the overall accuracy was 78%. The low specificity of the IL-6 test would be overlooked if one focused solely on its reported accuracy.
These examples also point toward another problem: estimates of overall accuracy may be particularly misleading when obtained from studies where the disease prevalence in the study population diverges considerably from the prevalence in the actual clinical population where the test will be applied (target population). Under such circumstances, the weights applied to sensitivity and specificity in estimating overall accuracy will differ from those that would apply if prevalence estimates from the target population were used. In theory, sensitivity and specificity represent intrinsic properties of a test. However, differences in sensitivity and specificity may also arise if the spectrum of disease severity between the study population and the target population differ.35 For example, testing for hypercholesterolemia in a population where most of the true positives were in the borderline disease range would yield a lower estimate of sensitivity than in a population of individuals with hypercholesterolemia who had more severe disease.
Only in rare instances will overall accuracy closely approximate both sensitivity and specificity, such as when sensitivity and specificity are equal or nearly equal each other, or when disease prevalence is close to 50%. Even in these rare circumstances, overall accuracy may be useful only to the extent that sensitivity and specificity are equally important. Judging the clinical utility of a diagnostic or screening test requires carefully weighing both the test's sensitivity and specificity. Ideally, balancing the trade-offs between sensitivity and specificity entails factoring in such criteria as the case fatality rate of the disease, the likelihood that screening will occur on a regular basis, and the physical, psychological, and economic costs associated with false positive or false negative tests. Overall accuracy allows the relative importance of sensitivity and specificity to be arbitrarily determined by the prevalence of the outcome in the study population, artificially usurping the clinician's judgment regarding the important substantive criteria that should form the basis for making these decisions.
The appeal of overall accuracy as a descriptor of test validity is that it provides a single summary estimate to assess the usefulness of a screening or diagnostic test. However, the prevalence-dependent nature of overall accuracy obviates its value as a descriptor of test validity. In certain instances, overall accuracy as calculated from 2 × 2 contingency tables gives a distorted impression of the validity of a test; this provides ample justification to avoid using it.
Acknowledgments
This research was supported by funding from the National Institute of Aging (5U01AG018033), National Cancer Institute (5U01CA086308), and National Institute of Environmental Health Sciences (P30 ES03819). Dr. Alberg is a recipient of a KO7 award from the National Cancer Institute (CA73790).
REFERENCES
- 1.Shapiro DE. The interpretation of diagnostic tests. Stat Methods Med Res. 1999;8:113–34. doi: 10.1177/096228029900800203. [DOI] [PubMed] [Google Scholar]
- 2.Begg CB. Biases in the assessment of diagnostic tests. Stat Med. 1987;6:411–23. doi: 10.1002/sim.4780060402. [DOI] [PubMed] [Google Scholar]
- 3.Metz CE. Basic principles of ROC analysis. Semin Nucl Med. 1978;8:283–98. doi: 10.1016/s0001-2998(78)80014-2. [DOI] [PubMed] [Google Scholar]
- 4.Weiss N. 2nd ed. New York, NY: Oxford University Press; 1996. Clinical Epidemiology: The Study of the Outcome of Illness; pp. 20–1. [Google Scholar]
- 5.Grimes DA, Schulz KF. Uses and abuses of screening tests. Lancet. 2002;359:881–4. doi: 10.1016/S0140-6736(02)07948-5. [DOI] [PubMed] [Google Scholar]
- 6.Siberry GK. Conversion formulas and biostatistics. In: Siberry GK, Iannone R, editors. The Harriet Lane Handbook. A Manual for Pediatric House Officers. 15th ed. St. Louis, Mo: Mosby; 2000. pp. 181–6. [Google Scholar]
- 7.Galen RS, Gambino SR. New York, NY: John Wiley & Sons; 1975. Beyond Normality: The Predictive Value and Efficiency of Medical Diagnoses. [Google Scholar]
- 8.Wassertheil-Smoller S. 2nd ed. New York, NY: Springer-Verlag; 1995. Biostatistics and Epidemiology: A Primer for Health Professionals; pp. 118–28. [Google Scholar]
- 9.Nardin RA, Rutkove SB, Raynor EM. Diagnostic accuracy of electrodiagnostic testing in the evaluation of weakness. Muscle Nerve. 2002;26:201–5. doi: 10.1002/mus.10192. [DOI] [PubMed] [Google Scholar]
- 10.Tong MJ, Blatt LM, Kao VWC. Surveillance for hepatocellular carcinoma in patients with chronic viral hepatitis in the United States of America. J Gastroenterol Hepatol. 2001;16:553–9. doi: 10.1046/j.1440-1746.2001.02470.x. [DOI] [PubMed] [Google Scholar]
- 11.McFarland EG, Kim TK, Savino RM. Clinical assessment of three common tests for superior labral anterior-posterior lesions. Am J Sports Med. 2002;30:810–5. doi: 10.1177/03635465020300061001. [DOI] [PubMed] [Google Scholar]
- 12.Krettek C, Seekamp A, Kontopp H, Tscherne H. Hannover Fracture Scale ’98—re-evaluation and new perspectives of an established extremity salvage score. Injury. 2001;32:317–28. doi: 10.1016/s0020-1383(00)00201-1. [DOI] [PubMed] [Google Scholar]
- 13.Postema S, Pattynama P, van den Berg-Huysmans A, Peters LW, Kenter G, Trimbos JB. Effect of MRI on therapeutic decisions in invasive cervical carcinoma. Gynecol Oncol. 2000;79:485–9. doi: 10.1006/gyno.2000.5986. [DOI] [PubMed] [Google Scholar]
- 14.Yang WT, Lam WWM, Yu MY, Cheung TH, Metreweli C. Comparison of dynamic helical CT and dynamic MR imaging in the evaluation of pelvic lymph nodes in cervical carcinoma. Am J Roentgenol. 2000;175:759–66. doi: 10.2214/ajr.175.3.1750759. [DOI] [PubMed] [Google Scholar]
- 15.Tsatalpas P, Beuthein-Baumann B, Kropp J, et al. Diagnostic value of 18F-FDG positron emission tomography for detection and treatment control of malignant germ cell tumors. Urol Int. 2002;68:157–63. doi: 10.1159/000048442. [DOI] [PubMed] [Google Scholar]
- 16.Jee W, McCauley TR, Katz LD, Matheny JM, Ruwe PA, Daigneault JP. Superior labral anterior posterior (SLAP) lesions of the glenoid labrum: reliability and accuracy of MR arthrography for diagnosis. Radiology. 2001;218:127–32. doi: 10.1148/radiology.218.1.r01ja44127. [DOI] [PubMed] [Google Scholar]
- 17.Koide Y, Yotsukura M, Yoshino H, Ishikawa K. Usefulness of QT dispersion immediately after exercise as an indicator of coronary stenosis independent of gender or exercise-induced ST-segment depression. Am J Cardiol. 2000;86:1312–7. doi: 10.1016/s0002-9149(00)01233-9. [DOI] [PubMed] [Google Scholar]
- 18.Aslam N, Banerjee S, Carr JV, Savvas M, Hooper R, Jurkovic D. Prospective evaluation of logistic regression models for the diagnosis of ovarian cancer. Obstet Gynecol. 2000;96:75–80. doi: 10.1016/s0029-7844(00)00835-8. [DOI] [PubMed] [Google Scholar]
- 19.Yeoh GPS, Chan KW. The diagnostic value of fine-needle aspiration cytology in the assessment of thyroid nodules: a retrospective 5-year analysis. Hong Kong Med J. 1999;5:140–4. [PubMed] [Google Scholar]
- 20.Vicini FA, Kestin LL, Martinez AA. The correlation of serial prostate specific antigen measurements with clinical outcome after external beam radiation therapy of patients for prostate carcinoma. Cancer. 2000;88:2305–18. doi: 10.1002/(sici)1097-0142(20000515)88:10<2305::aid-cncr15>3.0.co;2-3. [DOI] [PubMed] [Google Scholar]
- 21.Elhendy A, van Domberg RT, Sozzi FB, Poldermans D, Bax JJ, Roelandt JRTC. Impact of hypertension on the accuracy of exercise stress myocardial perfusion imaging for the diagnosis of coronary artery disease. Heart. 2001;85:655–61. doi: 10.1136/heart.85.6.655. [DOI] [PMC free article] [PubMed] [Google Scholar]
- 22.Viegi G, Pedreschi M, Pistelli F, et al. Prevalence of airways obstruction in a general population: European Respiratory Society versus American Thoracic Society definition. Chest. 2000;117(suppl 2):339–45. doi: 10.1378/chest.117.5_suppl_2.339s. [DOI] [PubMed] [Google Scholar]
- 23.Nunes LW, Schnall MD, Orel SG. Update of breast MR imaging architectural interpretation model. Radiology. 2001;219:484–94. doi: 10.1148/radiology.219.2.r01ma44484. [DOI] [PubMed] [Google Scholar]
- 24.Flamen P, Lerut A, Van Cutsem E, et al. Utility of positron emission tomography for the staging of patients with potentially operable esophageal carcinoma. J Clin Oncol. 2000;18:3202–10. doi: 10.1200/JCO.2000.18.18.3202. [DOI] [PubMed] [Google Scholar]
- 25.Sone S, Li F, Yang Z-G, et al. Characteristics of small lung cancers invisible on conventional chest radiography and detected by population based screening using spiral CT. Br J Radiol. 2000;73:137–45. doi: 10.1259/bjr.73.866.10884725. [DOI] [PubMed] [Google Scholar]
- 26.Wong BC, Wong WM, Wang WH, et al. An evaluation of invasive and non-invasive tests for the diagnosis of Helicobactor pylori infection in Chinese. Aliment Pharmacol Ther. 2001;15:505–11. doi: 10.1046/j.1365-2036.2001.00947.x. [DOI] [PubMed] [Google Scholar]
- 27.Lin WY, Chao TH, Wang SJ. Clinical features and gallium scan in the detection of post-surgical infection in the elderly. Eur J Nucl Med Mol Imaging. 2002;29:371–5. doi: 10.1007/s00259-001-0727-8. [DOI] [PubMed] [Google Scholar]
- 28.Ahmad NA, Lewis JD, Ginsberg GG, Rosato EF, Morris JB, Kochman ML. EUS in preoperative staging of pancreatic cancer. Gastrointest Endosc. 2000;52:463–8. doi: 10.1067/mge.2000.107725. [DOI] [PubMed] [Google Scholar]
- 29.Meyer PT, Schreckenberger M, Spetzger U, et al. Comparison of visual and ROI-based brain tumor grading using 18F-FDG PET: ROC analysis. Eur J Nucl Med Mol Imaging. 2001;28:165–74. doi: 10.1007/s002590000428. [DOI] [PubMed] [Google Scholar]
- 30.Ogawa K, Oida A, Sugimura H, et al. Clinical significance of blood brain natriuretic peptide level measurement in the detection of heart disease in untreated outpatients. Circ J. 2002;66:122–6. doi: 10.1253/circj.66.122. [DOI] [PubMed] [Google Scholar]
- 31.Lokeshwar VB, Schroeder GL, Selzer MG, et al. Bladder tumor markers for monitoring recurrence and screening comparison of hyaluronic acid-hyaluronidase and BTA-stat tests. Cancer. 2002;95:61–72. doi: 10.1002/cncr.10652. [DOI] [PubMed] [Google Scholar]
- 32.Gurleyik G, Gurleyik E, Cetinkaya F, Unalmiser S. Serum interleukin-6 measurement in the diagnosis of acute appendicitis. Aust NZ J Surg. 2002;72:665–7. doi: 10.1046/j.1445-2197.2002.02516.x. [DOI] [PubMed] [Google Scholar]
- 33.Greco M, Crippa F, Agresti R, et al. Axillary lymph node staging in breast cancer by 2-fluoro-2-deoxy-D-glucose-positron emission tomography: clinical evaluation and alternative management. J Natl Cancer Inst. 2001;93:630–5. doi: 10.1093/jnci/93.8.630. [DOI] [PubMed] [Google Scholar]
- 34.Colao A, Faggiano A, Pivonello R, et al. Inferior petrosal sinus sampling in the differential diagnosis of Cushing's syndrome: results of an Italian multicenter study. Eur J Endocrinol. 2001;144:499–507. doi: 10.1530/eje.0.1440499. [DOI] [PubMed] [Google Scholar]
- 35.Szklo M, Nieto FJ. Epidemiology: Beyond the Basics. Gaithersburg, Md: Aspen Publishers, Inc.; 2000. [Google Scholar]