

Abstract
OBJECTIVE
To develop a hierarchical approach to cardiac risk stratification after treadmill testing.
PATIENTS
Clinical and treadmill test data were used to identify a patient population that may be candidates for further risk stratification with stress tomographic myocardial perfusion imaging. A prospective series of 3,620 medically treated patients (42% female, mean age 63 years) with a 2.5% mortality was identified (follow-up 2.5 ± SD 1.5 years).
MEASUREMENTS AND MAIN RESULTS
A Cox proportional hazards model was used to estimate a patient’s likelihood of cardiac death. Kaplan-Meier survival curves were used to estimate time to cardiac death by nuclear test results. Annual rates of cardiac death were 0.4% (n = 921), 1% (n = 2,498), and 1% (n = 201) for patients with low, intermediate, and high Duke treadmill scores (DTS). For patients with an intermediate DTS, multivariate estimators of cardiac death included the number of ischemic vascular territories (relative risk per defect 1.4, p = .01), the number of infarcted vascular territories (relative risk per defect 2.4, p = .00001), and the DTS (relative risk per unit 0.97, p = .00001), following adjustment for a patient’s pretest risk of coronary disease. For patients with an intermediate DTS, the presence of no, one or two, and three vascular territories with defects was associated with annual rates of cardiac death of 0.5%, 1.4%, and 2.5%, respectively (p < .0001). Kaplan-Meier survival curves exhibited a statistically worsening survival for patients with defects by 1 year after treadmill exercise.
CONCLUSIONS
For symptomatic patients with an intermediate treadmill test score, the exercise myocardial perfusion scan may be used to stratify their risk of cardiac death over 3 years of follow-up. Patient management may be efficiently guided by further outcome assessment, with an exercise nuclear scan for patients whose treadmill test score is intermediate.
Keywords: exercise testing, prognosis, coronary artery disease
Over the last few decades, a plethora of noninvasive modalities have become available to the primary care clinician, each adding incremental diagnostic information and, in most cases, an increased cost. Despite a variety of noninvasive test modalities, the low-cost exercise treadmill test provides several important prognosticators including markers of left ventricular dysfunction (i.e., impaired exercise tolerance, systolic blood pressure, or chronotropic incompetence) and signs of myocardial ischemia (i.e., ST depression or exertional chest pain).1–10 These markers have been shown to provide diagnostic and prognostic information in different patient samples.1–13 Based on an integrated exercise score, annual mortality for patients with a high-risk treadmill test result, defined as marked ST depression at a diminished exercise tolerance with chest pain, is approximately 5%.1, 2 Conversely, low-risk patients with good exercise tolerance and no electrocardiographic changes have a rate of cardiac death of less than 0.5% per year.1, 2 Current management strategies for patients whose treadmill test risk is intermediate are not yet defined. Therefore, as current evidence is insufficient to devise an efficient management strategy, it is expected that resource use patterns may vary widely.
One may devise a hierarchical testing strategy in which more expensive tests may be recommended following optimal risk stratification according to a less expensive test. For coronary disease screening this would include the use of a stress imaging modality (echocardiography or myocardial perfusion imaging) following risk stratification based on a routine exercise treadmill test. This provides a more efficient use of available low-cost data, thus optimizing the exercise treadmill test prior to referral to nuclear imaging. Accordingly, the purpose of this report is to investigate the ability of exercise myocardial perfusion tomographic imaging to incrementally risk stratify patients following optimal risk assessment using clinical history and exercise treadmill testing in a multicenter cohort of symptomatic patients.
METHODS
Patient Population
Our patient sample consisted of 3,620 symptomatic patients who underwent exercise treadmill testing and exercise myocardial perfusion imaging at Allegheny University for the Health Sciences, Cedars-Sinai Medical Center, and Duke University Medical Center. Data on patients included in this series have not been published in any previous series. Patients were included if they were symptomatic and excluded if they had significant valvular or congenital heart disease, recent myocardial infarction, a previous revascularization procedure, or an uninterpretable exercise electrocardiogram.
Clinical, Catheterization, and Follow-Up Data
Follow-up information was obtained by clinic visit, mailed questionnaire, or telephone interview at 6 months, 1 year, and yearly thereafter. The reasons for death were classified as cardiac versus noncardiac by a review committee unaware of the patient’s clinical or exercise data. Rates of 3-year loss to follow-up ranged from 0.0% to 4.3% for the participating sites. A minimum of 1-year follow-up was complete in 100% of surviving patients. Average follow-up (±SD) was 2.5 ± 1.5 years. Exact dates for death and revascularization procedures (for censoring) were obtained from the patients’ medical records and used for the survival analysis. A total of 83 cardiac deaths, 166 all-cause deaths, 127 early (i.e., ≤90 days posttesting) coronary artery bypass graft surgeries, 24 late coronary artery bypass graft surgeries, 108 early percutaneous transluminal coronary angioplasties, and 36 late percutaneous transluminal coronary angioplasties were documented throughout follow-up.
Exercise Treadmill Testing
All patients underwent symptom-limited exercise testing using the standard or modified (6.6% of patients) Bruce protocol. Resting heart rate, blood pressure, and 12-lead electrocardiograms were recorded in the supine and upright position before exercise. During each minute of exercise, heart rate and blood pressure measurements, as well as a 12-lead electrocardiogram were recorded. Exercise testing was discontinued if exertional hypotension, malignant ventricular arrhythmias, marked ST depression (≥3 mm), or limiting chest pain was reported. An abnormal exercise ST response was defined as at least 1 mm of horizontal or downsloping ST depression (J point + 80 ms) or at least 1 mm of ST segment elevation in leads without pathologic Q waves (excluding AVR lead).
Duke Treadmill Score
The equation for calculating the Duke treadmill score (DTS) is
where 0 = none, 1 = nonlimiting, and 2 = exercise limiting. Scores range from −20 to +15. Low risk is +5 or above, moderate-risk scores range from −10 to +4, and a high-risk score is −11 or lower.1, 2
Tomographic Imaging
Standard recommendations of each laboratory include witholding cardiac medications (i.e., β blockers) for 48 hours before testing. All patients underwent exercise myocardial perfusion tomographic imaging. Patients also underwent dual isotope and technetium-99m sestamibi imaging. For dual isotope imaging, thallium-201 (2.5–3.5 mCi) was injected intravenously at rest (dose variation based on patient weight). Rest thallium-201 imaging was initiated within 10 minutes after injection. Immediately following rest imaging, all patients performed a symptom-limited exercise protocol. At near maximal exercise, 20 –30 mCi of technetium-99m sestamibi was injected (dose is weight dependent), and exercise continued for one more minute following injection. Technetium-99m sestamibi was initiated within 30 minutes after isotope injection.12, 13 Of the 3,620 patients, 57% underwent dual isotope imaging and 43% underwent technetium-99m sestamibi imaging. Image interpretation was conducted blinded to the clinical history and treadmill test information, and each tomographic image was interpreted for the extent of ischemia (i.e., reversible) and infarct (i.e., fixed) abnormalities. The extent of perfusion abnormalities was scored using the coronary vascular territories including defects in the left anterior descending, right coronary artery, and left circumflex regions of the myocardium. Defects within the apex were scored as abnormal in the presence of a marked reduction in tracer uptake or when the perfusion abnormality extended to adjacent regions. A uniform scoring of the coronary vascular territories was adopted by all participating institutions.
Statistical Analysis
Descriptive statistics were generated using percentages for discrete variables and means and standard deviations for continuous variables. Categorical variables were compared by χ2analyses while continuous variables were compared with the DTS risk groups by analysis of variance. We assessed the utility of the DTS and stress myocardial perfusion scan for risk stratification using a Cox proportional hazards regression analysis for assessing individual relations among clinical history and exercise testing variables that assess time to cardiac death. Hazard ratios and 95% confidence intervals (CIs) were calculated for variables included in the model. Kaplan-Meier curves were used to compare time to cardiac death among the intermediate-risk DTS group by the myocardial perfusion defect extent. Patients undergoing coronary revascularization were included up to the time of their procedure and censored thereafter. The statistical significance of individual components was also assessed in the multivariate Cox model.
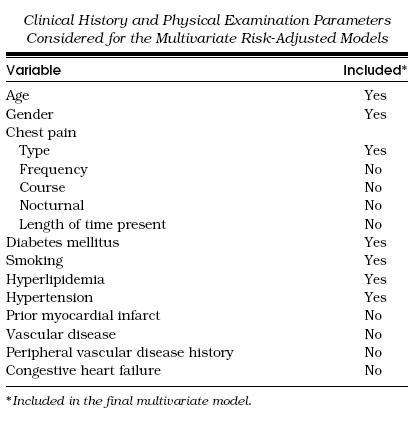
Regression analyses were performed in several stages. First, all clinical history and physical examination parameters were entered into the model to reflect the pretest probability or what was known about the patient prior to testing. All significant variables from the mortality model were considered and have been described elsewhere (see Appendix A for a list).14–16 Second, the DTS was added to the model. Finally, a full model that included the clinical history, DTS, and nuclear scan data was evaluated. To assess the incremental value of the exercise and nuclear test data, for survival, we calculated the difference in the log likelihood ratio χ2 statistic from the overall model with and without the additional piece of information. We also assessed the change in the model C-index in the incremental model analyses.
RESULTS
Study Populations
Of the 3,620 patients, 25.4%, 69.0%, and 5.6% were low, intermediate, and high risk, respectively, based on the DTS.Table 1 depicts the overall clinical history and stress nuclear characteristics based on the DTS. Low-risk patients were more likely female and younger, with a lower frequency of cardiac risk factorsthan intermediate-risk or high-risk patients. Low-risk patients also had a higher exercise heart rate, peak systolic blood pressure, and exercise duration as well as a lower rate of ST depression and exertional chest pain. Low-risk patients also had slightly less multivessel ischemia and infarction on their exercise nuclear scan (p < .001).
Table 1.
Frequency (Percentage) of Clinical History, Exercise, Nuclear Test Data, and Cardiac Death by Duke Treadmill Score Risk Groups for 3,620 Medically Treated Patients with Coronary Artery Disease*

Frequency of Outcome
Overall cardiac mortality was 2.5% at 2.5 ± 1.5 years of follow-up. Annual rates of cardiac death, myocardial infarction, and coronary revascularization by the extent of nuclear ischemia and infarction are depicted in Table 2 In general, higher rates of cardiac events and revascularization procedures were reported for patients with multivessel ischemia or infarction on nuclear tests. Annual rates of cardiac death were 0.4%, 1%, and 1% for patients who were low, intermediate, and high risk by DTS, respectively (p= .001).Figure 1 provides the frequency of cardiac mortality by treadmill test results. Among patients with a low-risk DTS, annual cardiac mortality was 0.3%, 0.4%, and 1.2%, respectively, for those with no defects, one or two vascular territories with defects, and three vascular territories with defects (p < .0001). Among patients with intermediate risk DTS, the annual cardiac mortality was 0.5%, 1.4%, and 2.5%, respectively, for those with no, one or two, and three vascular territories with defects (p < .0001). Similarly, among the 201 patients with a high-risk DTS, annual cardiac death rates were 0.4%, 1.1%, and 4.0%, respectively, for those with no, one or two, and three vascular territories with defects (p < .0001).
Table 2.
Annual Rates of Cardiac Events and Coronary Revascularization Procedures by the Extent of Nuclear Test Abnormalities

FIGURE 1.

Annual cardiac death rates (95% confidence intervals) by the exercise treadmill test score and exercise single photon emission computed tomography myocardial perfusion imaging results.
Kaplan-Meier risk-adjusted cardiac survival curves for the 2,498 patients with an intermediate-risk DTS are depicted in Figures 2 and 3. For the 69% of patients with an intermediate-risk DTS, no infarction was associated with a 3-year cardiac survival of 98% (Figure 2). A similar finding was noted for patients with no evidence of ischemia on their single photon emission computed tomography (SPECT) perfusion scan (Figure 3 By comparison, in Figure 2 the presence of one or more vascular territories with infarction was associated with a statistically lower rate of cardiac survival (p < .05) by 1 year after testing. Three-year cardiac survival was 93%, 85%, and 79%, respectively, for patients with one, two, and three vascular territories with infarction (p < .0001). By comparison, in Figure 3 the 3-year cardiac survival rate was 95%, 92%, and 90%, respectively, for patients with one, two, and three vascular territories with ischemia. Differences in survival were also noted by 1-year posttesting by the extent of ischemia on stress myocardial perfusion imaging.
FIGURE 2.

Kaplan-Meier survival curves by the number of infarcted vascular territories. Overall 3-year survival was 98%, 93%, 85%, and 79% for patients with no, one, two, and three vascular territories with infarction, respectively (p < .0001).
FIGURE 3.

Kaplan-Meier survival curves by the number of ischemic vascular territories. Overall 3-year survival was 98%, 95%, 92%, and 90% for patients with no, one, two, and three vascular territories with ischemia, respectively (p < .0001).
Multivariate Cox Proportional Hazards Model
Table 3 details the results of a risk-adjusted, multivariate Cox proportional hazards model estimating the likelihood of cardiac death in the 2,498 patients with an intermediate-risk DTS. The results of this analysis reveal that the strongest estimators of cardiac death, after adjusting for historical information, include the number of ischemic (p= .01) and infarcted vascular territories (p < .00001) as well as the DTS (p= .00001). For patients with an intermediate-risk DTS, a defect with ischemia increases the relative risk of cardiac death 1.4-fold (95% CI 1.1, 1.9). Similarly, a fixed defect increases a patient’s relative risk of cardiac death 2.4-fold (95% CI 1.8, 3.1). The relative risk for the DTS was 0.97 (95% CI 0.96, 0.98). When examining individual components of the DTS, for every minute decrement in exercise duration, the relative risk is 0.98 (95% CI 0.96, 0.99) or 2% higher risk of cardiac death per minute decrement in exercise duration. For every 3-minute stage of exercise, the hazard ratio (95% CI) is depicted in Figure 4. Hazard ratios were higher for patients who had lower exercise stages; 1.36 for stage I, 1.27 for stage II, and 1.17 for stage III. Exertional ST depression and chest pain were of borderline statistical significance (p= .07 and p= .20). However, the presence of 2 mm or more of ST depression was associated with an increased risk of cardiac death (relative risk 1.3; 95% CI 1.1, 1.7; p= .008).
Table 3.
Multivariate Cox Proportional Hazards Model Estimating Likelihood of Cardiac Death for a Patient with an Intermediate Duke Treadmill Score*

FIGURE 4.

Hazard ratios (95% confidence intervals) for stage of exercise completed. Exercise duration was ≤3.0, 3.1–6.0, 6.1–9.0, 9.1–12.0, and ≥12.1 minutes for stages I, II, III, IV, and V, respectively. Increasing hazard ratios were noted for patients with lower exercise stages; 1.36 for stage I, 1.27 for stage II, and 1.17 for stage III.
In order to assess the incremental value of exercise treadmill and nuclear test information in patients with an intermediate-risk DTS, three separate models of (1) clinical history, (2) clinical history and DTS, and (3) the combination of historical, DTS, and nuclear data were compared for improvement in model χ2and model C-index (Figure 5). When the DTS was added to the multivariable Cox model, it provided a statistically significant improvement in classifying risk of cardiac death by a change in the model χ2and C-index (p < .0001). The C-index improved from 0.76 (model χ2= 18.7) to 0.86 (model χ2= 27.6). Further improvement was noted when nuclear data were added to the Cox proportional hazards model (p < .0001). The C-index was 0.91 when nuclear test data were added to the model estimating cardiac death (model χ2= 55).
FIGURE 5.

Supplementary value of the Duke treadmill score (DTS) and single photon emission computed tomography imaging results in patients with an intermediate-risk score for estimation of cardiac death. By the improvement in model χ2, both the DTS and the nuclear test information provided a statistically significant improvement in model χ2. The percentage of information content was 34%, 16.2%, and 49.8% for clinical history, DTS, and for evidence of ischemia and infarction on the exercise nuclear scan, respectively. For the model C-index, there was a significant improvement in model classification ability when the DTS (0.86) and nuclear test information (0.91) were added to the model.
DISCUSSION
The results of this report are essential to a movement within cardiovascular medicine to base clinical practice and guidelines development on definitive outcome assessment.17 The goal of this practice management strategy is to identify efficient tests that accurately stratify patients according to their risk of important cardiovascular outcomes, while minimizing resource use. Accordingly, we have identified a hierarchical approach to screening for patients at risk of coronary disease whereby the exercise treadmill test is initially optimized followed by risk stratification with the stress nuclear scan (in appropriate candidates). Prior evidence reveals that patients with a low-risk DTS have very high survival.1, 2 An aggressive management approach is warranted for patients with a high-risk DTS, who have a 5-year survival of 65%.1, 2 Although patient management has been defined in low-risk and high-risk patients, our results from a multicenter registry of symptomatic patients reveal that the stress nuclear scan may be used to further risk stratify patients whose treadmill risk is intermediate and for whom subsequent management is unclear.
The overall accuracy of exercise treadmill testing, when limited to interpretation of the electrocardiogram, is substantially less than when multiple functional, symptomatic, hemodynamic, and electrocardiographic parameters are integrated into the test interpretation.8, 18–25 Physicians often rely on rules of thumb to guide clinical practice. For example, ST depression occurring at low levels of exercise tolerance is associated with a worse outcome than if it occurs at Bruce stage 3 or higher. We used an exercise treadmill test score that integrates evidence of ischemia and functional capacity to estimate a patient’s likelihood of cardiac death.1, 2 This score has been shown to provide accurate diagnostic and prognostic estimates in several large observational series from the Duke University Databank and other selected patient series.1, 2, 11–13, 18, 26 A compilation of these results reveals that low-risk and high-risk exercise treadmill test scores have an associated annual mortality of less than 1% and 5%, respectively.18 A mortality of 2% to 4% has been reported for patients with an intermediate-risk treadmill test. Low-risk patients, based on exercise treadmill test results, could be managed with a “watchful waiting” approach, observing for a worsening clinical status.18 In a previous study, high-risk patients more often had coronary disease in two or three vessels and could possibly benefit from early treatment known to improve patient survival (e.g., coronary revascularization).11 From a report by Iskandrian and colleagues, 75% of high-risk patients had multivessel coronary disease.12 On average, 35% to 45% of patients have been classified as low risk and 4% to 10% as high risk.18 Those whose risk is intermediate and whose subsequent diagnostic management approach has yet to be defined constitute the largest proportion of patients. In a study of 1,702 patients, Berman and colleagues reported that referral to cardiac catheterization after SPECT was low for patients with a low, intermediate, and high likelihood of coronary artery disease by exercise treadmill test.26 Further, nuclear imaging provided incremental prognostic information and was cost-effective in patients with interpretable exercise electrocardiogram responses and an intermediate-to-high likelihood of coronary artery disease by exercise treadmill test, as well as in those with uninterpretable exercise electrocardiogram responses and an intermediate-to-high likelihood of coronary artery disease before exercise treadmill test. In an updated series 2,200 patients from Cedars-Sinai Medical Center, even after stratification by the DTS, the nuclear scan further demonstrated clinical and statistical incremental value.13
In general, when using an outcomes-based approach to diagnostic testing, a referral to further testing should be limited to patients for whom substantial new information regarding risk may be acquired. For example, when intermediate-risk DTS patients proceeded to nuclear imaging, further identification of high-risk patients was reported in the current series for those patients with evidence of multivessel ischemia or infarction. For those patients with multivessel ischemia and infarction, 3-year survival was 92% or below and 85% or below, respectively. For intermediate-risk DTS patients, by 1 year after testing, statistical differences in survival between those with no defects and those with myocardial perfusion defects were reported.
Study Limitations
This series was limited to patients with stable chest pain, thus limiting generalizability of the findings. Furthermore, owing to the site variability in nuclear test interpretation, we did not have available detailed segmental scoring from each nuclear site (e.g., scoring using a 20-segment myocardial model).13 As a 20-segment nuclear perfusion score has been shown to improve risk prediction referred to stress nuclear testing, it is expected that our scoring using vascular territories underestimates the risk stratification ability of the nuclear scan. Although blinding procedures were rigorous at each of the participating sites, we used site coding for all of the nuclear and exercise test variables that should not be considered without bias.
Conclusions
For patients with an intermediate-risk exercise treadmill test score, subsequent risk stratification information may be gained from an exercise myocardial perfusion scan. An efficient patient management strategy may be devised whereby intermediate-risk patients with evidence of multivessel ischemia or infarction may be referred to a more aggressive management strategy (i.e., cardiac catheterization). Thus, a hierarchical, outcomes-based approach may enhance risk stratification of patients when nuclear testing follows treadmill testing in candidates selected by risk. This evidence aids in the development of outcomes-based clinical decision making that may enhance the efficiency, reliability, and precision of patient care.
Acknowledgments
This work was supported in part by a research grant from DuPont Radiopharmaceuticals.
Appendix A
Clinical History and Physical Examination Parameters Considered for the Multivariate Risk-Adjusted Models
References
- 1.Mark DB, Shaw L, Harrell FE, et al. Prognostic value of a treadmill exercise score in outpatients with suspected coronary artery disease. N Engl J Med. 1991;325:849–53. doi: 10.1056/NEJM199109193251204. [DOI] [PubMed] [Google Scholar]
- 2.Mark DB, Hlatky MA, Harrell FE, Jr, Lee KL, Califf RM, Pryor DB. Exercise treadmill score for predicting prognosis in coronary artery disease. Ann Intern Med. 1987;106:793–800. doi: 10.7326/0003-4819-106-6-793. [DOI] [PubMed] [Google Scholar]
- 3.Mark DB, Hlatky MA, Lee KL, Harrell FE, Jr, Califf RM, Pryor DB. Localizing coronary artery obstructions with the exercise treadmill test. Ann Intern Med. 1987;106:53–5. doi: 10.7326/0003-4819-106-1-53. [DOI] [PubMed] [Google Scholar]
- 4.Hlatky MA, Pryor DB, Harrell FE, Jr, Califf RM, Mark DB, Rosati RA. Factors affecting sensitivity and specificity of exercise electrocardiography. Am J Med. 1984;77:64–71. doi: 10.1016/0002-9343(84)90437-6. [DOI] [PubMed] [Google Scholar]
- 5.Morrow K, Morris CK, Froelicher VF, et al. Prediction of cardiovascular death in men undergoing noninvasive evaluation for coronary artery disease. Ann Intern Med. 1993;118:689–95. doi: 10.7326/0003-4819-118-9-199305010-00005. [DOI] [PubMed] [Google Scholar]
- 6.Simonetti I, Rezai K, Rossen JD, et al. Physiological assessment of sensitivity of noninvasive testing for coronary artery disease. Circulation. 1991;83(III):43–9. [PubMed] [Google Scholar]
- 7.Detrano R, Janosi A, Steinbrunn W, et al. Algorithm to predict triple-vessel/left main coronary artery disease in patients without myocardial infarction. Circulation. 1991;83(III):89–96. [PubMed] [Google Scholar]
- 8.Chaitman BR. The changing role of the exercise electrocardiogram as a diagnostic and prognostic test for chronic ischemic heart disease. J Am Coll Cardiol. 1986;8:1195–210. doi: 10.1016/s0735-1097(86)80401-6. [DOI] [PubMed] [Google Scholar]
- 9.Weiner DA, Ryan TJ, Parsons L, et al. Long-term prognostic value of exercise testing in men and women from the Coronary Artery Surgery Study (CASS) Am J Cardiol. 1995;75:865–70. doi: 10.1016/s0002-9149(99)80677-8. [DOI] [PubMed] [Google Scholar]
- 10.Okin PM, Kligfield P. Population selection and performance of the exercise ECG for the identification of coronary artery disease. Am Heart J. 1994;127:296–304. doi: 10.1016/0002-8703(94)90116-3. [DOI] [PubMed] [Google Scholar]
- 11.Shaw LJ, Peterson ED, Shaw LK, et al. Use of a prognostic treadmill score in identifying diagnostic coronary disease subgroups. Circulation. 1998;98(16):1622–30. doi: 10.1161/01.cir.98.16.1622. [DOI] [PubMed] [Google Scholar]
- 12.Iskandrian AS, Ghods M, Helfeld H, Iskandrian B, Cave V, Heo J. The treadmill exercise score revisited: coronary arteriographic and thallium perfusion correlates. Am Heart J. 1992;124:1581–6. doi: 10.1016/0002-8703(92)90076-8. [DOI] [PubMed] [Google Scholar]
- 13.Hachamovitch R, Berman DS, Kiat H, et al. Exercise myocardial perfusion SPECT in patients without known coronary artery disease: incremental prognostic value and use in risk stratification. Circulation. 1996;93:905–14. doi: 10.1161/01.cir.93.5.905. [DOI] [PubMed] [Google Scholar]
- 14.Pryor DB, Shaw L, McCants CB, et al. Value of the history and physical in identifying patients at increased risk for coronary artery disease. Ann Intern Med. 1993;118:81–90. doi: 10.7326/0003-4819-118-2-199301150-00001. [DOI] [PubMed] [Google Scholar]
- 15.Pryor DB, Shaw L, Harrell FE, et al. Estimating the likelihood of severe coronary artery disease. Am J Med. 1991;90:553–62. [PubMed] [Google Scholar]
- 16.Pryor DB, Harrell FE, Jr, Lee KL, Califf RM, Rosati RA. Estimating the likelihood of significant coronary artery disease. Am J Med. 1983;75:771–80. doi: 10.1016/0002-9343(83)90406-0. [DOI] [PubMed] [Google Scholar]
- 17.Jaeschke R, Guyatt GH, Sackett DL, for the Evidence-Based Medicine Working Group Users’ guides to the medical literature. JAMA. 1994;271:703–8. doi: 10.1001/jama.271.9.703. [DOI] [PubMed] [Google Scholar]
- 18.Shaw LJ, Hachamovitch R, Iskandrian AE. Treadmill test scores: attributes and limitations. J Nucl Cardiol. 1997;4:74–8. doi: 10.1016/s1071-3581(97)90051-9. [DOI] [PubMed] [Google Scholar]
- 19.Fuchs RM, Achuff SC, Grunwald L, Yin FCP, Griffith LSC. Electrocardiographic localization of coronary artery narrowings: studies during myocardial ischemia and infarction in patients with one-vessel disease. Circulation. 1982;66(6):1168–76. doi: 10.1161/01.cir.66.6.1168. [DOI] [PubMed] [Google Scholar]
- 20.Abouantoun S, Ahnve S, Savvides M, Witztum K, Jensen D, Froelicher V. Can areas of myocardial ischemia be localized by the exercise electrocardiogram? A correlative study with thallium-201 scintigraphy. Am Heart J. 1984;108:933–41. doi: 10.1016/0002-8703(84)90457-5. [DOI] [PubMed] [Google Scholar]
- 21.Tubau JF, Chaitman BR, Bourassa MG, Lesperance J, Dupras G. Importance of coronary collateral circulation in interpreting exercise test results. Am J Cardiol. 1981;47:27–32. doi: 10.1016/0002-9149(81)90285-x. [DOI] [PubMed] [Google Scholar]
- 22.Lim R, Kreidish I, Dyke L, Thomas J, Dymond DS. Exercise testing without interruption of medication for refining the selection of mildly symptomatic patients for prognostic coronary angiography. Br Heart J. 1994;71:334–40. doi: 10.1136/hrt.71.4.334. [DOI] [PMC free article] [PubMed] [Google Scholar]
- 23.Morise AP, Bobbio M, Detrano R, Duval RD. Incremental evaluation of exercise capacity as an independent predictor of coronary artery disease presence and extent. Am Heart J. 1994;127:32–8. doi: 10.1016/0002-8703(94)90506-1. [DOI] [PubMed] [Google Scholar]
- 24.Bobbio M, Detrano R, Schmid JJ, et al. Exercise-induced ST depression and ST-heart rate index to predict triple-vessel or left main coronary disease: a multicenter analysis. J Am Coll Cardiol. 1992;19:11–8. doi: 10.1016/0735-1097(92)90044-n. [DOI] [PubMed] [Google Scholar]
- 25.Ribisl PM, Morris CK, Kawaguchi T, et al. Angiographic patterns and severe coronary artery disease. Arch Intern Med. 1992;152:1618–24. [PubMed] [Google Scholar]
- 26.Berman DS, Hachamovitch R, Kiat H, et al. Incremental value of prognostic testing in patients with known or suspected ischemic heart disease: a basis for optimal utilization of exercise technetium-99m sestamibi myocardial perfusion single-photon emission computed tomography. J Am Coll Cardiol. 1995;26:639–47. doi: 10.1016/0735-1097(95)00218-S. [DOI] [PubMed] [Google Scholar]