

Abstract
The FSH receptor (FSHR) is expressed only in granulosa cells of the ovary and Sertoli cells of the testis. This highly specific pattern of gene expression asserts that transcriptional events unique to these two cell types are responsible for activation of the FSHR gene. We have characterized the promoter elements required for activity of the rat FSHR gene in a Sertoli cell line MSC-1, primary cultures of rat Sertoli cells, and two non-Sertoli cell lines. Transient transfection analysis of deletion and block replacement mutants identified several elements, both 5′ and 3′ to the transcriptional start sites, that are essential for full promoter activity in Sertoli cells. These studies confirmed the use of an important E box element (CACGTG), which had the single greatest impact on promoter function. Bases within the core CACGTG of the E box, as well as flanking sequences, were shown to be essential for its function. Electrophoretic mobility shift assays identified both upstream stimulatory factor 1 (USF1) and USF2 as primary components of the complexes binding the E box. Sequence requirements for USF binding in vitro modestly diverged from the sequence requirements for in vivo function of the element. Comparison of the E box binding proteins in different cell types revealed that similar proteins bind the E box in Sertoli and non-Sertoli cell lines. Extracts from primary cultures of rat and mouse Sertoli cells have a second E box-binding complex that cross-reacts with USF antibodies that is not present in the cell lines.
INTRODUCTION
Sertoli cells are the major somatic cells of the seminiferous epithelium, the site of germ cell development in the testis (1–4). These cells play important roles in both testicular development and function, as they provide an environment that protects and nurtures the germs cells, assisting their development into viable sperm (1, 3). Functions attributed to Sertoli cells include formation of a support system to house the developing germ cells, endocytosis of eliminated waste products of the developing sperm, formation of the blood-testis barrier, assistance in spermiation, delivery of nutrients to germinal cells, and secretion of proteins, ions, and other substances proposed to be important for germ cell development and viability (1, 3). Thus, the cellular relationship between germ cells and Sertoli cells is critical to testicular performance and fertility. Sertoli cell function is influenced by a host of regulatory signals, most notably the pituitary hormone FSH. In prenatal and immature animals, FSH is important for stimulating the proliferation of Sertoli cells, final maturation events such as formation of tight junctional complexes, stimulation of the synthesis of specific Sertoli cell proteins, and the generation of the first wave of spermatogenesis (5–7). The presence of the FSH receptor (FSHR) on Sertoli cells and its regulation is critical for the hormonal response of the testis to FSH.
Although Sertoli cells are recognized for their importance in testis development and function, the events that promote or determine Sertoli cell development and differentiation are poorly understood. Because the FSHR is expressed only in testicular Sertoli cells, examination of its gene and the mechanism that activates it provides an opportunity to identify proteins that will likely be responsible for a host of transcriptional events critical to Sertoli cell function. Previous studies have shown that 5000 bp of 5′-flanking sequence of the rat FSHR gene are sufficient to restrict expression of a reporter gene to the gonads of transgenic mice (8). This suggests that within this region of the gene resides the information necessary for Sertoli cell-specific expression.
The structure of the FSHR gene was first characterized in the rat and later in the human (9, 10). This single-copy gene is organized into 10 exons and 9 introns and spans more than 50 kbp of DNA (9, 10). RNAse protection assays and primer extension have mapped the transcriptional start site in the human to position −99 relative to the start of translation, while studies on the rat gene identified two start sites at positions −80 and −98 relative to the translational start codon (9, 11). Inspection of the 5′-flanking sequence of the gene revealed a notable lack of canonical TATA or CCAAT promoter elements (9, 10). In many promoters that lack a TATA motif, an initiator element (Inr) is critical in positioning RNA polymerase II (12, 13). Several Inr elements have been described and classified according to sequence homology and are generally found to span the transcriptional start sites (12–14). The Inr directs accurate basal transcription and is important for core promoter activity in some TATA-containing as well as TATA-less genes (12, 14, 15). Frequently, these elements work in conjunction with upstream elements to help position the polymerase. These elements are often rich in cytosines and guanines (GC rich) and bind the transcription factor SP1 (12). In the case of the FSHR gene, however, the promoter lacks such a GC-rich region (9).
Determination of the transcriptional mechanisms that regulate FSHR expression in the gonads will provide important insight into both cell-specific transcriptional events that are important for gonadal function and mechanisms that control the response of the gonads to FSH through modulation of receptor levels. Presently, little is known about transcriptional control of the FSHR gene, but deletion analysis of the rat FSHR promoter identified a region between −220 and +98, relative to the first transcriptional start site, to be important for full promoter activity (16). Similarly, in the human promoter, a region between −126 and +98 gave full promoter response (11).
To date, only a single response element has clearly been identified (16). As described in a paper by Goetz et al., an E box is required for full promoter function of the rat FSHR gene (16). The promoters of the rat, human, sheep, and mouse FSHR genes all contain an E box consensus sequence, CANNTG, which is known to bind members of the basic helix-loop-helix (bHLH) family of proteins that consist mostly of transcriptional regulators involved in control of growth and differentiation (11, 17–23). Mutation of the rat FSHR E box (GTCACGTGAC to TATGAACTCT) reduced promoter activity approximately 50% in Sertoli cells (22). In vitro binding analysis revealed that complexes binding the rat FSHR E box cross-reacted with antibodies generated against the bHLH protein, upstream stimulatory factor 1 (USF1) (16, 24). USF1 is a member of a second group of bHLH proteins that have an additional dimerization domain, the leucine zipper (25). USF1 is expressed ubiquitously and binds its target DNA as a dimer, where it forms both homodimers and heterodimers with the closely related protein USF2 (26, 27). Although USF is expressed in numerous cells and tissues, it is possible that it may help determine specificity of the receptor by dimerization with a unique protein partner or through acquisition of a cell-specific modification. Currently, there are no data that confirm USF1 regulation of the FSHR gene in vivo.
To extend our understanding of FSHR gene regulation, we have made a series of block replacement mutations that span the proximal promoter region of the rat FSHR gene and evaluated their effects on promoter function. These studies verify the importance of the E box and identify several additional promoter regions that are required for full transcriptional activity. To further elucidate the role of the E box-binding proteins in promoter function, a series of E box mutants were characterized for their effect on promoter function in vivo and protein binding in vitro.
RESULTS
−100 to +123 bp of the Rat FSHR Gene Yields Highest Promoter Activity
To determine the minimal portion of the rat FSHR gene required for full promoter activity, we created a series of constructs containing different amounts of 5′-flanking sequence. These promoter fragments were used to drive expression of a luciferase reporter gene and characterized by transient transfection analysis in the Sertoli cell line MSC-1 (28). Promoter activity increased when the bases between −3600 bp and −2700 bp, relative to the first transcriptional start site, were removed (Fig. 1). Promoters containing 2700, 1300, 763, and 220 bp of 5′-flanking sequence were similar in activity, while removal of the sequences between −220 and −100 resulted in a second increase in promoter activity. These studies indicate that, in MSC-1 cells, promoter function is regulated by at least two negative elements located between −3600 and −2700 and −220 and −100 and that most of the positive elements needed for full promoter activity are located between −100 and +123 bp of the proximal promoter region.
Fig. 1. The −100 to +123 bp Promoter Construct Exhibits the Highest Activity in MSC-1 Cells.

Promoter constructs containing 123 bp downstream of the first transcriptional start site and different amounts of 5′-flanking sequence of the rat FSHR gene were used to drive expression of the luciferase reporter gene. One microgram of each promoter construct was cotransfected with 0.2 μg RSV-β-galactosidase into MSC-1 cells as described in Materials and Methods. Luciferase activity of each was determined and normalized to β-galactosidase activity to control for transfection efficiency. The data represent the luciferase/β-galactosidase activity of each promoter construct normalized to the luciferase/β-galactosidase activity of the promoter-less control pGL3-basic. Transfections were done a minimum of three times. Error bars represent the sem.
An E Box and Several Weaker Elements Are Required for Promoter Function in MSC-1 Cells
To identify the elements required for activity of the minimal promoter region, we made a series of 14 block replacement mutations that span the region from −70 to +123 and placed them in the context of the −220/+123 bp promoter (Fig. 2). Transient transfection analysis in MSC-1 cells revealed several levels of regulation by regions of the FSHR promoter (Fig. 3). The most profound effect was observed for the mutation through region 9.2 (μ9.2, Fig. 3). This mutation disrupts the E box located at approximately −23 bp. A more modest effect was observed with a second upstream mutation disrupting region 6 (μ6, Fig. 3). Interestingly, regions downstream of the transcriptional start sites also significantly influenced promoter activity. These mutations span regions 13.4, 14, and 15 as well as those further downstream in regions 17, 18, and 19. Minor, but statistically significant (P < 0.01), effects were also observed with mutations through regions 7, 10, and 11.
Fig. 2. Sequence of the Rat FSHR Gene from −70 to +123 and Block-Replacement Mutants.

The sequence of the rat FSHR gene is shown in uppercase letters on the top strand. The sequence is numbered according to the first transcriptional start site, indicated by the arrow at +1 in the figure. The second transcriptional start site is indicated by the arrow at +19. The sequence of each promoter mutation, numbered sequentially from μ6 to μ19, is indicated in lowercase letters below that of the replaced wild-type sequence.
Fig. 3. Multiple Elements Contribute to FSHR Promoter Activity in MSC-1 Cells.
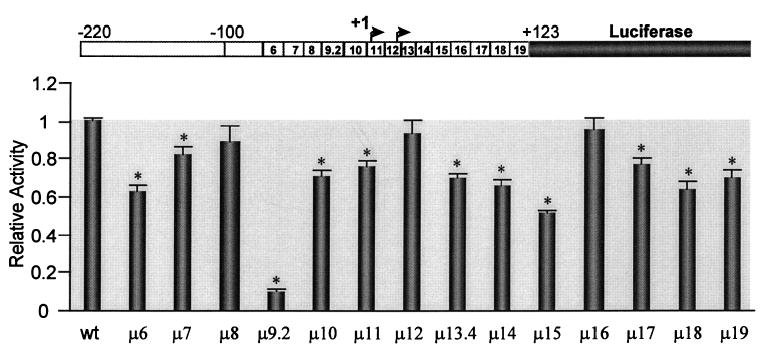
Mutations indicated in Fig. 2 were inserted into the −220/+123 bp promoter of the rat FSHR gene and used to drive expression of the luciferase reporter gene. The promoter constructs (1.0 μg) were cotransfected with RSV-β-galactosidase (0.2 μg) into MSC-1 cells. The luciferase activity of each construct was determined and normalized to β-galactosidase activity to control for transfection efficiency. The data represent the luciferase/β-galactosidase activity of each mutant normalized to the luciferase/β-galactosidase activity of the wild-type construct. Corresponding mutations are indicated below the bars. At the top, is a schematic diagram showing the relative positions of each mutation. Transfections were done a minimum of three times and include data from at least two different preparations of DNA. Error bars represent sem. Asterisks indicate values that are statistically different from the wild-type control (P < 0.01) as determined by Student’s t test.
To confirm the use of the downstream regions, promoter constructs were created that included different amounts of the 3′-sequence. Transient transfection of these 3′-deletion constructs into MSC-1 cells confirmed the importance of this region in regulation of the FSHR gene (Fig. 4). Further inspection of these results suggests that mutations in regions 18 and 19 do not contribute significantly to promoter activity, as removal of sequence between +123 and +98 had no effect on promoter activity. Removal of sequences containing region 17 (+98 to +79) diminished promoter activity slightly, suggesting this region plays a minor role in promoter function. However, further deletion to +45 significantly diminished promoter activity, supporting the previous observation that region 15 is important for activity. Additional decreases in promoter activity were seen as the promoter was further deleted to +21 and then again to +8. It is interesting to note that the combined effect of the mutations in the 3′-end dramatically reduced promoter activity to an extent nearly equal that of the E box mutation, identifying this region of the gene as a critical component of FSHR regulation.
Fig. 4. Elements 3′ to the Transcriptional Start Sites Are Essential for Promoter Function.

FSHR promoter constructs containing 220 bp of 5′-flanking sequence and different amounts of sequence 3′ to the transcriptional start sites were used to drive expression of the luciferase reporter gene. One microgram of each promoter construct was cotransfected with 0.2 μg RSV-β-galactosidase into MSC-1 cells. Luciferase activity was normalized to β-galactosidase activity to control for transfection efficiency. The luciferase/β-galactosidase activity of each promoter construct was normalized to the luciferase/β-galactosidase activity of the −220/+123 FSHR promoter construct. Transfections were done a minimum of three times. Error bars represent the sem. An asterisk indicates that the values are statistically different from those of the next largest promoter construct (P < 0.01), as determined by Student’s t test.
A Guanine Cytosine Pair Is Important for Region 15 Activity
Since region 15 was identified as an important 3′-element in the FSHR promoter, we further characterized this site by determining its functional sequence requirements in MSC-1 cells. Transient transfection analysis of additional region 15 mutants identified a guanine and cytosine (μ15.4) that, when mutated, diminished promoter activity to the same extent as the full block replacement mutant μ15 (Fig. 5). This confirmed the importance of region 15 and identified the guanine and cytosine at the 3′-end of the site as critical for the element’s associated activity.
Fig. 5. A Guanine and Cytosine Are Important for the Activity in Region 15.

Four smaller region 15 mutations (μ15.1, μ15.2, μ15.4, μ15.5) were introduced into the FSHR (−220/+79) luciferase promoter construct and cotransfected with RSV-β-galactosidase into MSC-1 cells as described in Fig. 1. The luciferase and β-galactosidase activities were determined, and the activity of each smaller mutant was normalized to the luciferase/β-galactosidase activity of the FSHR(−220/+79) wild-type construct (wt2). The original μ15 construct (see Fig. 2 for the sequence) was also examined, and its activity was normalized to the FSRH(−220/+123) wild-type construct (wt1). Error bars represent the sem. An asterisk indicates that the values are statistically different from that of the wild-type control (P < 0.01) as determined by Student’s t test.
Promoter Function Differs in Sertoli Cells and Ectopic Cell Lines
To help identify potential elements that may provide specificity to the FSHR promoter and to compare promoter activity in MSC-1 cells and primary Sertoli cells, we characterized the deletion and block replacement mutants in two nongonadal cell types and primary cultures of rat Sertoli cells. Examination of the 5′-deletion mutants in BeWo cells, a human choriocarcinoma cell line, revealed that the promoter is nearly silent in these cells (2× greater than the base vector pGL3, Fig. 6). However, activity of the promoter was somewhat higher in αT3 cells, a mouse gonadotrope cell line, with the −100/+123 construct almost 5-fold greater than pGL3 (Fig. 6). In primary cultures of rat Sertoli cells, promoter activity was considerably greater, reaching more than 15-fold that of the base vector. Comparison between Sertoli cells and the two non-Sertoli cell lines (BeWo and αT3) revealed that, while promoter activity in Sertoli cells increased significantly when subsequently larger portions of the 5′-region were removed, activity of the promoter remained low in the ectopic cell lines.
Fig. 6. The Activity of the FSHR Promoter Is Higher in Primary Cultures of Sertoli Cells Than in Ectopic Cell Lines.

Each of the indicated promoter constructs was cotransfected with RSV-β-galactosidase into either primary Sertoli cell cultures or two nonexpressing cell lines, αT3 and BeWo, as described in Materials and Methods. Luciferase activity of each was determined and normalized to β-galactosidase activity to control for transfection efficiency. The data represent the luciferase/β-galactosidase activity of each promoter construct normalized to the luciferase/β-galactosidase activity of the promoter-less control pGL3-basic. Transfections were done a minimum of three times. Error bars represent the sem.
The block replacement mutants were examined in the ectopic cell lines to help identify elements that are unique to Sertoli cells and to reveal possible repressor elements that might be involved in silencing the FSHR gene in nonexpressing cells. In BeWo cells, mutations in regions 7, 11, 13, 14, 15, and 18 had modest, but statistically significant (P < 0.01), effects on promoter activity (Fig. 7A). Importantly, no increase in promoter activity was detected for any of the mutants, ruling out the involvement of a repressor in silencing promoter activity in these cells. Similar to the results in MSC-1 cells, mutations in upstream regions 6 and 9.2 significantly diminished promoter activity in αT3 cells, while mutations through regions 10 and 11 had a more minor impact (Fig. 7B). However, in contrast to expression in MSC-1 cells, there was also a significant effect observed with a mutation through region 8 in the αT3 cells. In the 3′-end of the promoter, regions 13 and 14 predominated, while a mutation through region 15 had little impact. Similar to BeWo cells, no elements involved in silencing the gene were revealed in αT3 cells.
Fig. 7. Promoter Function in Ectopic Cell Lines.
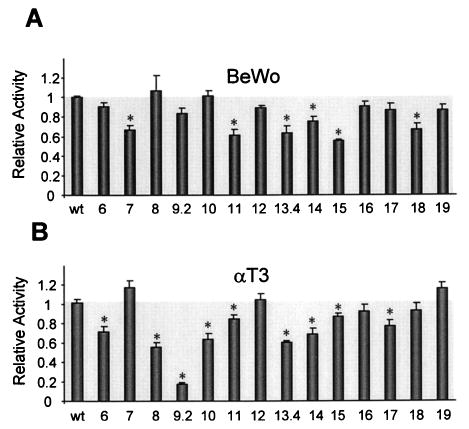
Mutations indicated in Fig. 2 were inserted into the −220/+123 bp promoter of the rat FSHR gene and used to drive expression of the luciferase reporter gene. The promoter constructs (1.0 μg) were cotransfected with RSV-β-galactosidase (0.2 μg) into BeWo cells (A) or αT3 cells (B) as described in Materials and Methods. The luciferase activity of each was determined and normalized to the β-galactosidase activity. The data represent the luciferase/β-galactosidase activity of each mutant normalized to the luciferase/β-galactosidase activity of the wild-type FSHR(−220/+123)Luc construct. Corresponding mutations are indicated below the bars. Transfections were done a minimum of three times. Error bars represent sem. Asterisks indicate values that are statistically different from the wild-type control (P < 0.01) as determined by Student’s t test.
Since MSC-1 cells are a transformed Sertoli cell line, we sought to validate their use by comparing FSHR promoter function in these cells to that in primary cultures of rat Sertoli cells. Transient transfection analysis of the 3′-deletion mutants in primary Sertoli cells produced similar results to those observed in MSC-1 cells (compare Figs. 4 and 8A). However, minor differences were seen when the sequences between +123 and +98 were removed. In MSC-1 cells, this had no significant effect on promoter activity, whereas in primary Sertoli cells, activity increased. Importantly, in both cell types, subsequent deletions to +45, +21, and +8 resulted in sequential decreases in promoter activity (Figs. 4 and 8A). Analysis of the block replacement mutants (μ6–μ16) in Sertoli cells stressed the importance of upstream regions 6, 7, and 9.2, regions flanking the start sites (10, 11, and 12) and regions downstream of the start sites (13.4, 14, 15, and 16; Fig. 8B). Although these results are similar to those observed in MSC-1 cells (Fig. 3), several minor differences were noted. Thus, mutations in regions 7, 12, 13.4, and 16 all had slightly greater impact on promoter activity in primary cells than in MSC-1 cells. In addition, a mutation through region 8 resulted in an increase in promoter activity that was not observed in MSC-1 cells. Together, the block replacement and deletion studies reveal that in Sertoli cells the E box has the greatest single influence on promoter function and that, together with an element in region 6 and 7, is important for the activity associated with the 5′-region of the promoter. In addition, FSHR promoter function in Sertoli cells requires several elements 3′ to the transcriptional start sites that together exert a significant regulatory influence on promoter activity nearly equal to that of the E box.
Fig. 8. Expression of FSHR in Primary Sertoli Cells Is Analogous to Expression in the Sertoli Cell Line MSC-1.

A, As described in the Fig. 4, FSHR promoter constructs (0.5 μg) containing different amounts of 3′-sequence were transfected into primary Sertoli cells together with RSV-β-galactosidase (0.5 μg). Luciferase activity was normalized to β-galactosidase activity to control for transfection efficiency. The data represent the luciferase/β-galactosidase activity of each promoter construct normalized to the luciferase/β-galactosidase activity of the −220/+123 FSHR promoter construct. Transfections were done a minimum of three times. Error bars represent sem. B, As described in Fig. 3, the activity of each block-replacement mutation (Fig. 2) was examined in primary rat Sertoli cells, using the conditions given above. The data represent the luciferase/β-galactosidase activity of each mutant normalized to the luciferase/β-galactosidase activity of the wild-type construct. Corresponding mutations are indicated below the bars. Transfections were done a minimum of three times. Error bars represent sem. An asterisk indicates that the values are statistically different from those of the next largest promoter construct (A, P < 0.01), or from the wild-type construct (B, P < 0.01).
Bases within the Core CACGTG of the E Box, as Well as Flanking Sequences, Are Essential for Function of the Element
The large impact on promoter activity observed with the E box mutation underscores its importance in FSHR gene regulation. Therefore, determination of the sequences required for its function is critical to the evaluation of the promoter and the proteins that bind the element. Five different mutations were made in the region of the E box and placed into the context of the −220/+123 bp promoter. Functional evaluation of these E box mutants showed considerable similarity in MSC-1 and primary Sertoli cells (Fig. 9). Replacement of each base in the E box core, 5′-CACGTG-3′, resulted in significant loss of promoter function (Fig. 9, μ9.2). Interestingly, mutation of two bases on each side of the E box core sequence (μ9.4) also dramatically reduced promoter activity, demonstrating that the flanking sequences as well as the core of the E box are critical for transcription factor recognition or function. Changing the E box core sequence from 5′-CACGTG-3′ to 5′-CACaTG-3′ (μ9.5), the same sequence that is found in the human promoter, had a small impact in primary Sertoli cells (P < 0.05) and was not different from the wild-type sequence in MSC-1 cells. However, further alteration of the human sequence from 5′-CACaTG-3′ to 5′-CAgaTG-3′ (μ9.6) significantly reduced promoter activity, suggesting that a guanine at position 3 in the E box is not well tolerated. Interestingly, μ9.3, which also has a guanine at position 3 but a cytosine at position 4, had slightly higher activity than μ9.6 in both Sertoli cells and MSC-1 cells.
Fig. 9. Bases within the E Box Core as Well as Its Flanking Sequence Are Required for Full Promoter Activity.

Each of the indicated E box mutations were introduced into the FSHR (−220/+123) luciferase promoter construct and cotransfected with RSV-β-galactosidase into either primary cultures of rat Sertoli cells or MSC-1 cells. The luciferase and β-galactosidase activities were determined and the luciferase/β-galactosidase activity of each mutant was normalized to the luciferase/β-galactosidase activity of the wild-type construct. Transfections were done a minimum of three times. Error bars represent sem. Statistical significance was determined by Student’s t test using two-sample unequal variance. Statistically significant differences (P < 0.01) are indicated for values different from μ9.2 (a), μ9.3 (b), μ9.4 (c), μ9.5 (d), and μ9.6 (e).
E Box-Binding Complexes Cross-React with USF1 and USF2 Antibodies
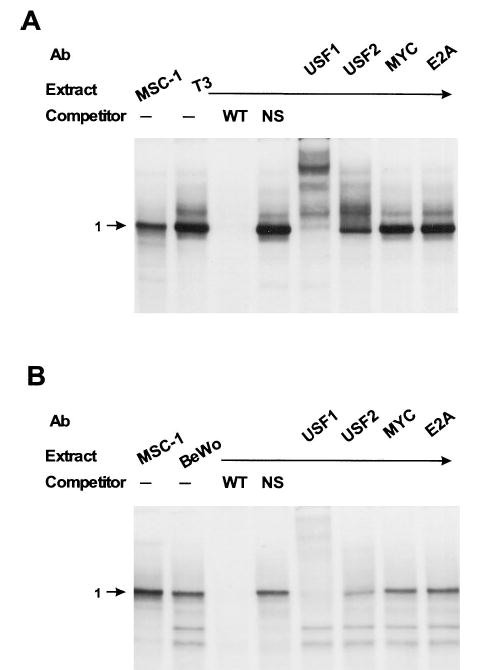
To identify proteins binding the E box in the different cell lines and primary Sertoli cells, we employed electrophoretic mobility shift assays (EMSAs). One major shifted complex was observed with a radiolabeled E box probe and extracts from MSC-1 cells (Fig. 10A). This complex bound specifically to the E box, as indicated by the ability of a homologous sequence [wild type (wt)] but not a nonspecific (NS) sequence to compete for complex binding. When extracts from primary rat Sertoli cells were used, two major shifted complexes were observed, both of which are specific for the E box sequence (Fig. 10A). Specifically bound complexes migrating to position 1 (band 1) on the gel were observed in both MSC-1 and Sertoli cells, while specific complexes migrating to position 2 (band 2) were only observed in primary rat Sertoli cells (Fig. 10A). These complexes cross-reacted with USF1 and USF2 antibodies in MSC-1 (band 1) and primary rat Sertoli cells (bands 1 and 2). For each extract, the USF1 antibody cross-reacted with a greater portion of the binding complexes than did the USF2 antibody. No cross-reactivity was observed with antibodies against two additional members of the bHLH family, c-Myc and E2A (E47 and E12).
Fig. 10. Both USF1 and USF2 Bind the FSHR E Box in Sertoli Cells.

A, A radiolabeled probe corresponding to the FSHR E box (5′-TCTTGGTGGGTCACGTGACTTTGCCCGT-3′) was used in EMSA with whole-cell extracts from MSC-1 cells (MSC-1) and primary rat Sertoli cells (SC). Radiolabeled probe (8.3 fmol) was incubated with 9.5 μg of whole-cell extract and resolved on a 4% polyacrylamide gel as described in Materials and Methods. Where indicated, unlabeled homologous (WT) or nonspecific (NS; 5′-CTAGAGTCGACCTGCAGGCATGCAAGCTTGGCATTC-3′) DNAs were added to the reaction at a concentration equal to 80× that of the probe. Where indicated above the lanes, antibodies specific for the bHLH proteins, USF1, USF2, c-Myc, and E2A, were added to the reactions before the addition of the probe. The major specific complexes are marked by arrows and a corresponding number. B, EMSAs were performed as described in panel A using whole-cell extracts from either primary rat Sertoli cells (rSC) or primary mouse Sertoli cells (mSC).
To explore the differences in E box-binding proteins observed between MSC-1 cells, a mouse Sertoli cell line, and primary rat Sertoli cells, we evaluated these complexes in extracts from primary mouse Sertoli cells. In the presence of these extracts, two major shifted complexes bound specifically to the E box probe and migrated to similar positions as the complexes formed with rat Sertoli cell extracts (Fig. 10B). In addition, mouse Sertoli cell complexes similarly cross-reacted with antibodies against USF1 and USF2. The presence of an additional E box-binding complex in primary rat Sertoli cells (band 2) can therefore be attributed to differences between the cell line and primary cultures and not to differences between species.
To determine whether similar or different proteins occupy the E box in ectopic cell lines, EMSA was used to examine the binding complexes in extracts from BeWo and αT3 cells. In each cell type, one major shifted complex (band 1 in Fig. 11) bound specifically to the E box and migrated to the same position as the major band formed from MSC-1 cells (Fig. 11). Similarly, the proteins from each extract cross-reacted with both USF1 and USF2 antibodies but not with the c-Myc and E2A antibodies. In αT3 cells (Fig. 11A), a slower migrating, specifically bound complex just above the major band was also observed. In BeWo cells (Fig. 11B), two faster migrating nonspecific bands were seen. These data indicate that similar proteins bind the E box in Sertoli and non-Sertoli cell lines.
Fig. 11. USF1 and USF2 Bind the FSHR E Box in αT3 and BeWo Cells.
A, A radiolabeled probe corresponding to the FSHR E box (5′-TCTTGGTGGGTCACGTGACTTTGCCCGT-3′) was used in EMSA with nuclear extracts from either MSC-1 or αT3 cells. Radiolabeled probe (8.3 fmol) was incubated with 9.5 μg of nuclear extract and resolved on a 4% polyacrylamide gel as described in Materials and Methods. Where indicated, unlabeled homologous (WT) or nonspecific (NS; 5′-CTAGAGTCGACCTGCAGGCATGCAAGCTTGGCATTC-3′) DNAs were added to the reaction at a concentration equal to 80× that of the probe. Where indicated above the lanes, antibodies specific for the bHLH proteins, USF1, USF2, c-Myc, and E2A, were added to the reactions before the addition of the probe. The major specific complex is marked by an arrow and the number 1. B, EMSAs were done as described in panel A using nuclear extracts from either MSC-1 or BeWo cells.
Binding of USF to the E Box Differs Modestly from the Functional Requirements of the Element in Vivo
To determine whether the in vitro binding affinities of USF1 and USF2 correlated with the in vivo function of the promoter, DNA fragments containing each of the mutant E boxes were used as competitors in an EMSA. The relative affinities of the DNA sequences for the USF complexes were determined by comparing the ability of each DNA fragment to compete for complexes binding the E box in Sertoli cell extracts (Fig. 12). This revealed the following relative binding affinities: wt > μ9.5 > μ9.3 > μ9.6 ≅ μ9.4 > μ9.2. Thus, with the exception of μ9.4, the relative binding affinities correlated well with the functional requirements of the element (Fig. 9: wt > μ9.5 > μ9.3 > μ9.6 > μ9.2 ≥ μ9.4; P < 0.01). The discrepancy with the μ9.4 mutant suggests that either the USF proteins are not responsible for activation of the promoter through the E box or that the mutations not only affect the binding affinities for the USF proteins but their transactivation ability as well.
Fig. 12. The USF Complexes Have Different Affinities for the E Box Mutants.
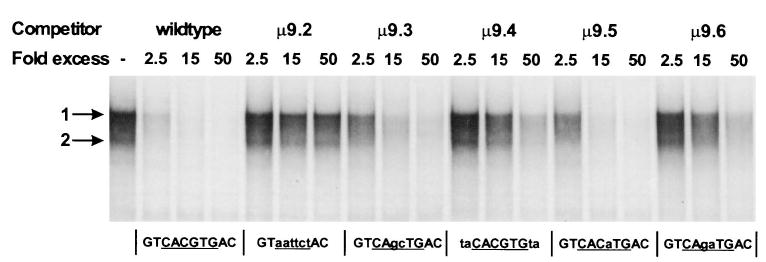
EMSAs were performed as described in Fig. 10 using whole-cell extracts from primary Sertoli cell cultures and a radiolabeled E box probe (5′-TCTTGGTGGGTCACGTGACTTTGCCCGT-3′). Competitor DNAs were generated by DNA amplification of the region between −70 and +8 using two FSHR promoter-specific primers and each of the indicated mutant promoters as a template. Competitors were added at the fold excess indicated above the lanes. Results were confirmed using three different preparations of extracts and two separate sets of generated competitors. The major specific complexes are marked as they were in Fig. 10.
DISCUSSION
Using deletion analysis and block replacement mutagenesis, we have characterized the FSHR promoter region spanning from approximately 5000 bp 5′ to the first transcriptional start site to 123 bp in the 3′ direction. These studies are the first to extensively evaluate the promoter using a block replacement approach, which identifies important promoter regions while maintaining promoter context, and to fully characterize the promoter in eutopic and ectopic cell lines and primary cultures of Sertoli cells. Comparison of the results in different cell types revealed several interesting similarities and differences. All cells examined showed an increase in promoter activity when the bases between −5000 and −2700 were removed, suggesting either a general repressor element is present in this region or a structural constraint in the larger plasmid construct diminishes its transfection into the cells. In primary Sertoli cells, there was a second increase when the region between −2700 and −220 was removed that was not observed in the other cells, implicating the presence of a negative element within this region that is active only in the primary cultures. Analysis of the deletion mutants also revealed the presence of a repressor element between − 220 and −100 that was active only in Sertoli cells. Removal of this region significantly increased promoter activity in MSC-1 cells, and to a lesser extent in primary Sertoli cells, while little or no change in promoter activity was observed in BeWo or αT3 cells. It must be noted that transfections were performed using equal microgram amounts of DNA rather than equal molar amounts that could account for differences in promoter activity between constructs of substantially different sizes. However, among the deletion mutants (Fig. 1), adjacent constructs did not differ significantly in the molar amounts of DNA transfected (<15% in most cases). The relatively small differences in the molar amounts used between adjacent constructs cannot fully account for the repressive activity observed between either the −5000 and −2700 promoters or between the −220 and −100 promoters. However, it may, in part, explain the increase observed in primary Sertoli cells when the region between −2700 and −220 was removed. In MSC-1 and primary Sertoli cells, the −100/+123 bp promoter was the most active construct, and its activity was substantially higher than that observed in the ectopic cell lines. Thus, the transcriptional events occurring within this region of the promoter play an important role in gene activation and exhibit some cell specificity with regard to promoter function. For these reasons, the −100/+123 bp promoter was selected for further analysis by block-replacement mutagenesis.
The block-replacement studies identified elements upstream of the transcriptional start sites that are important for activity in MSC-1 and Sertoli cells (regions 6, 7, and 9.2; Figs. 3 and 8). The role of region 6 in FSHR gene regulation has not previously been described. Sequence analysis of this region revealed potential binding sites for members of the ets family of transcription factors, suggesting that a member of this family may be important for activation of the FSHR gene (29). Currently, our understanding of the role of this element is limited and awaits further characterization of the element and its binding proteins.
In addition to the upstream elements, several regions 3′ to the transcriptional start sites (regions 13.4, 14, and 15) were also important for promoter function in MSC-1 and Sertoli cells. Although there seem to be some differences in specific sites of the 3′-end that are important, in each cell type investigated, there were multiple 3′-regions that contributed to promoter activity. In MSC-1 and Sertoli cells, deletion analysis of the 3′-end confirmed its importance in FSHR promoter function. Studies using the human FSHR promoter showed that deletion of bases corresponding to +98 to +66 in the rat reduced promoter activity approximately 80% (11). Although we observed promoter effects in this region, they were milder than those observed by Gromoll et al. (11) with the human FSHR promoter. In addition, a large internal deletion in the human promoter that corresponds to the rat sequences from −9 to +43, reduced promoter activity 60%, suggesting the presence of weaker promoter elements spanning the transcriptional start site (11).
Our studies and the studies with the human promoter both support a role for the 3′-region in FSHR promoter activity. A functional role for cis-acting elements located downstream of the transcriptional start site has been reported for several genes (30–34). It is interesting to note that many TATA-less genes have been reported to have a common element, MED-1, in their 3′-ends (34). A similar sequence was not detected within the 3′- region of the rat FSHR gene. The molecular mechanism by which these elements enhance transcription is largely unknown, but they may act in a manner similar to 5′-promoter elements to help recruit components of the general transcription machinery or may be important in start site selection or elongation. In the rat FSHR 3′-region, a mutation through region 15 had the greatest impact on promoter activity. Further inspection of this element revealed a perfect consensus sequence (5′-TTTS-GCGC-3′) for the transcription factor E2F (35). Additional mutagenesis revealed that the last two bases of this site were critical for activity, while mutation of bases elsewhere in the E2F site had only mild effects on promoter function (Fig. 5). Preliminary data in primary rat Sertoli cells indicated that mutation of the last two bases in this site (μ15.4) reduced promoter activity to 53% of wild type. Although these studies do not rule out a role for E2F, the minor effects observed with mutations through other conserved bases in the E2F site underscores the possibility that a factor other than E2F regulates this element and points to the GC-rich region as the site important for protein interaction with the promoter. Further characterization of region 15 will be critical to our understanding of the FSHR gene and the role of 3′- elements in regulation of gene transcription.
In contrast to a previous report, we did not find that mutations between the transcriptional start sites had a large impact on promoter activity (16). To address the discrepancy, additional mutations were made in region 11 (μ11c altered the wild-type sequence from 5′-CAGATCTCTCT-3′ to 5′-tgGATCcagag-3′ and μ11.1 changed the sequence to 5′-CAGATCTaaaa-3′) and examined by transient transfection analysis. Both of these retained 80% or greater of the wild-type activity in MSC-1 cells (our unpublished results). However, this region did appear to be more important for promoter activity in primary Sertoli cell cultures than in MSC-1 cells. Interestingly, a significant drop in promoter activity was observed when the 3′-end was truncated from +21 to +8 (part of region 11 and 12). This supports a role for this region but suggests that it may be more important in promoter function when the downstream region is absent or nonfunctional. Since the rat FSHR gene has two major transcriptional start sites (9), it is possible that there are two Inr-like regions, and loss of one can be compensated for by the other. Interestingly, we observed that a mutation just past the second transcriptional start site (region 13.4) has more of an effect on promoter activity than mutations between the start sites (μ11 and μ12). Additional studies are clearly required to determine whether these regions are acting as Inrs, but previous studies found that the region encompassing the rat FSHR transcriptional start sites (−19/+65) binds to proteins that can bind the Inr of the terminal deoxynucleotidyl-transferase gene (13), suggesting an Inr function within this region.
The block-replacement studies revealed both similarities and differences in promoter function in MSC-1, BeWo, and αT3 cells. In BeWo cells, except for the modest influence of region 7, there is no significant impact of mutations 5′ to the transcriptional start sites. Notably, a mutation through the E box (region 9.2) had only a minor impact on promoter function in BeWo cells. This is in contrast to expression in MSC-1 and αT3 cells, where mutation of the E box had the greatest impact on promoter activity. However, similar to MSC-1 cells, regions downstream of the transcriptional start sites (regions 13.4, 14, 15, and 18) influenced promoter activity in BeWo cells. In αT3 cells, the use of promoter elements in regions 6, 9.2, 13.4, and 14 underscore the similarities with FSHR expression in MSC-1 cells. However, these studies also revealed important differences between promoter function in MSC-1 and αT3 cells. Thus, a mutation in region 8 impacts promoter activity in αT3 cells but not MSC-1 cells and a mutation in region 15 had little consequence in αT3 cells in contrast to its impact in MSC-1 cells.
Mutation of the E box in region 9.2 had the greatest influence on promoter activity when compared with other mutations spanning the −70 to +123 region. The importance of the E box was previously demonstrated for the rat FSHR promoter, and its major binding proteins were shown to cross-react with USF1 antibody (16). Our studies confirm these findings and further build upon them by extending the functional characterization of the E box and correlating the sequence specificity for promoter activity with the sequence specificity required for DNA/protein interaction. We also examined the complexes using additional antibodies to members of the bHLH family and showed that in MSC-1, primary rat and mouse Sertoli cells, αT3, and BeWo cells, the major binding complexes cross-react with both USF1 and USF2 antibodies but not with c-Myc or E2A antibodies (Figs. 10 and 11). Cross-reactivity of the complexes with the USF1 antibody was more extensive than with the USF2 antibody, suggesting that a majority of the complexes are either USF1 homodimers or heterodimers of USF1 and some other protein, while a more minor component is USF1-USF2 heterodimers.
The observation that the major E box-binding complex in BeWo cells was similar, if not identical, to that observed in MSC-1 and αT3 cells offers some important insight into the mechanism by which this promoter is regulated. Thus, despite the presence of the USF proteins, the E box and promoter remained largely inactive in BeWo cells, suggesting that the ability of the USF proteins to transactivate the promoter in these cells is impaired. This altered function may be due to differences in either modification of the USF proteins, proteins with which they interact, or other regulatory features of the promoter. Another possibility is that a protein(s) other than USF is important for regulation of the FSHR promoter through the E box.
In mammalian cells, there are substantial numbers of transcriptional regulators that can bind to the CACGTG sequence, all of which tend to be in the bHLH-Zip class of transcription factors (36–42). These include USF, TFEB, TFE3, c-Myc, Max, and Mad. Thus, resolving the specificity of these transcriptional regulators has been a formidable task. Studies on the binding of partially purified USF from HeLa cells reported the importance of both core E box sequences and flanking sequences and derived a consensus sequence for USF binding (RYCACGTGRY) (43). This sequence fits well with the sequence of the FSHR E box (43). Unfortunately, reports matching the binding site requirements with the functional activity of USF are lacking. It is important to point out that the binding of different bHLH-Zip proteins to the CACGTG E box is sensitive to the conditions of the EMSA (43). Thus both the proteins that bind the element and their sequence requirements are sensitive to the in vitro binding conditions. Under the conditions of our EMSA, the predominant binding complex consisted of USF1 and USF2.
To help corroborate in vitro binding data with in vivo functional data, we analyzed both the functional requirements of the element in vivo and the binding requirements for the proteins in vitro. These studies revealed a discrepancy between the role for the flanking sequence (μ9.4, Fig. 9) in promoter function and its role in USF binding. One explanation of these results is that the major in vitro binding complex is not responsible for activity associated with the E box in vivo. Although other binding proteins are not readily observed in the in vitro binding assays, our preliminary data indicate that additional E box-binding complexes are present in Sertoli cells that are more readily observed when extracts are depleted of USF. A second explanation is that mutation of the flanking sequences not only alters the binding of USF to the DNA element but also influences its function. Thus, USF may bind slightly to the μ9.4 element, but the mutation alters USF conformation such that it cannot transactivate. However, to definitively establish USF as the key regulator of the FSHR gene, more direct approaches are required. Thus determining the effects of wild-type and mutant forms of the USF proteins on promoter function or characterizing FSHR expression in cells or animals that lack USF proteins will be important to confirm or refute the role of USF in FSHR gene regulation. In addition, further characterization of the FSHR E box-binding proteins will be important in determining the proteins that dimerized and/or interact with USF as well as other proteins that bind the FSHR E box.
Although the FSHR promoter did exhibit some specificity with respect to its activity in Sertoli cells vs. nonexpressing cells, the fact that some expression did occur in αT3 cells suggests that not all the regulatory components required for cell specificity are represented in our assay system. Analysis of block-replacement mutants indicated that transcription factors in Sertoli cells and αT3 cells occupy several of the same regions on the promoter. However, it is not known whether the same proteins activate transcription in both cell types or whether different proteins are involved. Such “leaky” expression from the promoter may be due to the presence of abnormally expressed transcription factors or to the uncharacteristic accessibility of the promoter in transiently transfected DNA. Thus, these same transcription factors that activate the promoter in αT3 cells may not function when the promoter is integrated into chromatin. It seems likely that elements within the −100/+123 promoter together with other control regions within the gene will generate the specificity observed for the FSHR. Further characterization of both the FSHR gene and its promoter region is required to complete our understanding of the transcriptional mechanisms activating FSHR in Sertoli cells. Identification of the proteins involved will be critical to our understanding of FSHR gene regulation and, as suggested by the exquisite specificity of the gene, will likely provide important insight into transcriptional events critical for Sertoli cell function.
MATERIALS AND METHODS
Reagents
Reagents and venders include the following: Tris-HCl, NaCl, MgCl2, glycerol, bis-acrylamide, potassium acetate, sodium hydroxide, Triton X-100, SDS, acrylamide, and boric acid (Fisher, Pittsburgh, PA); phenylmethyl sulfonyl fluoride, EDTA, and Nonidet P 40 (NP-40), Tween 20 from Sigma Chemical Co. (St. Louis MO); dithiothreitol from Boehringer Mannheim (Indianapolis, IN); lipofectamine, HEPES, DMEM, horse serum, FBS, Penicillin/Streptomycin, and Waymouths media from Life Technologies (Gaithersburg, MD); nucleotides and poly(dI-dC)·poly(dI-dC) from Pharmacia (Piscataway, NJ); ethanol from Aaper (Shelbyville, KY); restriction enzymes from Life Technologies or Promega (Madison, WI); and T4 polynucleotide kinase from New England BioLabs (Beverly, MA). Radionucleotides were purchased from Du-Pont/NEN (Boston, Mass). USF1, USF2 and goat-antirabbit horseradish peroxidase antibodies were purchased from Santa Cruz Biotechnology, Inc. (Santa Cruz, CA).
Cell Lines
MSC-1 cells (28) were grown in DMEM supplemented with 5% FBS, penicillin, and streptomycin. αT3 (44) cells were grown in DMEM supplemented with 5% FBS, 5% horse serum, penicillin, and streptomycin. BeWo cells (ATCC, Rockville, MD) were grown in Waymouth’s media supplemented with 10% FBS, 2 mm glutamine, penicillin, and streptomycin. Primary Sertoli cells were prepared and cultured as described elsewhere (45) with slight modification. The cells are initially plated in the presence of 5% FBS and 3 μg/ml Cytosine arabinoside. After 40 h in culture the cells were treated with a hypotonic solution of 10 mm Tris (pH 7.4) for 2 min to remove germ cells and then fed Ham’s F12 supplemented with 0.215 g glutamine per liter, 1.5 mm HEPES, and antibiotics.
DNA Preparation
All plasmid DNAs were prepared from overnight bacterial cultures using Qiagen DNA plasmid columns according to the supplier’s protocol (Qiagen, Chatsworth, CA). DNAs used for transfection were prepared with Midi-prep or Mega-prep Qiagen columns. Oligodeoxynucleotides were purchased from Life Technologies. Double-stranded oligodeoxynucleotides were generated by heating complementary oligodeoxynucleotides to 95 C in the presence of 10 mm Tris (8.0), 100 mm NaCl, and 1 mm EDTA and allowing them to cool slowly to room temperature. Radiolabeled oligodeoxynucleotides were generated using T4 polynucleotide kinase and γ-32P-ATP.
FSHR Promoter Clones
The FSHR promoter was isolated from rat genomic clone 54.111 (9). A 6000-bp SstI fragment of 54.111 containing approximately 5000 bp 5′ to the first transcriptional start site and 1000 bp 3′ to this site was subcloned into pGEM 4Z [clone 54.111(3)]. A fragment containing sequences from −220 to +1000 (relative to the first transcriptional start site) was removed from 54.111(3) by digestion with EcoRV and XbaI, and the remaining promoter region was ligated to promoter sequences spanning −220 to +123. The −220 to +123 fragment was generated by PCR amplification using FSHR-specific primers (5′-primer: 5′-AATGTGAATCTGCTGCTATAGACTGAT-3′ and 3′-primer: 5′-AGCAAGGAGACCAGGAGCAAGGCCACCCTTATTTATCCAT-3′) and clone 54.111(3) as template. Reaction conditions are described elsewhere (46). The PCR fragment was digested with EcoRV (a restriction endonuclease site naturally found in the promoter at position −220) and XbaI (a restriction endonuclease site introduced into the 5′-end of the 3′-primer). The 3′-primer has a single base pair change (indicated in bold and underlined) that alters the natural translational start site of FSHR from ATG to GTG to minimize potential problems from altered luciferase translation products. Ligation of the upstream promoter region (−5000 to −220) to the downstream region (−220 to +123) generated the clone FSHR(−5000/+ 123)GEM. An SstI/XbaI fragment of FHSR(−5000/+123)GEM was subcloned into the SstI/NheI sites of the luciferase vector pGL3-Basic (Promega) to generate FSHR(−5000/+123)Luc. To construct FSHR(−3600/+123)Luc, FSHR(−5000/+123)Luc was digested fully with SstI and partially with EcoRI, promoter sequences upstream of −3600 were removed, and the ends were filled in with Klenow and then ligated together. To generate FSHR(−2700/+123)Luc, FSHR(−5000/+123)Luc was digested with SstI and PstI, the 2300-bp fragment containing sequences from −5000 to −2700 was removed, overhangs were filled in with Klenow, and the ends were ligated. To create FSHR(−1300/+123)Luc, FSHR(−5000/+123)Luc was digested with SstI and EcoRI, upstream sequences were removed, and the ends were filled in with Klenow and then ligated together. FSHR(−5000/+123)GEM was digested with HindIII and the 886-bp promoter fragment (spanning from −763 to +123) was subcloned into the HindIII site of pGL3-Basic, producing the clone FSHR(−763/+123)Luc. A 343-bp EcoRV/HindIII fragment from FSHR(−5000/+123)GEM was subcloned into the SmaI/HindIII sites of pGL3-Basic to generate FSHR(−200/+123)Luc. FSHR(−100/+123) was generated by PCR amplification using 54.11(3) as template, an upstream primer, 5′-GATCGGAGCTCATATAATCACTATTGACAC-3′ (underlined sequences are homologous to the FSHR promoter from −100 to −82) with an engineered SstI site near the 5′-end, and the same downstream primer used to generate the −220/+123 fragment. The amplified fragment was digested with SstI and XbaI and subcloned into the SstI/NheI sites of pGL3-Basic.
Generation of FSHR(−220/+123) mutant constructs was accomplished by bidirectional primer extension using Deep Vent DNA polymerase (New England Biolabs). The reaction conditions and strategy are described elsewhere (46). The upstream standard 5′-primer for each mutant was RVprimer3, a primer with matching sequences upstream from the polylinker in pGL3-Basic. The standard downstream primer was Luc.1, a primer that anneals to specific sequences within the coding region of the luciferase gene. The template for each mutant was FSHR(−220/+123)Luc. The cloning sites for the mutants were MluI and HindIII in the multiple cloning site of FSHR(−220/+123)Luc. Mutations introduced into each clone are indicated by lower case letters in Fig. 2. For mutations in regions 9, 10, 12, and 13, only a single mutant primer was used and extension was only in one direction. These mutants were cloned into the BglII (at the +1 site of the promoter) and MluI sites (mutants 9 and 10) or into the BglII and HindIII sites (mutants 12 and 13). All clones were confirmed by sequencing using either the Sequenase 2.0 sequencing kit from USB (Cleveland, OH) or the ABI Prism dRhodamine Terminator Cycle Sequence Ready Reaction Kit (PE Applied Biosystems, Foster City, CA).
Transfection and Enzyme Analysis
MSC-1 cells were seeded onto 35-mm plates at a density of 250,000 cells per well. Twenty to 24 h after plating the cells were transfected using 5 μl of lipofectamine, 1 μg of luciferase reporter, and 0.20 μg of Rous sarcoma virus (RSV) β-galactosidase. For all mutant promoter constructs, at least two independent clones were examined. Details of the transfection procedure are described elsewhere (46). Cells were harvested and assayed 60 h after transfection according to previously described procedures (46). For each transfection, the luciferase/β-galactosidase activity of each construct was normalized to the luciferase/β-galactosidase activity of the wild-type promoter. The values were then averaged over a minimum of three independent experiments. Transfection and enzyme assays for αT3 and BeWo cells are as described elsewhere (46).
Primary cultures of Sertoli cells were seeded onto 35-mm plates at a density equal to 0.08 testis/well. Approximately 72 h after the initial plating, the media was change to DMEM without any additives. Twelve hours later, the cells were transfected using 5 μl of lipofectamine, 0.5 μg of luciferase reporter, and 0.50 μg of RSV-β-galactosidase. Twelve to 16 h later, the transfection media was removed and replaced with fresh DMEM. Forty eight hours later, cells were harvested and assayed as described above. Statistical analysis was performed using a two-sample Student’s t test (two tailed) assuming unequal variances.
EMSA
Whole-cell extracts were prepared as described elsewhere (47). Whole-cell extracts (6–10 μg protein) were incubated with 12.5 fmol of radiolabeled double-stranded oligonucleotide in the presence of 12 mm HEPES, pH 7.9, 5 mm MgCl2, 80 mm KCl, 0.6 mm dithiothreitol, 12% glycerol, 0.6 mm EDTA, 100 μg/ml BSA, 0.1 mm phenylmethylsulfonyl fluoride, and 200 ng of salmon sperm DNA in a 20 μl reaction volume. Addition of antibodies to the reaction immediately preceded the addition of extract. Reactions were incubated on ice for 5 min before addition of probe and then an additional 30 min after unless otherwise noted. Protein/DNA complexes were resolved on a 4% polyacrylamide gel (acrylamide-bis-acrylamide, 40:1) polymerized, and run in a buffer containing 25 mm Tris (pH 8.5), 190 mm glycine, and 0.5 mm EDTA at 250 V for 1.5 h at 4 C. The gels were dried and analyzed by autoradiography. Nuclear extracts, when used, were prepared as described elsewhere (46).
Western Blot Analysis
Whole-cell extracts were resolved on 10% SDS-polyacrylamide gels (acrylamide-bis-acrylamide, 30:0.8) with the discontinuous buffer formulation of Laemmli (48) and transferred to Nitrocellulose membranes (Bio-Rad Laboratories, Hercules, CA) using a Mini Trans-Blot Electrophoretic Transfer Cell (Bio-Rad). Membrane proteins were probed overnight at 4 C with anti-USF1 antibody, diluted 1:10,000 in TBST (15 mm Tris-HCl, pH 7.4, 150 mm NaCl, 0.05% Tween 20), and then subsequently incubated with goat antirabbit horseradish peroxidase-conjugated antibody for 90 min at room temperature. Specific protein complexes were visualized with the enhanced chemiluminescence (ECL) system (Amersham Life Sciences, Arlington Heights, IL).
Footnotes
This work was supported in part by NIH Grant R29HD-3521701A1 (to L.L.H.) and by an NICHD-supported Center of Reproductive Sciences Grant (HD-33994). M.F.D. was supported by a training grant in reproductive biology (HD-07455).
References
- 1.Clermont Y 1993 Introduction to the Sertoli cell. In: Russell LD, Griswold MD (eds) The Sertoli Cell, ed. 1. Cache River Press, Clearwater, FL, pp 21–25
- 2.Wilson RM, Griswold MD. Secreted proteins from rat Sertoli cells. Exp Cell Res. 1979;123:127–35. doi: 10.1016/0014-4827(79)90429-4. [DOI] [PubMed] [Google Scholar]
- 3.Bardin CW, Cheng CY, Mustow NA, Gunsalus GL 1994 The Sertoli cell. In: Knobil E, Neill JD (eds) The Physiology of Reproduction, ed. 2. Raven Press, New York, pp 1291–1333
- 4.Griswold MD. Protein secretions of Sertoli cells. Int Rev Cytol. 1988;110:133–56. doi: 10.1016/s0074-7696(08)61849-5. [DOI] [PubMed] [Google Scholar]
- 5.Heckert L, Griswold MD 1992 The changing functions of follicle-stimulating hormone in the testes of prenatal, newborn, immature, and adult rats. In: Hunzicker-Dunn M, Schwartz NB (eds) Follicle-Stimulating Hormone: Regulation of Secretion and Molecular Mechanisms of Action. Springer-Verlag, New York, pp 237–245
- 6.Heckert LL, Griswold MD. Expression of follicle-stimulating hormone receptor mRNA in rat testes and Sertoli cells. Mol Endocrinol. 1991;5:670–677. doi: 10.1210/mend-5-5-670. [DOI] [PubMed] [Google Scholar]
- 7.Zirkin BR, Awoniyi C, Griswold MD, Russell LD, Sharpe R. Is FSH required for adult spermatogenesis? J Androl. 1994;15:273–276. [PubMed] [Google Scholar]
- 8.Linder CC, Heckert LL, Goetz TL, Griswold MD. Follicle-stimulating hormone receptor gene promoter activity. Endocrine. 1994;2:957–966. [Google Scholar]
- 9.Heckert LL, Daley IJ, Griswold MD. Structural organization of the follicle-stimulating hormone receptor gene. Mol Endocrinol. 1992;6:70–80. doi: 10.1210/mend.6.1.1738373. [DOI] [PubMed] [Google Scholar]
- 10.Gromoll J, Pekel E, Nieschlag E. The structure and organization of the human follicle-stimulating hormone receptor gene. Genomics. 1996;35:308–311. doi: 10.1006/geno.1996.0361. [DOI] [PubMed] [Google Scholar]
- 11.Gromoll J, Dankbar B, Gudermann T. Characterization of the 5′ flanking region of the human follicle-stimulating hormone receptor gene. Mol Cell Endocrinol. 1994;102:93–102. doi: 10.1016/0303-7207(94)90102-3. [DOI] [PubMed] [Google Scholar]
- 12.Weis L, Reinberg D. Transcription by RNA polymerase II: initiator-directed formation of transcription-competent complexes. FASEB J. 1992;6:3300–3309. doi: 10.1096/fasebj.6.14.1426767. [DOI] [PubMed] [Google Scholar]
- 13.Smale ST. Transcription initiation from TATA-less promoters within eukaryotic protein-coding genes. Bio-chim Biophys Acta. 1997;1351:73–88. doi: 10.1016/s0167-4781(96)00206-0. [DOI] [PubMed] [Google Scholar]
- 14.Smale ST, Baltimore D. The “initiator” as a transcription control element. Cell. 1989;57:103–113. doi: 10.1016/0092-8674(89)90176-1. [DOI] [PubMed] [Google Scholar]
- 15.Emami KH, Navarre WW, Smale ST. Core promoter specificities of the Sp1 and VP16 transcriptional activation domains. Mol Cell Biol. 1995;15:5906–5916. doi: 10.1128/mcb.15.11.5906. [DOI] [PMC free article] [PubMed] [Google Scholar]
- 16.Goetz TL, Lloyd TL, Griswold MD. Role of E box and initiatory region in the expression of the rat follicle-stimulating hormone receptor. J Biol Chem. 1996;271:33317–24. doi: 10.1074/jbc.271.52.33317. [DOI] [PubMed] [Google Scholar]
- 17.Huhtaniemi I, Eskola V, Pakarinen P, Matikainen T, Sprengel R. The murine luteinizing hormone and follicle-stimulating hormone receptor genes: transcriptional initiation sites, putative promoter sequences, and promoter activity. Mol Cell Endocrinol. 1992;88:55–66. doi: 10.1016/0303-7207(92)90009-u. [DOI] [PubMed] [Google Scholar]
- 18.Littlewood TD, Evan GI. Transcription factors 2: helix-loop-helix. Protein Profile. 1994;1:639–709. [PubMed] [Google Scholar]
- 19.Lassar AB, Skapek SX, Novitch B. Regulatory mechanisms that coordinate skeletal muscle differentiation and cell cycle withdrawal. Curr Opin Cell Biol. 1994;6:788–794. doi: 10.1016/0955-0674(94)90046-9. [DOI] [PubMed] [Google Scholar]
- 20.Lee JE. Basic helix-loop-helix genes in neural development. Curr Opin Neurobiol. 1997;7:13–20. doi: 10.1016/s0959-4388(97)80115-8. [DOI] [PubMed] [Google Scholar]
- 21.Garrell J, Campuzano S. The helix-loop-helix domain: a common motif for bristles, muscles and sex. Bioessays. 1991;13:493–498. doi: 10.1002/bies.950131002. [DOI] [PubMed] [Google Scholar]
- 22.Murre C, McCaw PS, Vaessin H, Caudy M, Jan LY, Jan YN, Cabrera CV, Buskin JN, Hauschka SD, Lassar AB. Interactions between heterologous helix-loop-helix proteins generate complexes that bind specifically to a common DNA sequence. Cell. 1989;58:537–544. doi: 10.1016/0092-8674(89)90434-0. [DOI] [PubMed] [Google Scholar]
- 23.Sairam MR, Subbarayan VSR. Characterization of the 5′ flanking region and potential control elements of the ovine follitropin receptor gene. Mol Reprod Dev. 1997;48:480–487. doi: 10.1002/(SICI)1098-2795(199712)48:4<480::AID-MRD8>3.0.CO;2-M. [DOI] [PubMed] [Google Scholar]
- 24.Gregor PD, Sawadogo M, Roeder RG. The adeno-virus major late transcription factor USF is a member of the helix-loop-helix group of regulatory proteins and binds to DNA as a dimer. Genes Dev. 1990;4:1730–1740. doi: 10.1101/gad.4.10.1730. [DOI] [PubMed] [Google Scholar]
- 25.Landschultz WH, Johnson PF, McKnight SL. The leucine zipper: a hypothetical structure common to a new class of DNA binding proteins. Science. 1988;240:1759–1764. doi: 10.1126/science.3289117. [DOI] [PubMed] [Google Scholar]
- 26.Sirito M, Lin Q, Maity T, Sawadogo M. Ubiquitous expression of the 43- and 44- kDa forms of transcription factor USF in mammalian cells. Nucleic Acids Res. 1994;22:427–433. doi: 10.1093/nar/22.3.427. [DOI] [PMC free article] [PubMed] [Google Scholar]
- 27.Sirito M, Walker S, Lin Q, Kozlowski MT, Klein WH, Sawadogo M. Members of the USF family of helix-loop-helix proteins bind DNA as homo- as well as heterodimers. Gene Expr. 1992;2:231–240. [PMC free article] [PubMed] [Google Scholar]
- 28.Peschon JJ, Behringer RR, Cate RL, Harwood KA, Idzerda RL, Brinster R, Palmiter RD. Directed expression of an oncogene to Sertoli cells in transgenic mice using Mullerian inhibiting substance regulatory sequence. Mol Endocrinol. 1992;6:1403–1411. doi: 10.1210/mend.6.9.1331774. [DOI] [PubMed] [Google Scholar]
- 29.Nye JA, Petersen JM, Gunther CV, Jonsen MD, Graves BJ. Interaction of murine Ets-1 with GGA-binding sites establishes the Ets domain as a new DNA-binding motif. Genes Dev. 1992;6:975–990. doi: 10.1101/gad.6.6.975. [DOI] [PubMed] [Google Scholar]
- 30.Fornasari D, Battaglioli E, Flora A, Terzano S, Clementi F. Structural and functional characterization of the human alpha3 nicotinic subunit gene promoter. Mol Pharmacol. 1997;51:250–261. doi: 10.1124/mol.51.2.250. [DOI] [PubMed] [Google Scholar]
- 31.Mariman E, Wieringa B. Expression of the gene encoding human brain creatinine kinase depends on sequences immediately following the transcription start point. Gene. 1991;102:205–212. doi: 10.1016/0378-1119(91)90079-q. [DOI] [PubMed] [Google Scholar]
- 32.Kharroubi AE, Martin MA. cis-Acting sequences located downstream of the human immunodeficiency virus type 1 promoter affect its chromatin structure and transcriptional activity. Mol Cell Biol. 1996;16:2958–2966. doi: 10.1128/mcb.16.6.2958. [DOI] [PMC free article] [PubMed] [Google Scholar]
- 33.Bessis A, Salmon A-M, Zoli A, Le Novere N, Picciotto M, Changeux J-P. Promoter elements conferring neuron-specific expression of the beta2-subunit of the neuronal nicotinic acetylcholine receptor studied in vitro and in transgenic mice. Neuroscience. 1995;69:807–819. doi: 10.1016/0306-4522(95)00303-z. [DOI] [PubMed] [Google Scholar]
- 34.Ince TA, Scotto KW. A conserved downstream elements defines a new class of RNA polymerase II promoters. J Biol Chem. 1995;270:30249–30252. doi: 10.1074/jbc.270.51.30249. [DOI] [PubMed] [Google Scholar]
- 35.Slansky JE, Farnham PJ. Introduction to the E2F family: protein structure and gene regulation. Curr Top Microbiol Immunol. 1996;208:1–30. doi: 10.1007/978-3-642-79910-5_1. [DOI] [PubMed] [Google Scholar]
- 36.Carr CS, Sharp PA. A helix-loop-helix protein related to the immunoglobulin E box-binding proteins. Mol Cell Biol. 1990;10:4384–4388. doi: 10.1128/mcb.10.8.4384. [DOI] [PMC free article] [PubMed] [Google Scholar]
- 37.Beckmann H, Kadesch T. The leucine zipper of TFE3 dictates helix-loop-helix dimerization specificity. Genes Dev. 1991;5:1057–1066. doi: 10.1101/gad.5.6.1057. [DOI] [PubMed] [Google Scholar]
- 38.Blackwell TK, Kretzner L, Blackwood EM, Eisenman RN, Weintraub H. Sequence-specific DNA binding by the c-Myc protein. Science. 1990;250:1149–1151. doi: 10.1126/science.2251503. [DOI] [PubMed] [Google Scholar]
- 39.Halazonetis TD, Kandil AN. Determination of the c-MYC DNA-binding site. Proc Natl Acad Sci USA. 1991;88:6162–6166. doi: 10.1073/pnas.88.14.6162. [DOI] [PMC free article] [PubMed] [Google Scholar]
- 40.Blackwood EM, Eisenman RN. Max: a helix-loop-helix zipper protein that forms a sequence-specific DNA-binding complex with Myc. Science. 1991;251:1211–1217. doi: 10.1126/science.2006410. [DOI] [PubMed] [Google Scholar]
- 41.Berberich S, Hyde-DeRuyscher N, Espenshade P, Cole M. max encodes a sequence-specific DNA-binding protein and is not regulated by serum growth factors. Oncogene. 1992;7:775–779. [PubMed] [Google Scholar]
- 42.Ayer DE, Kretzner L, Eisenman RN. Mad: a heterodimeric partner for Max that antagonizes Myc transcriptional activity. Cell. 1993;72:211–22. doi: 10.1016/0092-8674(93)90661-9. [DOI] [PubMed] [Google Scholar]
- 43.Bendall AJ, Molloy PL. Base preferences for DNA binding by the bHLH-Zip protein USF: effects of MgCl2 on specificity and comparison with binding of Myc family members. Nucleic Acids Res. 1994;22:2801–2810. doi: 10.1093/nar/22.14.2801. [DOI] [PMC free article] [PubMed] [Google Scholar]
- 44.Windle JJ, Weiner RI, Mellon PL. Cell lines of the pituitary gonadotrope lineage derived by targeted oncogenesis in transgenic mice. Mol Endocrinol. 1990;4:597–603. doi: 10.1210/mend-4-4-597. [DOI] [PubMed] [Google Scholar]
- 45.Karl AF, Griswold MD. Sertoli cells of the testis: preparation of cell cultures and effects of retinoids. Methods Enzymol. 1990;190:71–75. doi: 10.1016/0076-6879(90)90010-x. [DOI] [PubMed] [Google Scholar]
- 46.Heckert LL, Schultz K, Nilson JH. Different composite regulatory elements direct expression of the human a subunit gene to pituitary and placenta. J Biol Chem. 1995;270:26497–26504. doi: 10.1074/jbc.270.44.26497. [DOI] [PubMed] [Google Scholar]
- 47.Zimarino V, Wu C. Induction of sequence-specific binding of Drosophila heat shock activator protein without protein synthesis. Nature. 1987;327:727–730. doi: 10.1038/327727a0. [DOI] [PubMed] [Google Scholar]
- 48.Laemmli UK. Cleavage of structural proteins during the assembly of the head bacteriophage T4. Nature. 1970;227:680–685. doi: 10.1038/227680a0. [DOI] [PubMed] [Google Scholar]