

Abstract
OBJECTIVE
To examine how Asian-American patients’ ratings of primary care performance differ from those of whites, Latinos, and African-Americans.
DESIGN
Retrospective analyses of data collected in a cross-sectional study using patient questionnaires.
SETTING
University hospital primary care group practice.
PARTICIPANTS
In phase 1, successive patients who visited the study site for appointments were asked to complete the survey. In phase 2, successive patients were selected who had most recently visited each physician, going back as far as necessary to obtain 20 patients for each physician. In total, 502 patients were surveyed, 5% of whom were Asian-American.
MAIN RESULTS
After adjusting for potential confounders, Asian-Americans rated overall satisfaction and 10 of 11 scales assessing primary care significantly lower than whites did. Dimensions of primary care that were assessed include access, comprehensiveness of care, integration, continuity, clinical quality, interpersonal treatment, and trust. There were no differences for the scale of longitudinal continuity. On average, the rating scale scores of Asian-Americans were 12 points lower than those of whites (on 100-point scales).
CONCLUSIONS
We conclude that Asian-American patients rate physician primary care performance lower than do whites, African-Americans, and Latinos. Future research needs to focus on Asian-Americans to determine the generalizability of these findings and the extent to which they reflect differences in survey response tendencies or actual quality differences.
Keywords: Asian-Americans, primary health care, patient evaluations, patient ethnicity
Trends in health care delivery emphasize the increased use of patient evaluations to gauge the quality of medical services.1 As market competition forces hospitals and physicians to cut costs, health plans search for inexpensive means of ensuring that the quality of care does not suffer. Patient evaluations are an integral and relatively inexpensive component of process evaluation. Currently, patient ratings are widely used to monitor physician quality, to highlight areas for improvement, and to determine a portion of physician compensation.2,3 This reliance on patient evaluations appears to be well founded as numerous studies have found that patients provide valid and useful information concerning the quality of medical services.4–8 Although these ratings are often unadjusted for patient characteristics such as age and gender, the association between most demographic characteristics and patient ratings is consistently weak. 4,5,9 One recent study, however, found that patients of Asian or Pacific Islander ethnicity were significantly less satisfied with medical services than were other ethnic groups.10
Patient ratings reflect patient attitudes and beliefs, preferences, and expectations, as well as the actual quality of care.11 This study further explores how Asian-American patients’ ratings of physician performance differ from those of whites, Latinos, and African-Americans and attempts to discern the extent to which these differences result from actual differences in physician performance or from factors beyond the physician’s control.
METHODS
Data Collection
Data for this study were collected from the patients of 27 primary care clinicians at a general medicine group practice in an academic medical center in Boston, Massachusetts. Four of the clinicians were Asian-American and 12 were female. On average, the physicians had been with the group for 8 years. The purpose of the original data collection was to evaluate practice-wide primary care performance and to identify individual physicians’ strengths and weaknesses to develop improvement targets. This study is a retrospective analyses of the patient subgroups of interest.
Initially, successive patients who visited the study site for appointments were asked to complete the survey. This initial phase was designed to assess the overall acceptability of the survey to patients and to identify any problems (number of respondents = 143). Next, examining each physician’s recent appointment log, we selected successive patients who had most recently visited each physician, going back as far as necessary to obtain 20 patients per physician. Because we did not identify any problems with the survey in the initial phase, the same questionnaire was administered in both phases. The respondents who had answered the survey in phase 1 counted toward our target of 20 patients per physician.
A four-step mail protocol was used.12 First, surveys were mailed to all eligible respondents. Second, nonrespondents were sent a reminder card. Third, those who still had not responded were sent a second mailing, followed by another reminder telephone call. All surveys were written in the English language. The response rate was 66% for the mailing, with 359 patients responding for a total of 502. There were no statistically significant differences between respondents from different phases of the study.
Primary Care Assessment Survey
Patients in the study population were asked to evaluate their regular physician by completing the Primary Care Assessment Survey (PCAS), a validated, 90-item patient-completed questionnaire.13 The PCAS is composed of 11 scales measuring primary care performance, report-style items to aid interpretation of several of the rating scales, and information concerning demographics, health status, and health-related behaviors. The PCAS measures primary care performance in accordance with the Institute of Medicine definition.14
Primary care is the provision of integrated, accessible health care services by clinicians who are accountable for addressing a large majority of personal health care needs, developing a sustained partnership with patients, and practicing in the context of family and community.
In keeping with this multidimensional definition of primary care, this study examines differences between Asians and other ethnic groups on seven dimensions of primary care. The dimensions (and scales) are: (1) access, financial and organizational; (2) continuity, visit-based and longitudinal; (3) comprehensiveness, scope of services and contextual knowledge of patients; (4) integration; (5) clinical quality, communication and technical skill; (6) interpersonal treatment; and (7) trust.
The scales measuring longitudinal continuity and technical skill were created from single-item measures. The item measuring longitudinal continuity asks patients to report how long they have been seeing their regular doctor. In addition, a single item is devoted to assessment of the doctor’s technical skill because of known limitations in patient-based assessment of this domain.15 The item is included for purposes of completeness in representation of key concepts, but inferences drawn from it are appropriately restricted.
All other scales were created by combining the response to multiple items in the survey. The multi-item scope of service scale reflects the percentage of health-risk behavior topics, including cigarette and alcohol consumption, safe sex, seat belt use, stress, exercise, and diet, that the physician has addressed with the patient. The seven topics correspond to seven behavioral risks that the U.S. Preventive Task Force recommends every primary care physician address with every adult patient, regardless of age, gender, race, or other personal characteristics.16 Attention to preventive care has been suggested as a useful proxy for comprehensive scope given the difficulty in otherwise monitoring and quantifying all the services and treatments provided.17
The remaining eight multi-item primary care scales were constructed using Likert’s method for summated rating scales.18 All primary care scales range from 0 to 100, with 100 representing the best possible performance.
A report detailing the psychometric properties of the PCAS is available from the authors. In general, it shows that after an initial round of revisions; (1) missing-value rates were low, especially on the scale level; (2) item means, standard deviations, and item-total correlations were roughly equal within a scale, thus supporting scaling assumptions; (3) minimal standards (.40) for consistency of item-total correlations were met by all but one item; (4) success rates of item-discriminant validity assessments (showing that the correlation between an item and its scale exceeded its correlations with other scales) were perfect for five scales and above 75% for three other scales, (5) internal consistence estimates for all of the multi-item scales exceeded .70; and (6) ceiling effects were observed for many of the scales.
For several of the rating items, we asked patients to also report on performance to better understand what level of physician performance is acceptable to patients. For instance, an item asking patients how many minutes they usually wait in their doctor’s office for an appointment, with response options ranging from “less than 5” to “more than 45” is followed by a question asking them to rate this, with response options ranging from “very poor” to “excellent.” Only the rating-style items are included in the primary care scales measuring access.
Patients’ overall satisfaction with their primary care physician is measured with a single item with 6 response levels, ranging from completely satisfied to completely dissatisfied. To keep this measure comparable to the primary care performance scales, the responses were converted to a 0-to-100 scale, with 100 being completely satisfied.
All patients were asked to identify their racial or ethnic group as Latino (n = 21), Caucasian or white (n = 354), African-American or black (n = 67), Asian (n = 25), or other (n = 35). The term Asian-American in this article refers to those who identified their race as Asian, regardless of their citizenship status.
Data Analysis
To test for differences in demographic characteristics, primary care performance, and patient satisfaction between Asian-Americans and whites, Latinos, and African-Americans, ordinary-least squares and logistic regressions were run with independent variables indicating ethnicity. The analyses of primary care performance and patient satisfaction controlled for patient age, gender, education level, household income, and number of chronic conditions.
The inference statistics in our multivariable regression results are adjusted to account for possible cluster sampling effects (i.e., a positive correlation between a given primary care dimension and a group of patients sharing a particular primary care provider).19,20 This correction strategy makes our interpretation of statistical significance more conservative.
To account for multiple interracial comparisons, Bonferroni corrections were used to decrease the p value at which a relationship was considered significant (p = α/number of comparisons = .05/5 = .010).21
Once initial comparisons were complete, we used two strategies in an attempt to discern whether apparent rating disparities between Asian-Americans and other ethnic groups arose from actual differences in quality or differences in factors beyond the physician’s control. First, between-group differences in ratings were compared with differences in reports. For example, we asked patients to report “How quickly can you usually see a doctor when you are sick and call for an appointment?” with a response set ranging from “the same day” to “in more than 5 days.” We then asked “How would you rate this?” with response options ranging from “very poor” to “excellent.” Assuming that reports are less subjective than ratings, we tested the hypothesis that ratings would vary more by ethnicity than would reports.
Second, we tested the normality of the response distributions. Patient ratings of physician services are generally highly skewed, with more patients rating services as “excellent” or “very good” than “poor” or “fair.” To formally test if the distribution of responses of Asian-Americans differed from those of whites, the normality of the responses of Asian-Americans and whites were tested using skewness-kurtosis tests.
Finally, to examine the potential impact on physician profiles of caring for a large percentage of Asian-American patients, we examined how the scores of the physician with the highest percentage of Asian patients would differ if we “risk-adjusted” for the Asian ethnicity of patients.
Patients with missing data for race or who identified their racial category as “other” were excluded from the analyses, as were those with missing data for one or more variables in a regression.
RESULTS
Patient Characteristics
In the sample of 502 patients, 25 (5%) identified their race as Asian. Asian-Americans did not differ significantly from whites, African-Americans, or Latinos on any of the patient characteristics we examined (Table 1). However, African-Americans and Latinos were significantly younger and had less education than whites, and African-Americans had fewer chronic conditions than whites.
Table 1.
Patient Characteristics by Ethnicity
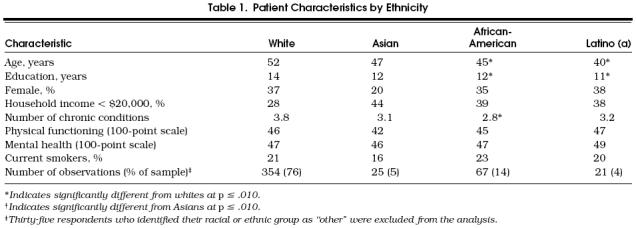
In terms of demographics, the Asian-Americans in our sample are fairly diverse. Their age ranges from 23 to 82 years, with a mean of 47 years. Their household income ranges from less than $10,000 (n = 8) to more than $80,000 (n = 1), with a mean of $20,000 to $30,000. Ten percent of the Asian-Americans in our sample make more than $50,000. In addition, years of formal schooling range from 1 year (n = 1) to more than 17 years (n = 5), with 20% of Asian-Americans in our sample having less than 9 years of schooling.
Primary Care Performance and Overall Satisfaction with Care
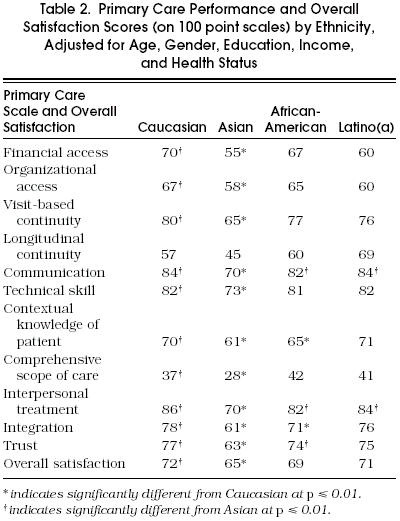
Asian-Americans rated overall satisfaction and every dimension of primary care lower than whites did (Table 2). Interestingly, the only scale for which interethnic differences were not statistically significant was longitudinal continuity, which was derived from a report rather than rating items. The differences between the ratings of Asian-Americans and whites averaged 12 points with a range of 17 points for integration to 7 points for overall satisfaction (on l00-point scales). African-Americans and Latinos rated communication and interpersonal treatment significantly higher than Asians did, and African-Americans rated trust significantly higher. In addition, although African-American ratings were significantly lower for comprehensive contextual knowledge of patient and integration than those of whites, the ratings of Latinos did not significantly differ from those of whites.
Table 2.
Primary Care Performance and Overall Satisfaction Scores (on 100 point scales) by Ethnicity, Adjusted for Age, Gender, Education, Income, and Health Status
Comparison of Reports and Ratings
In an attempt to understand how much of this disparity results from actual quality differences, reports were compared with ratings of waiting times for Asian-Americans and whites. Although the reports of the number of days patients must wait to see their doctor (p = .190) and wait at the physician’s office for an appointment (p = .339) did not differ significantly between Asians and whites, ratings of these waiting times did (p = .006 and p < .001, respectively), indicating that factors other than quality may account for part of the difference. The ratings of Asian-Americans peaked at the center of the distribution more than those of whites, with fewer Asian-Americans giving ratings of excellent or very good. This indicates that there may be interethnic differences in response tendencies.
Normality of Response Distribution
The ratings of Asian-Americans were more normally distributed than those of whites. For financial access, visit-based continuity, communication, technical skill, interpersonal treatment, and integration, the ratings of Asian-Americans appeared to be normally distributed (p ≥ .210 for each), while the ratings of whites were not (p ≤ .007 for each). Neither group’s ratings were normally distributed for longitudinal continuity and overall satisfaction, and both groups’ ratings were normally distributed for organizational access. This evidence suggests there may be differences in response tendencies between the two groups, with Asian-American ratings more evenly distributed around the mean.
“Risk-Adjusting” for Asian Ethnicity on a Physician Profile
Next, for purposes of illustration, we assumed that the differences in ratings were solely the result of factors other than quality of care, such as cultural differences in response tendencies, and adjusted the ratings of the physician with the highest concentration of Asian-American patients (physician A) for the Asian ethnicity of patients (9 Asian patients of 18 total patients responding to the survey). After adjusting for Asian ethnicity, the average scores of Physician A rose from below average on 7 scales to average or above average on 10 of the scales (Figure 1). In fact, after controlling for the Asian ethnicity of patients, physician A’s scores were significantly above average for 4 of the 12 scales (p ≤ .05). This suggests that adjusting for Asian-American ethnicity could significantly improve the profiles of physicians with a large percentage of Asian-American patients.
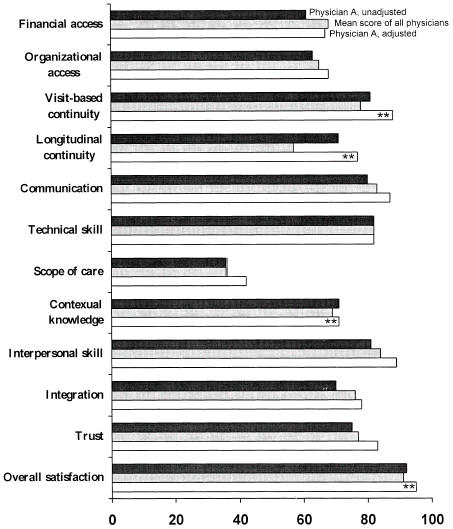
Primary care scores of physician A, relative to mean scores, before and after adjustment for the Asian ethnicity of patients. The asterisks (**) indicate scores that are significantly different from mean scores.
DISCUSSION
Asian-American patients in our sample rated medical services lower than did whites, African-Americans, and Latinos on every dimension of primary care performance except for longitudinal continuity. Overall, they were also less satisfied with their care. On average, their ratings were 12 points lower than those by whites (on 100-point scales). These interethnic disparities in primary care scores are approximately 4 times as large as those resulting from household income level and 12 times as large as those resulting from differences in patient gender. Moreover, they are approximately twice as large, as those found between different types of health care delivery systems (i.e., HMO, preferred provider organization, indemnity).22
The findings from this preliminary study need to be interpreted with caution for several reasons. First, because data are from a single group practice in Boston and include responses from only 25 Asian-American patients, the generalizability of our results is unknown. Second, Asian-Americans vary greatly in their ethnic origin, beliefs about medicine, expectations, cultural background, English language proficiency, and length of time in the United States. In this retrospective analysis of existing data, information was not available on any of these important patient characteristics. Third, because ethnicity was self-reported and unavailable through administrative records, we were unable to calculate ethnic-specific response rates. As the surveys were only written in English, Asian-Americans may have had a lower response rate than other ethic groups; however, this bias would likely lessen the interethnic rating differences as non–English speaking Asian-Americans are more likely to have difficulty communicating with physicians and different culturally based expectations that physicians may not be meeting. Fourth, because we did not videotape the patient-physician encounters and an “objective” third party observer was not present, we cannot determine the extent to which the observed differences reflect differences in survey response tendencies or actual quality differences.
Finally, because of the small number of Asian-American patients and physicians and the variability within the Asian-American patient sample, we were unable to examine any impact of matched ethnicity.
If the differences in ratings between Asians and other ethnic groups result from factors other than actual health care experience, such as patient attitudes or cultural differences in the interpretation of survey responses, patient ratings should be adjusted to reflect the Asian ethnicity of the respondent. Otherwise, the primary care scores of physicians whose panels include a large percentage of Asian-American patients may be lower than those of other physicians for reasons beyond their control. Our simulation found that “risk-adjusting” the ratings of the physician with the highest percentage of Asian-American patients significantly affected this physician’s relative primary care performance.
Although caution is needed because we had only two pairs of items, some evidence to support the need for risk adjustment is that Asian-American patients’ reports of access did not differ significantly from whites’ reports, but the ratings of Asian-American patients were lower than those of whites. In addition, although patient ratings of physicians tend to be highly skewed toward positive ratings, the ratings of Asian-Americans in our study were generally found to be normally distributed, indicating potential differences in rating tendencies.
We should not be too quick, however, to “risk-adjust” away ethnic differences in patient ratings as there may be actual differences in quality that need to be addressed. There are several reasons to believe that the primary care of Asian-Americans needs to be improved. First, patient ratings of physician services are positively correlated with the frequency of physician visits, and Asian-Americans have the fewest office visits of any ethnic group. 23,24
Second, although Asian-Americans may be relatively healthy as a group, their rates of potentially preventable diseases, such as tuberculosis, hepatitis B, liver cancer, and lung cancer, are higher than those of other ethnic groups. For instance, the tuberculosis rate of elderly Asian-Americans was found to be 12 times as high as that of whites.29 In addition, in the United States from 1992 to 1993, the incidence of AIDS was increasing more rapidly among Asian-Americans and Pacific Islanders than among whites.30 A strong primary care relationship with a clinician could potentially lessen these differences.
Several factors compel a greater research emphasis on Asian-American health and health care. These factors include their growing percentage in the U.S. population, poor health relative to the U.S. norm (for some Asian subpopulations), prevalence of contagious diseases that threaten others in the population, rising participation in the labor force, and the high subsequent cost to the general society of unattended health needs.
Further, the growing principal interest in health care reform is becoming quality improvement. Managed care organizations will become less interested in mean scores and more interested in scores of specific subpopulations of their patients so that quality improvement initiatives can be more efficiently targeted. Primary care physicians will be under great pressure to improve ratings provided by their patients. They will need to know specifically how to focus a combination of efforts that include improved services, enhanced communication, added cultural sensitivity with customized clinical approaches, use of culturally similar intermediaries or community representatives, attention to clinical ambiance, and a working familiarity with the importance of social factors as determinants of health status, adherence, satisfaction, and outcomes.
Until we begin to focus studies on Asian-Americans,31,32 examining the reasons for the lower patient satisfaction scores and the potential to improve these scores through targeted interventions, we will be able neither to account for the ethnic disparities in patient evaluations of care nor improve primary care performance and its resultant outcomes.
Acknowledgments
We thank Associate Editor, Judy Shea, PhD, and the two anonymous reviewers for their thoughtful comments and contributions to this manuscript.
REFERENCES
- 1.U.S. Congress, Office of Technology Assessment The Quality of Medical Care: Information for Consumers. Washington, DC: U.S. Government Printing Office; 1988. U.S. Congress Report OTA-H-386.
- 2.Gold M, Wooldridge J. Surveying consumer satisfaction to assess managed-care quality: current practices. Health Care Financing Rev. 1995;16:155–73. [PMC free article] [PubMed] [Google Scholar]
- 3.Schlackman N. Evolution of a quality-based compensation model: the third generation. Am J Med Qual. 1993;8:103–10. doi: 10.1177/0885713X9300800214. [DOI] [PubMed] [Google Scholar]
- 4.Liebow JL. Consumers assessments of the quality of medical care. Med Care. 1974;12:328–37. doi: 10.1097/00005650-197404000-00004. [DOI] [PubMed] [Google Scholar]
- 5.Pascoe GC. Patient satisfaction in primary health care: a literature review and analysis. Eval Prog Plann. 1983;6:185–210. doi: 10.1016/0149-7189(83)90002-2. [DOI] [PubMed] [Google Scholar]
- 6.Cleary PD, Edgman-Levitan S, Roberts M, et al. Patients evaluate their hospital care: a national survey. Health Aff (Millwood) 1991;10:254–67. doi: 10.1377/hlthaff.10.4.254. [DOI] [PubMed] [Google Scholar]
- 7.Zapka JG, Palmer RH, Hargraves JL, Nerenz D, Frazier HS, Warner CK. Relationships of patient satisfaction with experience of system performance and health status. J Ambulatory Care Manage. 1995;18:73–83. doi: 10.1097/00004479-199501000-00008. [DOI] [PubMed] [Google Scholar]
- 8.Gerbert B, Hargreaves WA. Measuring physician behavior. Med Care. 1986;24:838–47. doi: 10.1097/00005650-198609000-00005. [DOI] [PubMed] [Google Scholar]
- 9.Davies A, Ware JE. Involving consumers in quality of care assessment. Health Aff (Millwood) 1988;7:33–48. doi: 10.1377/hlthaff.7.1.33. [DOI] [PubMed] [Google Scholar]
- 10.Meredith LS, Siu AL. Variation and quality of self-report health data: Asians and Pacific Islanders compared with other ethnic groups. Med Care. 1995;33:1120–31. doi: 10.1097/00005650-199511000-00005. [DOI] [PubMed] [Google Scholar]
- 11.Ware JE, Jr, Snyder MK, Wright WR, Davies AR. Defining and measuring patient satisfaction with medical care. Eval Prog Plann. 1983;6:247–63. doi: 10.1016/0149-7189(83)90005-8. [DOI] [PubMed] [Google Scholar]
- 12.Fowler FJ. Newbury Park, Calif: Sage Publications; 1990. Survey Research Methods. [Google Scholar]
- 13.Safran DG, Tarlov AR, Rogers WH, Ware JE, Kosinski M, Taira DA. Primary Care Assessment Survey. Boston, Mass: The Health Institute New England Medical Center; 1994. [Google Scholar]
- 14.Institute of Medicine . Washington, DC: National Academy Press; 1994. Defining Primary Care: An Interim Report. [Google Scholar]
- 15.Davies AR, Ware JE, Brook RH, Peterson JR, Newhouse JP. Consumer acceptance of prepaid and fee-for-service medical care: results from a randomized controlled trial. Health Serv Res. 1986;21:429–52. [PMC free article] [PubMed] [Google Scholar]
- 16.U.S. Preventive Services Task Force . Baltimore, Md: Williams & Wilkins; 1989. Guide to Clinical Preventive Services: An Assessment of the Effectiveness of 169 Interventions. [Google Scholar]
- 17.Starfield B. New York, NY: Oxford University Press; 1992. Primary Care: Concept, Evaluation, and Policy. [Google Scholar]
- 18.Likert RA. A technique for the measurement of attitudes. Arch Psychol. 1932;140:5. [Google Scholar]
- 19.Rao CR. Estimation of variance and covariance components in linear models. J Am Stat Assoc. 1975;67:112–5. [Google Scholar]
- 20.Huber PJ. Proceedings of the Fifth Berkeley Symposium. Berkeley, Calif.: University of California Press; 1965. The behavior of maximum likelihood estimators under non-standard conditions; pp. 221–33. [Google Scholar]
- 21.Kleinbaum DG, Kupper LL, Muller KE. Belmont, Calif: Duxbury Press; 1988. Applied Regression Analysis and Other Multivariable Methods. [Google Scholar]
- 22.Safran DG, Tarlov AR, Rogers WH. Primary care performance in fee-for-service and prepaid health care systems; results from the Medical Outcomes Study. JAMA. 1994;271:1579–86. [PubMed] [Google Scholar]
- 23.Yu ES, Cypress BK. Visits to physicians by Asian/Pacific Americans. Med Care. 1982;20:809–20. doi: 10.1097/00005650-198208000-00005. [DOI] [PubMed] [Google Scholar]
- 24.Boult L, Boult C. Underuse of physician services by older Asian-Americans. J Am Geriatr Soc. 1995;43:408–11. doi: 10.1111/j.1532-5415.1995.tb05816.x. [DOI] [PubMed] [Google Scholar]
- 25.Tanjasiri SP, Wallace SP, Shibata K. Picture imperfect: hidden problems among Asian Pacific Islander elderly. Gerontologist. 1995;35:753–60. doi: 10.1093/geront/35.6.753. [DOI] [PubMed] [Google Scholar]
- 26.Chen MS, Hawks BL. A debunking of the myth of healthy Asian Americans and Pacific Islanders. Am J Health Promot. 1995;9:261–8. doi: 10.4278/0890-1171-9.4.261. [DOI] [PubMed] [Google Scholar]
- 27.Kwon IWG, Bae M. Health status of Asian Pacific Americans in Missouri. Mo Med. 1995;92:648–52. [PubMed] [Google Scholar]
- 28.Mahoney FJ, Lawrence M, Scott C, Le Q, Lambert S, Farley TA. Continuing risk for hepatitis B virus transmission among Southeast Asian infants in Louisiana. Pediatrics. 1995;96:1113–6. [PubMed] [Google Scholar]
- 29.Kitano H. Health and Asian American elderly: research and policy issues. In: Baressi CM, editor. Health and Minority Elders: An analysis of Applied Literature. Washington, DC: American Association of Retired Persons; 1994. [Google Scholar]
- 30.Choi KH, Coates TJ, Catania JA, Lew S, Chow P. High HIV risk among gay Asian and Pacific Islander men in San Francisco. AIDS. 1995;9:306–8. Letter. [PubMed] [Google Scholar]
- 31.Yu ESH, Liu WT. US National health data on Asian Americans and Pacific Islanders: a research agenda for the 1990s. Am J Public Health. 1992;82:1645. doi: 10.2105/ajph.82.12.1645. [DOI] [PMC free article] [PubMed] [Google Scholar]
- 32.Lin-Fu JS. Population characteristics and health care needs of Asian Pacific Americans. Public Health Rep. 1988;103:18. [PMC free article] [PubMed] [Google Scholar]