

Abstract
OBJECTIVE
To develop, within the framework of continuous quality improvement, new processes for offering mammography and determine whether protocols executed completely by nonphysicians would increase mammography utilization.
DESIGN
A prospective follow-up study with patients from an intervention clinic and two control clinics.
SETTING
Three general internal medicine clinics in a large, urban teaching hospital in Detroit, Michigan.
PATIENTS/PARTICIPANTS
A total of 5,934 women, aged 40 through 75 years, making 16,546 visits to one of the clinics during the study period (September 1, 1992, through November 31, 1993).
INTERVENTION
Medical assistants and licensed practical nurses in the intervention clinic were trained to identify women due for screening mammography, and to directly offer and order a mammogram if patients agreed.
MEASUREMENTS AND MAIN RESULTS
Patients were considered up-to-date with screening if they had a mammogram within 1 year (if age 50–75) or 2 years (if age 40–49) prior to the visit or a mammogram within 60 days after the visit. The proportion of visits each month in which a woman was up-to-date with mammography was calculated using computerized billing records. Prior to the intervention, the proportion of visits in which women were up-to-date was 68% (95% confidence interval [CI] 63%, 73%) in the intervention clinic and 66% (95% CI 61%, 71%) in each of the control clinics. At the end of the evaluation, there was an absolute increase of 9% (95% CI 2%, 16%) in the intervention clinic, and a difference of 1% (95% CI −5%, 7%) in one of the control clinics and −2% (95% CI −3%, 5%) in the other. In the intervention clinic, the proportion of visits in which women were up-to-date with mammography increased over time and was consistent with a linear trend (p = .004).
CONCLUSIONS
Redesigning clinic processes to make offering of mammography by medical assistants and licensed practical nurses a routine part of the clinic encounter can lead to mammography rates that are superior to those seen in physicians’ usual practice, even when screening levels are already fairly high. Physicians need not be considered the sole, or even the primary, member of the health care team who can effectively deliver some preventive health measures.
Keywords: mammography; quality management, continuous; breast neoplasms
There is ample evidence that mammography is effective in detecting asymptomatic breast cancer and in decreasing mortality from this disease,1–7 which will affect approximately 184,000 women in the United States.8 Although population-based surveys have found that the proportion of women who have ever had a screening mammogram has been increasing,9,10 a national survey in 1992 found that on average, only 45% of women over 50 had received a mammogram in the past year,10 and approximately one third of women received regular screening.10 These estimates are far below the goal for the year 2000 set by the United States Public Health Service.11 Furthermore, managed care organizations and individual physicians are increasingly being evaluated by their adherence rates to practice guidelines, such as screening mammography.12,13
Numerous studies have found that a recommendation for screening mammography by a physician is a strong determinant of whether a woman receives a mammogram,10,14–22 and is more important than a woman’s health beliefs or perceptions about mammography.16,17 In fact, 82% to 95% of women will have a mammogram if they are advised by their physician to do so.9,21 Despite this fact, the rates at which physicians offer mammograms are not optimal.23
To increase breast cancer screening rates, several interventions have focused on increasing the rate at which physicians offer mammography. These interventions have targeted various types of reminders to physicians,8,22,24–28 or feedback to physicians on their performance,29 or both.30,31 Although results have not always been positive,27,28 providing physicians with reminders during the office visit has raised the mammography rate to as high as 72%,22 corresponding to an increase, in absolute terms, of as much as 25%.8,22 Providing physicians with feedback on their performance has led to rates of over 60%,29,31 leading to absolute increases of over 20%. Although many studies have shown an improvement in mammography rates after interventions with physicians, mammography use is still short of the goal of 80% compliance set for the year 2000.11
In 1995, Herman et al. conducted a study that went beyond reminding the physician.23 In their study, a nurse, or nursing assistant filled out the x-ray requisition for the physician, attached it to the patient’s chart, and gave each patient a brochure about mammography. Their intervention was associated with an absolute increase in offering rates of approximately 9% to 10%. In this study, however, the physician was still a necessary part of the process of offering the mammogram. We hypothesized that mammography rates would improve through the use of protocols executed by nonphysician members of the health care team, in a model that does not include the physician as an instrumental part of the process of ordering a mammogram.
METHODS
This study was conducted in three general internal medicine clinics, all on one floor in the ambulatory care building of Henry Ford Hospital, a large, urban teaching hospital in Detroit, Michigan. Attending physicians and the first-, second-, and third-year residents whom they supervise provide primary care to individuals who live in Detroit and the surrounding areas. Physicians at Henry Ford Hospital are part of the Henry Ford Medical Group (HFMG), a large, multidisciplinary group practice in southeastern Michigan.
General Goals of the Team-Centered Model
In September 1992, one of the clinics (designated the intervention clinic) was reorganized to foster a team approach that emphasized a more active involvement of nonphysicians in patient care, and used the principles of continuous quality improvement32,33 in the improvement of its processes. One of the redesigned features, which was implemented in October 1992, was the development of a team-centered model for the delivery of preventive services. In this process, nonphysician staff determine whether a patient is due for vaccination against influenza or pneumococcal pneumonia or for screening mammography at the time the patient enters the examination room.
As part of the model, the medical assistant or the licensed practical nurse (LPN) identifies patients who are due for preventive services (mammography, influenza vaccination, or pneumococcal vaccination), and offers any necessary services directly to the patient before the physician or physician assistant sees the patient. If the patient agrees, the LPN or medical assistant writes the order on the encounter form (always signed at the end of the encounter by the physician, for billing purposes). At the end of the visit, when this form is signed by the physician, the required vaccinations are given and the mammogram is scheduled by the clinic staff, if necessary. The LPN or medical assistant also documents the receipt of vaccinations and mammography on a preventive services flow sheet on the left side of the medical record. For patients who decline or are unsure about receiving the indicated services, the LPN or medical assistant documents this on the clinic progress note for the provider to discuss with the patient. A patient’s refusal is also documented on the preventive services flow sheet. Because there were no individual billing records for immunizations, the effectiveness of offering these preventive services was not evaluated. The results from the mammography protocols form the basis for this report.
Implementation of the Screening Mammography Model
The providers at the intervention clinic agreed on adequate screening guidelines based on the American Cancer Society recommendations34: a mammogram every 2 years for women aged 40 to 49 years, and every year for women aged 50 to 75 years. During team meetings, protocols were developed for the LPNs and medical assistants on which patients to ask, how to determine whether a mammogram had actually been performed, and how to document, on the preventive services flow sheet or progress note, the fact that a mammogram was offered, ordered, and completed. A flow diagram (Fig. 1) was developed to ensure consistency and to be used as a teaching aid for new staff members.
FIGURE 1.

Flow diagram of mammogram protocol for women aged 40 to 75 years.
Using the protocol outlined in Figure 1, when a woman aged 40 to 75 years was seen at the intervention clinic, the LPN or medical assistant would check the preventive services flow sheet on the left side of the medical record to determine if the woman had received adequate screening according to guidelines. If it were documented that the woman was up-to-date with screening mammography, then no mammogram was ordered. If no data were available on the flow sheet, the LPN or medical assistant would ask the woman about screening mammography. If the woman reported that she had received appropriate screening outside the HFMG, or received appropriate screening within the HFMG but the medical record was unavailable, the date of the mammogram was recorded on the progress note, and no mammogram was ordered. If the woman reported that the mammogram was performed within the HFMG, and this was not documented in the medical record, “report missing, needs mammogram?” was written on the progress note, but no mammogram was ordered. If documentation of appropriate screening was confirmed in the medical record, this information was recorded on the flow sheet, and no mammogram was ordered. If the woman reported that she was not up-to-date, a mammogram was offered by the LPN or medical assistant. If the woman agreed to have a mammogram, an x-ray requisition form was completed and the test was ordered. If the woman declined a mammogram, a note was made on the progress note for the provider, and no mammogram was ordered.
Evaluation of the Process
To evaluate the process used in the model, two types of measurement were used. One measure was informal, and the goal was to provide feedback for continuous quality improvement. For this measure, at the end of the day, the nursing staff selected medical records at random from those of patients who were seen in the clinic that day. Medical records were chosen until five women aged 40 to 75 years were identified. These records were reviewed, and the number of women who were successfully screened was recorded. Because the process was being evaluated, a woman was classified as successfully screened if there was documentation that she already received a mammogram according to guidelines, or if a mammogram was offered at the visit. At the end of each week, the results were combined and the proportion of women that were successfully screened was plotted on a chart and posted in the clinic. This measure was instituted in February 1993 because the team felt that more direct and timely feedback would lead to greater improvement.
Another measure used to evaluate the process was to compare the intervention and two control clinics for the proportion of visits in which women had received mammography according to guidelines. For this measure, a computerized audit of billing records was performed. All women with at least one billing record of a visit to a study clinic during each month from September 1, 1992, through November 31, 1993, were identified. Because the quality improvement process was implemented in October, women with a visit in September were included in the study to provide baseline data. For each woman who made a visit during the study period, all mammograms performed at the HFMG between September 1, 1991 and December 31, 1993 were obtained from the billing data.
The following information was determined for each woman: (1) whether she was already up-to-date with mammography at the time of the visit (i.e., had a mammogram within the previous year if age 50–75 or within the previous 2 years if age 40–49); or (2) whether she received a mammogram within 60 days of the visit. During a visit to one of the study clinics, if a woman satisfied either of the two criteria listed above, that visit was classified as a success in terms of being up-to-date with screening mammography.
Statistical Analysis
For each month during the study period, the percentage of visits in which women were successfully screened (already up-to-date with mammography or received a mammogram within 60 days of the visit) was calculated for each clinic. The χ2 test was used to test for differences in proportions between the three clinics during each month. Differences between proportions at the end point of the study and baseline, and corresponding 95% confidence intervals (CIs), were calculated. In order to test for linear trend, a separate logistic regression model was fit for each clinic in which the outcome of successful screening was coded as dichotomous (yes/no) and the months of the study period were coded as an ordinal independent variable (1–15).
We were interested in evaluating whether the process was successful; therefore, analyses included the proportion of visits, rather than women, that were successfully screened. As a result, women who visited one of the study clinics more than once during the specified time period were included in the analysis more than once. To examine whether the results would be affected if the analysis were limited to one visit per woman, we randomly selected one visit per woman and examined the proportion of women successfully screened (just as was done for visits).
RESULTS
For the 15-month period from September 1, 1992 (1 month prior to implementation of the quality improvement process in the intervention clinic), through November 31, 1993, a total of 5,934 women between the ages of 40 and 75 visited one of the three study clinics. During the study period, these women made 16,546 visits, with an average of 2.7 visits per woman for the intervention clinic. There was an average of 2.9 visits per woman for one control clinic and 2.7 visits per woman for the other control clinic. The demographic characteristics of patients who visited each of the clinics are similar, and are shown in Table 1.
Table 1.
Demographic Characteristics of Patients Served by Study Clinics (N = 5,934 patients)

Using the informal clinic measurement, which began in February 1993 and consisted of the review of five randomly selected medical records at the end of the clinic day, the percentage of women seen each week that were either up-to-date or offered a mammogram rose quickly to approximately 90% to 96%. For the other type of measurement, using billing data, the percentage of visits in which women at each clinic were successfully screened (up-to-date with guidelines or received a mammogram within 60 days of the visit) are presented, for the 15-month period, in Figure 2. For the month prior to intervention, among the 327 visits made in the intervention clinic, 68% (95% CI 63%, 73%) of women were successfully screened. Among 315 visits in one control clinic and 424 in the other, both clinics had identical percentages of 66% (95% CI 61%, 71%) of women successfully screened. By November 1993, the proportion of visits with appropriate mammography screening had risen to 77% (195/253) for the intervention clinic (95% CI 72%, 82%), which corresponds to an absolute increase of 9% over the 15-month period (95% CI 2%, 16%). With respect to the control clinics, one site had a difference of 1% (95% CI −5%, 7%) over the study period, and the other had a difference of −2% (95% CI −3%, 5%). Figure 2 illustrates that there was variation in the proportions of women successfully screened over the study period. The process appears to be effective, however, as evidenced by the fact that increases in successful screening are seen in the intervention clinic and not in the control clinics. In fact, the increasing proportion of visits in which women were successfully screened in the intervention clinic are consistent with a linear trend (p = .004).
FIGURE 2.
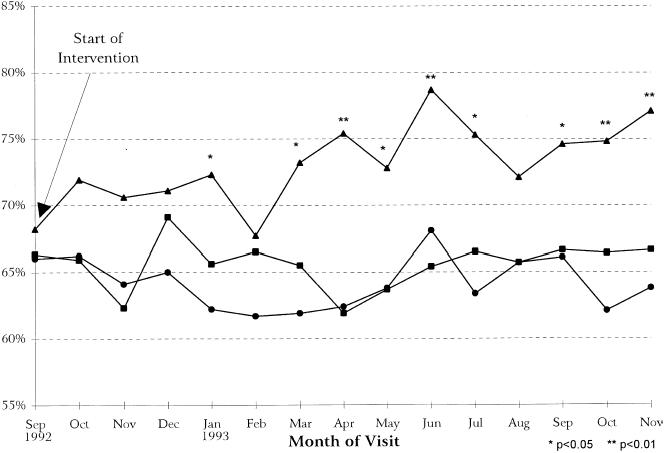
Percentage of visits in which women were already up-to-date with guidelines or received a mammogram within 60 days of the visit (N = 16,546 visits): (–▴–) intervention clinic; (–▪–) control clinic A; (–•–) control clinic B.
We evaluated whether the results would be affected if the analysis were limited to one visit per woman. As would be expected the variability in the estimates increased because the numbers decreased; however, the magnitude of the difference in the intervention clinic over the 15-month period was still 9% (95% CI −2%, 20%), and the results remained consistent with a linear trend (p = .04). In the two control clinics, when only one visit per woman was included, one clinic showed a difference in mammography use of −2% (95% CI −13%, 9%) and the other a difference of −8% (95% CI −11%, 3%) over the study period.
DISCUSSION
The offering of preventive services by physicians has been suboptimal, most likely due to time constraints, a focus on acute problems, and simple forgetfulness.35–38 Some studies, 8,22,24–26,29–31 but not all,27,28 have found that systems which provide feedback and reminders to physicians are effective in increasing mammography rates. To increase the rates at which physicians offer preventive services, many health systems have focused not only on reminders but also on performance measures and accountability. One study that was successful in increasing physician offering of mammography presented a reminder to the physician, who was required to respond to the reminder by ordering the preventive service or indicating “not applicable,” “patient refused,” or “next visit.” These authors suggested that we, “place the onus on the individual physician to justify not complying for each and every apparently eligible patient.”26 However, systems using reminders, feedback, or physician accountability do not solve the problem of time constraints. There is a limit to what a physician can accomplish during one office visit, especially when there is a long list of issues that should be inquired about and addressed (e.g., advance directives, substance abuse, violence) and a trend toward moving away from comprehensive yearly visits.
A fundamentally different approach to preventive care is to consider the tasks that must be accomplished to provide optimal care, and to design systems built around a health care team to accomplish those tasks.33 Redesigning processes around a health care team to reduce barriers to the desired outcome39 may be the best and most cost-effective alternative to physicians providing all necessary preventive health services. Our results show that even in a setting with fairly high baseline rates of mammography, this approach was successful, with an absolute increase of 9% in the proportion of visits in which women were up-to-date with screening or received a mammogram within the next 60 days. Although the absolute increase in mammography in this study is smaller than in previous studies using interventions targeted at physicians, the baseline rate of 68% was similar to,31 or higher than,29 postintervention rates in other studies. Our findings are notable because the results were achieved using nonphysician personnel. Furthermore, because some women receive a mammogram outside the HFMG, the postintervention screening success rate of 77% is likely to be an underestimate.
Our findings are consistent with a study of influenza vaccinations,40 in which the intervention included a policy, based on standing orders, allowing nurses to offer and provide influenza vaccinations directly to patients. The removal of many possible barriers to vaccination, including the necessity for physicians’ orders before administering each vaccine, led to substantially increased vaccination rates in a high-risk population.40
Our study builds on the work of Herman et al.,23 in which nurses or nursing assistants facilitated the ordering of mammography by completing the radiology requisition and attaching it to the chart for the physician. They found that increasing the role of nonphysician staff in this way helped to increase the rate of screening mammography among the women without a previous mammogram. Our process takes this approach one step further, by actually having the nonphysician staff (LPN or medical assistant) offer mammography to the patient, without physician involvement unless the patient expresses concerns or questions. In our study, the amount of time involved in the process of offering mammography and other preventive services was small, averaging less than 3 minutes. In fact, the amount of time required under this model may be less than in physicians’ usual practices because the process streamlined the recording of preventive health history on the left side of the flow sheet.
One potential concern about delegating mammography offering is that the physicians’ involvement may be necessary to the process. For example, physician involvement may be needed when deciding that a 40-year-old woman with positive risk factors needs annual, rather than biannual, screening. Conversely, routine screening has been accomplished by self-referral, including the use of mobile mammography vans at the work site.41 In addition, the protocols in this study were designed only to ensure minimal screening standards, not to replace good clinical decision making.
We used a process which is different from many previous studies; in accordance with continuous quality improvement methods, success was measured based on the information obtained when the medical records were randomly selected (five records per day). This measurement provided feedback and reinforcement to the clinic team and may be superior to semiannual or annual measures (e.g., Health Employers Data Information Set indicators),12,13 because it helps to continuously improve the process. In fact, the greatest improvement in the proportion of visits in which women were considered successfully screened in the intervention clinic began in February 1993, the time at which the LPNs and medical assistants themselves began sampling five medical records per day. At this time, the results were compiled weekly and a chart was placed in the clinic. Although this study was not designed to evaluate continuous quality improvement methods themselves, anecdotally, the members of the clinic expressed satisfaction, and felt that these methods helped them to achieve the goal of increasing screening mammography.
One limitation of this study is that only 1 month of baseline data was available for analysis. Because of clinic reorganizations, it is not possible to obtain data for more than 1 month before the intervention. If data were available for a more extended period before the intervention, we would have a better estimate of the baseline rate of mammography.
One might argue that using visits, rather than women, as the unit of analysis is a limitation of this study. If for some reason women who were up-to-date with mammography in the intervention clinic had more frequent visits than their counterparts in the control clinics, this might account for the higher rates in the intervention clinic. We chose to use visits as the primary unit of analysis because the intervention was intended to change the process through which mammography was offered. It is at each visit that the process occurred and the mammography status was checked by the clinic staff. Therefore, by analyzing visits, rather than women, we were able to measure the outcome of the clinical process (i.e., whether a woman left the appointment already up-to-date with screening or received mammography within 60 days of the visit) over time. When we conducted the analysis a second time, using only one (random) visit per woman, the conclusions were not materially different. In fact, for each control clinic, the differences in the percentage of women successfully screened over the study period were lower than in the analysis using visits.
We need to rethink traditional ideas about the best way to deliver health care. To remain competitive, managed care organizations will have to increase the delivery of preventive services and to measure their performance. In treating their patients, physicians are faced with time constraints and issues that compete with the promotion of preventive services. Therefore, making the physician responsible for offering and ordering screening mammography may not be the optimal method. Rather, redefining the roles of nonphysician staff in the health care team, and implementing a process in which these staff are directly responsible for offering preventive services is a promising alternative that can lead to better care while allowing physicians to focus on the other care issues that require their specific skills.
Acknowledgments
The authors thank Kim Sadlocha and Lynn Flickinger for assistance with manuscript preparation.
References
- 1.Baker LH. Breast Cancer Detection Demonstration Project: five-year summary report. CA Cancer J Clin. 1982;32:194–225. doi: 10.3322/canjclin.32.4.194. [DOI] [PubMed] [Google Scholar]
- 2.Morrison AS, Brisson J, Khalid N. Breast cancer incidence and mortality in the Breast Cancer Detection Demonstration Project. J Natl Cancer Inst. 1988;80:1540–7. doi: 10.1093/jnci/80.19.1540. [DOI] [PubMed] [Google Scholar]
- 3.Shapiro S, Venet W, Strax P, Venet L, Roeser R. Ten- to fourteen-year effect of screening on breast cancer mortality. J Natl Cancer Inst. 1982;69:349–55. [PubMed] [Google Scholar]
- 4.Verbeek AL, Hendriks JH, Holland R, Mravunac M, Sturmans F, Day NE. Reduction of breast cancer mortality through mass screening with modern mammography. Lancet. 1984;1:1222–4. doi: 10.1016/s0140-6736(84)91703-3. First results of the Nijmegen project, 1975–1981. [DOI] [PubMed] [Google Scholar]
- 5.Tabar L, Fagerberg CJ, Gad A, et al. Reduction in mortality from breast cancer after mass screening with mammography. Randomised trial from the Breast Cancer Screening Working Group of the Swedish National Board of Health and Welfare. Lancet. 1985;1:829–32. doi: 10.1016/s0140-6736(85)92204-4. [DOI] [PubMed] [Google Scholar]
- 6.De Koning HJ, Francheboud J, Boer R, et al. Nation-wide breast cancer screening in The Netherlands: support for breast-cancer mortality reduction. Int J Cancer. 1995;60:777–80. doi: 10.1002/ijc.2910600608. National Evaluation Team for Breast Cancer Screening (NETB) [DOI] [PubMed] [Google Scholar]
- 7.Smart CR, Hendrick RE, Rutledge JH, Smith RA. Benefit of mammography screening in women ages 40 to 49 years. Cancer. 1995;75:1619–26. doi: 10.1002/1097-0142(19950401)75:7<1619::aid-cncr2820750711>3.0.co;2-t. [DOI] [PubMed] [Google Scholar]
- 8.Parker SL, Tong T, Bolden S, Wingo PA. Cancer statistics, 1996. CA Cancer J Clin. 1996;65:5–27. doi: 10.3322/canjclin.46.1.5. [DOI] [PubMed] [Google Scholar]
- 9.Coleman EA, Feuer EJ. Breast cancer screening among women from 65 to 74 years of age in 1987–88 and 1991. Ann Intern Med. 1992;117:961–6. doi: 10.7326/0003-4819-117-11-961. NCI Breast Cancer Screening Consortium. [DOI] [PubMed] [Google Scholar]
- 10.Centers for Disease Control and Prevention. Use of mammography—United States, 1990. MMWR. 1990;39:621–30. [Google Scholar]
- 11.US Department of Health and Human Services Public Health Service. Healthy People 2000. Washington, DC: DHHS publication (PHS); 1990. National Health Promotion and Disease Prevention Objectives. pp. 91–50212. Superintendent of Documents, US Government Printing Office. [Google Scholar]
- 12.The National Committee for Quality Assurance. Washington, DC: The National Committee for Quality Assurance; 1993. Health Plan Employer Data and Information Set 2.0. [Google Scholar]
- 13.The National Committee for Quality Assurance. Washington, DC: The National Committee for Quality Assurance; 1995. HEDIS 2.5. Updated Specifications for HEDIS 2.0. [Google Scholar]
- 14.Love RR, Brown RL, Davis JE, Baumann LJ, Fontana SA, Sanner LA. Frequency and determinants of screening for breast cancer in primary care group practice. Arch Intern Med. 1993;153:2113–7. [PubMed] [Google Scholar]
- 15.Fox SA, Stein JA. The effect of physician-patient communication on mammography utilization by different ethnic groups. Med Care. 1991;29:1065–82. doi: 10.1097/00005650-199111000-00001. [DOI] [PubMed] [Google Scholar]
- 16.Nielsen CC. Women’s use of mammographic screening: the role of information, cues, and reinforcement. Conn Med. 1990;54:374–7. [PubMed] [Google Scholar]
- 17.Stein JA, Fox SA, Murata PJ, Morisky DE. Mammography usage and the health belief model. Health Educ Q. 1992;19:447–62. doi: 10.1177/109019819201900409. [DOI] [PubMed] [Google Scholar]
- 18.Friedman LC, Woodruff A, Lane M, Weinberg AD, Cooper HP, Webb JA. Breast cancer screening behaviors and intentions among asymptomatic women 50 years of age and older. Am J Prev Med. 1995;11:218–23. [PubMed] [Google Scholar]
- 19.Fox SA, Murata PJ, Stein JA. The impact of physician compliance on screening mammography for older women. Arch Intern Med. 1991;151:50–6. [PubMed] [Google Scholar]
- 20.Champion VL. Compliance with guidelines for mammography screening. Cancer Detect Prev. 1992;16:253–8. [PubMed] [Google Scholar]
- 21.Coll PP, O’Connor PJ, Crabtree BF, Besdine RW. Effects of age, education, and physician advice on utilization of screening mammography. J Am Geriatr Soc. 1989;37:957–62. doi: 10.1111/j.1532-5415.1989.tb07281.x. [DOI] [PubMed] [Google Scholar]
- 22.Kohatsu ND, Cramer E, Bohnstedt M. Use of a clinician reminder system for screening mammography in a public health clinic. Am J Prev Med. 1994;10:348–52. [PubMed] [Google Scholar]
- 23.Herman CJ, Speroff T, Cebul RD. Improving compliance with breast cancer screening in older women. Results of a randomized controlled trial. Arch Intern Med. 1995;155:717–22. [PubMed] [Google Scholar]
- 24.Ornstein SM, Garr DR, Jenkins RG, Rust PF, Arnon A. Computer-generated physician and patient reminders. Tools to improve population adherence to selected preventive services. J Fam Pract. 1991;32:82–90. [PubMed] [Google Scholar]
- 25.Chambers CV, Balaban DJ, Carlson BL, Ungemack JA, Grasberger DM. Microcomputer-generated reminders. Improving the compliance of primary care physicians with mammography screening guidelines. J Fam Pract. 1989;29:273–80. [PubMed] [Google Scholar]
- 26.Litzelman DK, Dittus RS, Miller ME, Tierney WM. Requiring physicians to respond to computerized reminders improves their compliance with preventive care protocols. J Gen Intern Med. 1993;8:311–7. doi: 10.1007/BF02600144. [DOI] [PubMed] [Google Scholar]
- 27.Turner RC, Waivers LE, O’Brien K. The effect of patient-carried reminder cards on the performance of health maintenance measures. Arch Intern Med. 1990;150:645–7. [PubMed] [Google Scholar]
- 28.Tape TG, Campbell JR. Computerized medical records and preventive health care: success depends on many factors. Am J Med. 1993;94:619–25. doi: 10.1016/0002-9343(93)90214-a. [DOI] [PubMed] [Google Scholar]
- 29.Nattinger AB, Panzer RJ, Janus J. Improving the utilization of screening mammography in primary care practices. Arch Intern Med. 1989;149:2087–92. [PubMed] [Google Scholar]
- 30.Tierney WM, Hui SL, McDonald CJ. Delayed feedback of physician performance versus immediate reminders to perform preventive care. Effects on physician compliance. Med Care. 1986;24:659–66. doi: 10.1097/00005650-198608000-00001. [DOI] [PubMed] [Google Scholar]
- 31.McPhee SJ, Bird JA, Jenkins CN, Fordham D. Promoting cancer screening. A randomized, controlled trial of three interventions. Arch Intern Med. 1989;149:1866–72. doi: 10.1001/archinte.149.8.1866. [DOI] [PubMed] [Google Scholar]
- 32.Deming WE. Cambridge, Mass: MIT Center for Engineering Study; 1986. Out of the Crisis. [Google Scholar]
- 33.McCarthy BD, Ward RE, Young MJ. Dr. Deming and primary care internal medicine. Arch Intern Med. 1994;154:381–4. [PubMed] [Google Scholar]
- 34.American Cancer Society. Atlanta, Ga: American Cancer Society; 1993. Guidelines for the Cancer-Related Checkup: An Update. [Google Scholar]
- 35.McPhee SJ, Detmer WM. Office-based interventions to improve delivery of cancer prevention services by primary care physicians. Cancer. 1993;72:1100–12. doi: 10.1002/1097-0142(19930801)72:3+<1100::aid-cncr2820721327>3.0.co;2-n. [DOI] [PubMed] [Google Scholar]
- 36.Gemson DH, Elinson J. Prevention in primary care: variability in physician practice patterns in New York City. Am J Prev Med. 1986;2:226–34. [PubMed] [Google Scholar]
- 37.Kottke TE, Brekke ML, Solberg LI. Making “time” for preventive services. Mayo Clin Proc. 1993;68:785–91. doi: 10.1016/s0025-6196(12)60638-7. [DOI] [PubMed] [Google Scholar]
- 38.McGinnis JM, Hamburg MA. Opportunities for health promotion and disease prevention in the clinical setting. West J Med. 1988;149:468–74. [PMC free article] [PubMed] [Google Scholar]
- 39.Greco PJ, Eisenberg JM. Changing physicians’ practices. N Engl J Med. 1993;329:1271–3. doi: 10.1056/NEJM199310213291714. [DOI] [PubMed] [Google Scholar]
- 40.Nichol KL, Korn JE, Margolis KL, Poland GA, Petzel RA, Lofgren RP. Achieving the national health objective for influenza immunization: success of an institution-wide vaccination program. Am J Med. 1990;89:156–60. doi: 10.1016/0002-9343(90)90293-m. [DOI] [PubMed] [Google Scholar]
- 41.Kessler HB, Rimer BK, Devine PJ, Gatenby RA, Engstrom PF. Corporate-sponsored breast cancer screening at the work site: results of a statewide program. Radiology. 1991;179:107–10. doi: 10.1148/radiology.179.1.2006259. [DOI] [PubMed] [Google Scholar]