

Abstract
OBJECTIVE
To determine the rates of resolution of symptoms and return to premorbid health status and assess the association of these outcomes with health care utilization in patients with community-acquired pneumonia.
DESIGN
A prospective, multicenter cohort study.
SETTING
Inpatient and outpatient facilities at three university hospitals, one community hospital, and one staff-model health maintenance organization.
PATIENTS
Five hundred seventy-six adults (aged ≥ 18 years) with clinical and radiographic evidence of pneumonia, judged by a validated pneumonia severity index to be at low risk of dying.
MEASUREMENTS AND MAIN RESULTS
The presence and severity of five symptoms (cough, fatigue, dyspnea, sputum, and chest pain) were recorded through questionnaires administered at four time points: 0, 7, 30, and 90 days from the time of radiographic diagnosis of pneumonia. A summary symptom score was tabulated as the sum of the five individual severity scores. Patients also provided responses to the Medical Outcomes Study 36–Item Short Form Health Survey (SF-36) and reported the number of and reason for outpatient physician visits. Symptoms and health status 30 days before pneumonia onset (prepneumonia) were obtained at the initial interview. All symptoms, except pleuritic chest pain, were still commonly reported at 30 days, and the prevalence of each symptom at 90 days was still nearly twice prepneumonia levels. Physical health measures derived from the SF-36 Form declined significantly at presentation but continued to improve over all three follow-up time periods. Patients with elevated symptom scores at day 7 or day 30 were significantly more likely to report pneumonia-related ambulatory care visits at the subsequent day 30 or day 90 interviews, respectively.
CONCLUSIONS
Disease-specific symptom resolution and recovery of the premorbid physical health status requires more than 30 days for many patients with pneumonia. Delayed resolution of symptoms is associated with increased utilization of outpatient physician visits.
Keywords: pneumonia, health status, outcomes assessment, questionnaires
Previous studies of outcomes in patients with community-acquired pneumonia have focused primarily on early mortality following pneumonia in comparing outcomes across different patient groups, microbiologic etiologies, or types of care.1–4 However, there is growing appreciation that for most patients with pneumonia, especially those at very low risk of dying, the time course of symptomatic and functional recovery is also of great importance.5
Classically, the rate of resolution of pneumonia has been defined in terms of the resolution of radiographic abnormalities associated with the illness.6 However, recovery as defined by chest radiography is an imperfect standard and has not been routinely correlated with clinically meaningful variation in outcomes.7 Alternatively, recovery can be measured based on patient reported health status, but the published literature lacks any instruments to specifically measure recovery from pneumonia. Although generic instruments, such as the Medical Outcomes Study 36-Item Short Form Health Survey (SF-36), are available, they are theoretically less responsive to variations in disease outcomes than specific instruments, in part because specific instruments include only those items that are relevant to the disease under study.8
As part of a cohort study of outcomes in patients with community-acquired pneumonia, we developed an instrument to measure recovery from pneumonia based on the resolution specific symptoms common to patients with pneumonia. The specific aims of the current study are as follows: (1) to compare the time course of recovery as measured by two outcomes measures, the generic SF-36 and our pneumonia symptom questionnaire, in patients recovering from pneumonia; and (2) to validate the pneumonia symptom questionnaire as a predictor of health care utilization.
METHODS
The data for this investigation were obtained as part of the Pneumonia Patient Outcomes Research Team (PORT) multicenter, prospective cohort study of medical outcomes in ambulatory and hospitalized patients with community-acquired pneumonia.
Study Sites
The study was performed at five medical institutions in three geographic locations: the University of Pittsburgh Medical Center and St. Francis Medical Center, in Pittsburgh, Pennsylvania; the Massachusetts General and the Harvard Community Health Plan–Kenmore Center, in Boston, Massachusetts; and the Victoria General Hospital, in Halifax, Nova Scotia, Canada.
Study Population
The population for this study, known as the detailed study group, was drawn from the larger cohort of patients assembled for the Pneumonia PORT cohort study. Potential study subjects were identified by screening patients presenting to emergency departments, medical walk-in clinics, and practitioner offices affiliated with the participating sites. Cohort study inclusion criteria were (1) age of at least 18 years; (2) acute onset of at least 1 of 18 clinical symptoms suggestive of acute illness; (3) chest radiographic evidence of acute pneumonia within 24 hours of presentation; and (4) informed consent by the patient or patient proxy. Patients were ineligible for the cohort study if they were discharged from the hospital within the 10 days preceding presentation, were known to be HIV-positive, or were previously enrolled in the cohort study.
The detailed study cohort was assembled as a consecutive sample of patients with low severity of illness enrolled at the study sites from October 1991 to June 1993. Severity of illness was based on a multivariable model that categorized patients as at low, moderate, or high risk of 60-day mortality based on information available at the time of study enrollment (see below). Study patients who met eligibility criteria were asked to participate in a more detailed study of medical outcomes, with an increased number of questionnaires and duration of follow-up. Only patients who completed questionnaires at all four time points were included in this study. In addition, a small number of patients who required proxies, e.g., relatives or caregivers, to complete the questionnaires were excluded from the study because of the biases documented in other studies comparing caregiver reports of patient health with self-report information.9–11
Overall, 1,485 (65%) of the 2,287 patients enrolled in the Pneumonia PORT cohort study were categorized as at low risk of short-term mortality based on the pneumonia severity of illness index, calculated at the time of study enrollment. Of the 939 low-risk patients who were enrolled in the cohort study during the recruitment period for the detailed study group, 707 (75%) participated in the detailed study. Reasons for nonparticipation in the detailed assessment included patient and physician requests (25%), language barriers (13%), and cognitive or psychiatric impairment (12%). Of the patients enrolled in the detailed study, 576 (81%) provided self-reported answers to the follow-up questionnaires at all four time points and were included in this substudy.
Baseline Data Collection
Baseline data were collected on all patients within 6 days of diagnosis of pneumonia through chart abstraction and patient interview. Data included demographic characteristics, comorbid illnesses, physical examination findings, and laboratory findings. On the basis of 20 variables available at the time of diagnosis, patient severity of illness was categorized as low, moderate, or high. The severity levels were based on a previously validated pneumonia severity of illness index derived from a logistic regression model of short-term mortality in patients with pneumonia (predicted probability of death <4% for low risk).12
Outcomes Assessment
All patients enrolled in the detailed study provided responses to an initial questionnaire (day 0) and three follow-up questionnaires (days 7, 30, and 90 from the time of radiographic diagnosis). At the time of the initial questionnaire, patients were also asked to evaluate their symptoms and health status 1 month before the onset of their illness with pneumonia (prepneumonia). All questionnaires were administered either by interview (either in person or by telephone) with one or two trained research assistants per site, or by written completion of a mailed version of the questionnaire. The distribution of these modes of administration ranged from 99.5% of patients providing responses by interview for the initial questionnaire to 60% of patients providing responses by interview and 38% by written completion of mailed questionnaires for the day 90 follow-up questionnaire.
The items in the symptom questionnaire were selected by a panel of investigators (MJF, TJM, CMC, WNK, and DES) based on an analysis of symptoms at presentation in patients enrolled in two previous cohort studies of community-acquired pneumonia.3,13 The questionnaire included the most prevalent respiratory symptoms identified in those earlier studies. Questions on fatigue were added because fatigue was hypothesized to be important to patients during the longitudinal follow-up. The scaling of the response categories for the severity of respiratory symptoms was primarily based on modifications of an instrument used to quantitate symptoms in patients with chronic lung disease,14 while the questions on fatigue were adapted from a previously validated questionnaire on chronic fatigue.15 Ultimately, the instrument included questions on the presence and severity of five symptoms (cough, dyspnea, sputum production, pleuritic chest pain, and fatigue). Severity of cough, pleuritic chest pain, and fatigue were based on a 5-point scale (1 = mild to 5 = severe); severity of dyspnea on a 4-point scale (1 = with significant physical activity to 4 = at rest); and severity of sputum production on a 3-point scale (1 = less than 2 tablespoons to 3 = 1/2 cup or more).
The SF-36 was administered at the initial and follow-up interviews using the “1-week” recall period rather than the standard “4-week” recall period.16 The primary measure of health resource utilization was based on patient self-reporting of outpatient physician visits at each follow-up time point. Patients provided information on the number of outpatient physician visits as well as a brief reason for each visit that occurred in the interval between subsequent follow-up interviews. One of the study investigators (JPM), blinded to the remaining outcomes data, coded the outpatient visits as pneumonia-related or pneumonia-unrelated according to a set of criteria developed to interpret the reasons provided by patients for visits. Reasons for coding visits as pneumonia-unrelated included periodic or routine examinations for health maintenance (e.g., blood pressure follow-up), urgent visits for alternative diagnoses (e.g., bladder infection, headache), and follow-up visits after 30 days without a stated reason. The remaining visits were coded as pneumonia-related office visits. In a random sampling of 30 patients, the agreement rate for coding the visits between the study investigator and an independent investigator was 97% (κ = 0.91).
Analytical Methods
The generalizability of the study sample was assessed by comparing baseline demographic and clinical variables between the detailed study group and the remaining low severity of illness patients, using Fisher’s Exact Test (for categorical variables)17 and the Mantel-Haenszel x2 test for trend (for ordinal variables).18
For the analysis of symptom resolution over time, both the proportion of all patients reporting each symptom at each time point and the proportion of all patients reporting moderate to severe symptoms were calculated. For each patient, a summary symptom score was calculated at each time point as follows: the severity scale for each of the five symptoms was transformed into a 6-point scale from 0 (no symptom) to 5 (severe symptom) so that each symptom would contribute equally to the summary severity score. The sum of the five severity scales (range 0–25) was then transformed (through direct multiplication) into a 0 to 100 scale for ease of comparison with the SF-36 scales. Mean values for the pneumonia symptom score, along with the standard deviations, were calculated at each time point. The internal reliability of the symptom score was calculated at each time point based on Cronbach’s α statistic.19
The distribution of the symptom scores over time was presented based on five levels of the symptom score (0–20, 21–40, 41–60, 61–80, and 81–100). These levels were chosen because a 20-point change in the scale may represent a clinically meaningful change in symptom reporting. For example, the change resulting from either a single symptom improving from its most severe level to its absence or all symptoms improving by a single severity point would result in a 20-point change in the scale. For the analysis of SF-36 scale resolution over time, mean scores were calculated for each of the eight scales. Patients with missing responses were excluded, and the proportion of missing data is reported in each table or figure. However, patients were eliminated from the calculation of scores of the SF-36 only if more than half of the items for each multi-item scale were missing.16
A comparison of the sensitivity of different scales in measuring change in patients recovering from pneumonia was based on calculations of the effect size for each scale for each follow-up time interval. Effect size was estimated as the mean change in the score for each scale between any two time periods divided by the standard deviation of the score at the initial time period.20
As there is no “gold standard” for recovery from pneumonia, the pneumonia symptom score was validated against the criterion of future pneumonia-related ambulatory medical care. We hypothesized that patients with higher symptom scores would be more likely to subsequently seek medical attention for their illness. This hypothesis was tested on symptom scores based on the day 0, day 7, and day 30 assessments. For the univariate analyses, the proportions of patients who reported a pneumonia-related ambulatory care visit were compared for each level of symptom scores recorded at the previous assessments. For example, symptom scores based on the day 7 assessment were used to predict the probability that a pneumonia-related ambulatory care visit was reported at the subsequent day 30 or day 90 follow-up evaluations. Statistical significance was based on the Mantel-Haenszel x2 test for trend.
Logistic regression analysis was performed to adjust for prespecified sociodemographic and clinical predictors on the impact of the symptom score on subsequent reporting of pneumonia-related ambulatory care visits. The level of the symptom score was added as a categorical predictor to a logistic regression model that included terms for age, site of care, the presence of pulmonary or cardiovascular comorbidities, and the severity of illness index.
Patient Characteristics
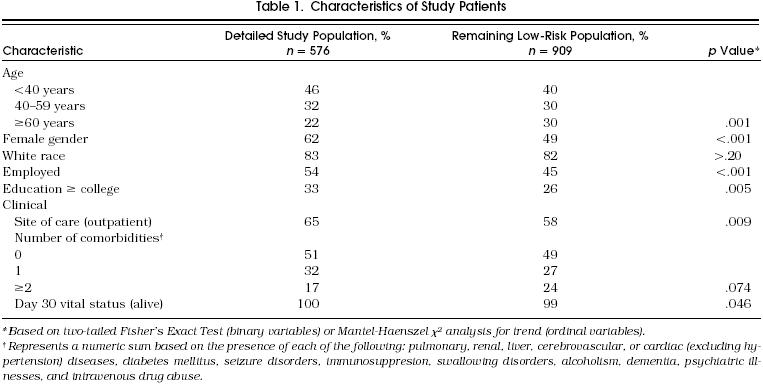
Table 1 compares the baseline demographic and clinical characteristics of the 576 patients in the detailed population assembled for this study and the remaining 909 low-risk cohort study patients. The detailed study population was younger (78% < 60 years vs 70%, p = .001), and a greater proportion were female, employed, or highly educated. In addition, although distribution of comorbidities did not vary significantly between the two groups, the detailed study group was more likely to be treated in the outpatient setting and had a slightly higher 30-day survival rate (100% vs 99%, p = .046).
table 1.
Characteristics of Study Patients
Patient Reporting of Symptom Resolution
Fatigue (93%) and cough (90%) were the most commonly reported symptoms at the time of study enrollment (day 0, Table 2a). All symptoms showed a stepwise decline in reported prevalence with each subsequent follow-up, but there was still substantial symptom reporting at the day 90 follow-up. Fatigue was reported by 51% of patients at day 90, which was still nearly twice the frequency reported as prepneumonia (29%). Similarly, at the day 90 follow-up, cough (32%) and sputum (27%) were reported more than twice as often compared with their respective prepneumonia levels.
table 2a.
Proportion Reporting Symptoms During Resolution of Pneumonia

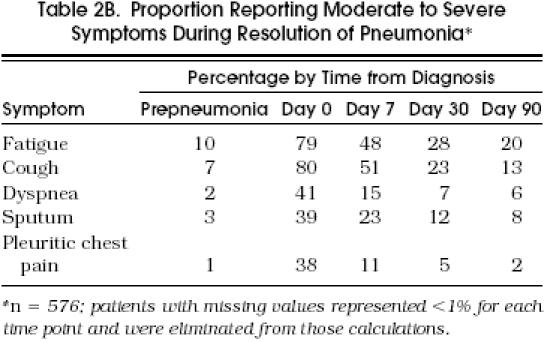
The majority of patients rated their symptoms of fatigue (79%) and cough (80%) as moderate to severe (i.e., at the two highest levels of the severity scale) at the time of diagnosis, while only a minority of patients rated their symptoms as moderate to severe at the day 30 or day 90 follow-ups (Table 2b). Still, 20% of patients reported moderate to severe fatigue and 13% reported moderate to severe cough at day 90, twice the levels reported as prepneumonia.
table 2b.
Proportion Reporting Moderate to Severe Symptoms During Resolution of Pneumonia
The pneumonia symptom score was calculated based on the sum of all five symptom severity scales. The internal reliability of the score, as measured with Cronbach’s α, ranged over the follow-up time points from 0.5 for the prepneumonia and day 0 scores to 0.7 for the day 30 and day 90 scores. As shown in Figure 1, the vast majority of patients recalled having few to no symptoms at a time before the onset of pneumonia, corresponding to the lowest level of the symptom score (score = 0–20). At the time of diagnosis, there was a wide distribution of symptom scores. At each successive follow-up assessment, a greater proportion of patients returned to the lowest level of symptom reporting. However, more than 25% of patients were still noted to have symptom scores above the lowest score level, based on both the day 30 and day 90 follow-up interviews. The mean symptom score (± SD) was 6.5 (± 10.1) before the onset of pneumonia, rose to 51.7 (± 20.1) at the time of diagnosis, and subsequently declined to 31.2 (± 18.0) at day 7, 19.4 (± 16.9) at day 30, and 13.6 (± 16.4) at day 90.

Figure 1 Distribution of pneumonia symptom scores over time. The proportion of patients within each range of scores is displayed at each interview time point. Missing scores represent less than 3% of all study patients at each time point and are eliminated from the analysis.
Patient Reporting of Health Status over Time
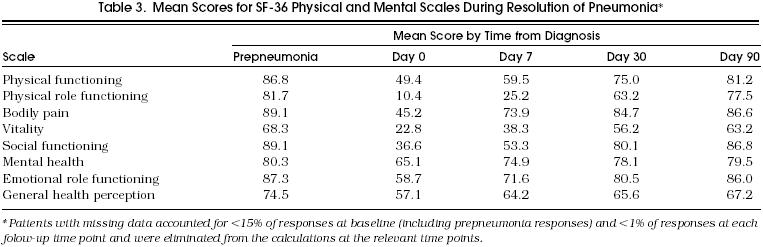
The calculated scores for the four physical and four mental health concepts derived from the SF-36 are presented in Table 3. For these measures, a higher score implies better health. All scales demonstrated maximum decline from the prepneumonia levels at day 0. The greatest decline was noted for the mean score for physical role functioning, which declined from 81.7 (prepneumonia) to 10.4 (day 0). The least decline was noted for the mean score for mental health, which declined from 80.3 (prepneumonia) to 65.1 (day 0). All scales improved in a stepwise fashion over the three follow-up time points, including from day 30 to day 90.
Table 3.
Mean Scores for SF-3 6 Physical and Mental Scales During Resolution of Pneumonia*
Comparison of the Sensitivity of Outcomes Scales
We calculated the amount of change between each successive follow-up period detected by each outcome scale and expressed these as both a raw change score and a standardized effect size (ES), defined as the mean change score divided by the standard deviation of the score at the initial time point (Table 4). For reference, an ES of 0.2 is considered small, 0.5 is considered moderate, and 0.8 or greater is considered large.20 Of note, the effect sizes for the pneumonia symptom score are negative, reflecting improvement with a decline in the scale, while the effect sizes for the SF-36 scales are positive, reflecting improvement with an increase in the scales. All scales showed a statistically significant amount of change over each follow-up time period (p < .05). When we adjusted for multiple comparisons, and required a p value < .001 for significance, all scale changes remained significant except for the change for days 7 to 30 in the SF-36 scale for general health perception and the changes for days 30 to 90 in the SF-36 scales for bodily pain, general health perception, and mental health.
Table 4.
Change Scores and Effect Sizes for SF-36 and Symptom Scales at Follow-up Time Points*
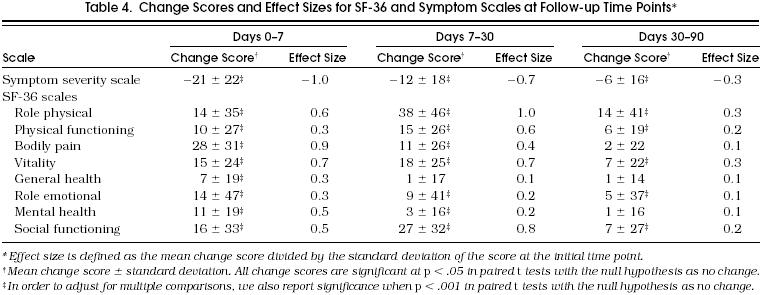
Over the first 7 days of recovery, the pneumonia symptom score showed the greatest amount of change (ES = −1.0), followed by the SF-36 scales for bodily pain (ES = 0.9) and vitality (ES = 0.7). From days 7 to 30, the absolute value for the ES for the symptom score declined (1.0 to 0.7), but the ES for several SF-36 scales increased (physical role function 0.6 to 1.0, physical functioning 0.3 to 0.6, and social functioning 0.5 to 0.8), implying greater change in these scales over the second period of follow-up compared with the first. Finally, although all scales demonstrated their smallest amount of change over the third follow-up period (days 30 to 90), the pneumonia symptom score and the vitality and role physical scales still showed a small improvement, with calculated absolute ES values of 0.3 for each.
Relation of Pneumonia Symptom Score to Pneumonia-Related Ambulatory Care Visits
We assessed the relation of persistent symptoms with increased use of health resources as a means of validating the pneumonia symptom score. At the day 30 follow-up, 337 patients (59%) reported at least one ambulatory care visit since the day 7 assessment; of these, 284 (84%) reported at least one pneumonia-related ambulatory visit. At the day 90 follow-up, 294 patients (55%) reported at least one ambulatory visit since the day 30 assessment; of these, 80 (27%) reported at least one pneumonia-related ambulatory visit.
Table 5 summarizes the proportion of patients with subsequent pneumonia-related ambulatory care visits for increasing levels of the pneumonia symptom score based on the day 0, day 7, or day 30 assessments. The association between symptom score and ambulatory visits was considered only for those visits that were reported after the time of symptom reporting, in order to validate the symptom as a predictive measure.
Table 5.
Association of Increased Pneumonia Symptom Scores with Subsequent Reporting of Pneumonia-Related Ambulatory Care Visits
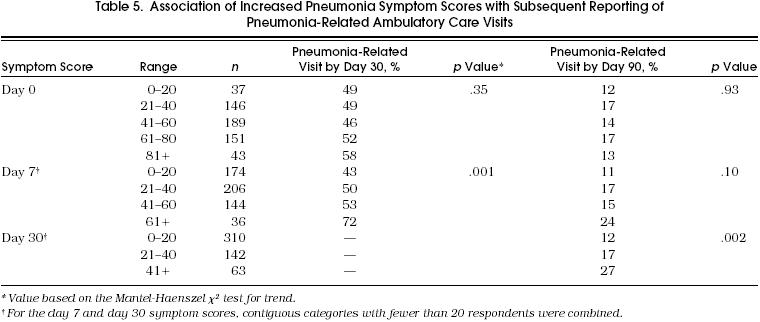
The pneumonia symptom score based on the day 0 interview was not associated with the probability of subsequent pneumonia-related ambulatory care visits by either day 30 or day 90. However, increased pneumonia symptom scores based on both the day 7 and day 30 assessments predicted an increased probability of a subsequent pneumonia-related ambulatory care visit. For example, 43% of patients with the lowest level of symptom score at day 7 subsequently reported a pneumonia-related ambulatory care visit by day 30 compared with 72% of the patients with the highest level of symptom scores. The association between symptom scores and ambulatory care visits remained significant in multivariate analyses that adjusted for patient age, site of care, comorbidities, and severity of illness (data not shown).
DISCUSSION
The majority of patients with pneumonia are treated in the outpatient setting and have a correspondingly low risk of short-term mortality or serious morbidity related to their illness. Increasingly, there is pressure to identify similar low-risk patients in the hospital setting and discharge them to home at the time of diagnosis or after a shortened length of stay. Whether these strategies will actually improve the quality of care for patients with pneumonia is unknown. However, we cannot study these strategies until we develop and test instruments that have sufficient accuracy and sensitivity to measure rates of recovery in these patients.
This study represents the first attempt to develop and validate an instrument to specifically measure symptomatic recovery in patients with pneumonia. This pneumonia symptom questionnaire can be completed by patients themselves or administered through an interview. Our findings suggest that this new measure is responsive to patients’ recovery from pneumonia over a prolonged time interval. In addition, the score was shown to have validity insofar as it predicted future pneumonia-related visits to physician offices.
The use of the pneumonia-specific symptom questionnaire demonstrated that a substantial fraction of patients with a low severity of pneumonia continued to report symptoms beyond 30 days from the time of their diagnosis. This pattern of delayed symptom resolution was mirrored by some, but not all, of the generic health scales provided by the SF-36. Furthermore, the pattern of change, as reflected by the ES for each scale over each follow-up time period, suggests that different scales may measure temporally distinct aspects of recovery in patients with pneumonia. For example, there was substantial improvement in the symptom score over the first 7 days of illness, while several of the physical health scales demonstrated a greater degree of improvement over the remaining first month of illness.
Published data on the expected rate of resolution of symptoms in patients with pneumonia are limited. In a recent meta-analysis of 122 published studies of outcomes in patients with pneumonia, only 2 studies included resolution of symptoms as an outcome.5 One of these studies considered symptom resolution only until the time of hospital discharge,21 while another followed a population of hospitalized adults with incomplete radiographic resolution of their pneumonia and found 63% of survivors were symptom-free at 6 months.22 One other study, by Lehtomaki, included otherwise healthy military recruits in Finland, with a mean age of 21 years. In this study, the mean time to resolution of cough ranged from as short as 4.6 days for patients with mycoplasmal pneumonia (n = 15) to as long as 7.9 days for patients with pneumococcal pneumonia (n = 19).23 This contrasts sharply with our finding that more than 50% of patients still reported cough at the day 30 follow-up interview. The restriction of the cohort to young, healthy patients and the limitation of follow-up to the time of hospital discharge probably explains the shorter time to cough resolution in the study by Lehtomaki.
Our study relied on a symptom questionnaire that has not been extensively validated, in part because of the absence of an accepted gold standard for determining recovery from pneumonia. This is particularly important for the many patients who continue to report symptoms beyond day 30 of their illness. It is possible that for some patients the failure to resolve symptoms beyond day 30 reflects the development of other illnesses rather than the persistent effect of the initial episode of pneumonia. However, patients with higher symptom severity scores at day 30 were more likely to seek physician care for pneumonia-related complaints, supporting the conclusion that some of the reported symptoms after day 30 are related to the episode of pneumonia.
The approach of validating the results from the pneumonia symptom score based on its ability to predict pneumonia-related physician visits was potentially affected by patient recall bias. The more symptomatic patients may have been more likely to report physician visits and ascribe them to their recent illness. Though the ultimate assignment of visits as pneumonia-related was based on an independent review of patient-reported reasons for visits, we have no independent data on the frequency of, and reasons for, visits to physicians during the follow-up time periods.
Some other limitations of this study should be noted. First, the follow-up questionnaires were both self-administered and administered by interview. We have not examined the impact of the mode of administration on the results of our study and are uncertain about the direction of such a possible effect. Given the potential influence that these two modes of administration could have on questionnaire responses, subsequent studies are required to establish the impact of the mode of administration on measured rates of recovery from pneumonia. Second, as presented in Table 1, the patients ultimately enrolled in this study were younger, more educated, and probably healthier than the remaining patients in the Pneumonia PORT cohort study who were also considered to be at low risk of short-term mortality, but were not enrolled in this study. As a result, we suspect that the resolution of symptoms would be even more delayed among these excluded patients and their symptom burden at 30 and 90 days would be correspondingly greater.
Third, this study relied on an estimation of patients’ baseline symptoms and functional status as judged by their responses to the questionnaires at the time of diagnosis. The bias inherent in this estimation might be in either direction; i.e., acutely ill patients might overestimate the presence of symptoms and functional limitations prior to the onset of illness, or they might underestimate these symptoms and limitations. Clearly, if the latter bias were dominant, then this study would be setting unrealistic standards for determining the full recovery of the study population and, therefore, measuring artificially prolonged recovery times. However, the fact that most patients returned to their reported baseline scores for some of the SF-36 scales, such as general health, bodily pain, and mental health, suggests that the ability of patients to establish prepneumonia baseline levels for some health measures may be valid.
Finally, an important determinant of the rate of recovery from pneumonia may be the underlying microbial etiology.23 Our study simply recorded microbial testing ordered by participating physicians. For most of these low-risk patients, such testing was infrequent. As a result the vast majority of patients did not have an etiologic agent identified. However, even if such data were available, the measurement of pathogen-specific recovery rates may have limited use for most physicians, who rarely have sufficient microbial data to help guide their management of individual outpatients with pneumonia.
The findings of this study may have important implications for the management of patients with pneumonia. Physicians should consider informing patients with pneumonia of the possibly prolonged time to full symptom resolution when discussing the expected rate of recovery from their illness. It is possible that if physicians better informed patients about the natural history of the illness, the rate of pneumonia-related ambulatory care visits might be decreased. In addition, we suggest that future studies of outcomes in low-risk patients with pneumonia include measures of symptom resolution and physical health status, and that these outcome data be collected at least 30 days from the time of diagnosis.
Acknowledgments
The authors thank Linda J. Hough, MPH, for her help with many aspects of this project, including coordination of the data collection, and suggestions on the design of this study. We thank D. Scott Obrosky, MS, for his technical support with statistical analyses. We also gratefully acknowledge the assistance of Elmer Holzinger, MD, for coordinating study activities at St. Francis Medical Center; Karen Lahive, MD, for coordinating study activities at the Harvard Community Health Plan; Terry Sefcik, MS, for data management; and the following clinical research assistants for cohort study patient enrollment and data collection: Mary Walsh, RN, and Donna Polenik, MPH, in Pittsburgh; Mary Ungaro, RN, Leila Borowsky, MPH, and Marian Hendershot, RN, in Boston; Rhonda Grandy, RN, Jackie Cunning, RN, Dawn Menon, GN, Linda Kraft, RN, and Maxine Young, RN, in Halifax.
References
- 1.Andrews BE. Community-acquired pneumonia in adults in British hospitals in 1982–1983: a survey of aetiology, mortality, prognostic factors and outcome. Q J Med. 1987;62:195–220. The British Thoracic Society and the Public Health Laboratory Service. [PubMed] [Google Scholar]
- 2.Marrie TJ, Durant H, Yates L. Community-acquired pneumonia requiring hospitalization: 5-year prospective study. Rev Infect Dis. 1989;11:586–99. doi: 10.1093/clinids/11.4.586. [DOI] [PubMed] [Google Scholar]
- 3.Fine MJ, Orloff JJ, Arisumi D, et al. Prognosis of patients hospitalized with community-acquired pneumonia. Am J Med. 1990;88:1N–8N. [PubMed] [Google Scholar]
- 4.Kapoor WN. Design of outcome studies of community-acquired pneumonia. Semin Respir Infect. 1994;9:214–9. [PubMed] [Google Scholar]
- 5.Fine MJ, Smith MA, Carson CA, et al. Prognosis and outcomes of patients with community-acquired pneumonia. JAMA. 1996;275:134–41. [PubMed] [Google Scholar]
- 6.Jay SJ, Johanson WG, Pierce AK. The radiographic resolution of Streptococcus pneumoniae pneumonia. N Engl J Med. 1975;293:798–801. doi: 10.1056/NEJM197510162931604. [DOI] [PubMed] [Google Scholar]
- 7.Marrie TJ. Normal resolution of community-acquired pneumonia. Semin Respir Infect. 1992;7:256–70. [PubMed] [Google Scholar]
- 8.Guyatt GH, Feeny DH, Patrick DL. Measuring health-related quality of life. Ann Intern Med. 1993;118:622–9. doi: 10.7326/0003-4819-118-8-199304150-00009. [DOI] [PubMed] [Google Scholar]
- 9.Rubenstein LA, Schairer C, Wieland GD, Kane R. Systematic biases in functional status assessment of elderly adults: effects of different data sources. J Gerontol. 1984;38:686–91. doi: 10.1093/geronj/39.6.686. [DOI] [PubMed] [Google Scholar]
- 10.Magaziner J, Simonsick E, Kashner M, Hebel JR. Patient-proxy response comparability on measures of patient health and functional status. J Clin Epidemiol. 1988;41:1065–74. doi: 10.1016/0895-4356(88)90076-5. [DOI] [PubMed] [Google Scholar]
- 11.Weinberger M, Samsa GP, Schmader K, Greenberg SM, Carr DB, Wildman DS. Comparing proxy and patients’ perceptions of patients’ functional status: results from an outpatient geriatric clinic. J Am Geriatr Soc. 1992;40:585–8. doi: 10.1111/j.1532-5415.1992.tb02107.x. [DOI] [PubMed] [Google Scholar]
- 12.Fine MJ, Hanusa BH, Lave JR, et al. Comparison of a disease-specific and generic severity of illness measure for patients with community acquired pneumonia. J Gen Intern Med. 1995;10:358–68. doi: 10.1007/BF02599830. [DOI] [PubMed] [Google Scholar]
- 13.Fine MJ, Smith DN, Singer DE. Hospitalization decision in patients with community-acquired pneumonia: a prospective cohort study. Am J Med. 1990;89:713–21. doi: 10.1016/0002-9343(90)90211-u. [DOI] [PubMed] [Google Scholar]
- 14.Anthonisen NR, Manfreda J, Warren PW, et al. Antibiotic therapy in exacerbations of chronic obstructive pulmonary disease. Ann Intern Med. 1987;106:196–204. doi: 10.7326/0003-4819-106-2-196. [DOI] [PubMed] [Google Scholar]
- 15.Belza BL. Comparison of self-reported fatigue in rheumatoid arthritis and controls. J Rheumatol. 1995;22:639–43. [PubMed] [Google Scholar]
- 16.Ware JE. Boston, Mass: The Health Institute; 1993. SF-36 Health Survey. Manual and Interpretation Guide. [Google Scholar]
- 17.Kendall M, Stuart A. New York, NY: Macmillan Publishing Co.; 1979. The Advanced Theory of Statistics; pp. 580–5. Vol. 2. [Google Scholar]
- 18.Mantel N, Haenszel W. Statistical aspects of the analysis of data from retrospective studies of disease. J Natl Cancer Inst. 1959;22:719–48. [PubMed] [Google Scholar]
- 19.Cronbach LJ. Coefficient alpha and the internal structure of tests. Psychometrika. 1951;16:297–334. [Google Scholar]
- 20.Kazis LE, Anderson JJ, Meenan RF. Effect sizes for interpreting changes in health status. Med Care. 1989;27(7):S178–89. doi: 10.1097/00005650-198903001-00015. [DOI] [PubMed] [Google Scholar]
- 21.Douglas RM, Devitt L. Pneumonia in New Guinea: bacteriological findings in 632 adults with particular reference to Haemophilus influenzae. Med J Aust. 1973;1:42–9. [PubMed] [Google Scholar]
- 22.Boyd DHA. Failure of resolution in pneumonia. Br J Dis Chest. 1975;69:259–66. doi: 10.1016/0007-0971(75)90094-7. [DOI] [PubMed] [Google Scholar]
- 23.Lehtomaki K. Clinical diagnosis of pneumococcal, adenoviral, mycoplasmal and mixed pneumonias in young men. Eur Respir J. 1988;1:324–9. [PubMed] [Google Scholar]