Abstract
OBJECTIVE
Determine patient and hospital-level variation in proportions of low-severity admissions.
DESIGN
Retrospective cohort study.
SETTING
Thirty hospitals in a large metropolitan region.
PATIENTS
A total of 43,209 consecutive eligible patients discharged in 1991 through 1993 with congestive heart failure (n = 25,213) or pneumonia (n = 17,996).
MEASUREMENTS AND MAIN RESULTS
Admission severity of illness was measured from validated multivariable models that estimated the risk of in-hospital death; models were based on clinical data abstracted from patients’ medical records. Admissions were categorized as “low severity” if the predicted risk of death was less than 1%. Nearly 15% of patients (n = 6,382) were categorized as low-severity admissions. Compared with other patients, low-severity admissions were more likely (p < .001) to be nonwhite and to have Medicaid or be uninsured. Low-severity admissions had shorter median length of stay (4 vs 7 days; p < .001), but accounted for 10% of the total number of hospital days. For congestive heart failure, proportions of low-severity admissions across hospitals ranged from 10% to 25%; 12 hospitals had rates that were significantly different (p < .01) than the overall rate of 17%. For pneumonia, proportions ranged from 3% to 22%; 12 hospitals had rates different from the overall rate of 12%. Variation across hospitals remained after adjusting for patient sociodemographic factors.
CONCLUSIONS
Rates of low-severity admissions for congestive heart failure and pneumonia varied across hospitals and were higher among nonwhite and poorly insured patients. Although the current study does not identify causes of this variability, possible explanations include differences in access to ambulatory services, decisions to admit patients for clinical indications unrelated to the risk of hospital mortality, and variability in admission practices of individual physicians and hospitals. The development of protocols for ambulatory management of low-severity patients and improvement of access to outpatient care would most likely decrease the utilization of more costly hospital services.
Keywords: quality of health care, outcome assessment, hospital mortality, severity of illness, health services research
Numerous studies over the last quarter century have demonstrated variation in health care delivery.1–10 The findings suggest that a substantial proportion of medical care is discretionary and of questionable value. Although previous analyses have found variation in rates of hospitalization across regions and delivery systems (e.g., managed care vs fee for service),11,12 few studies have examined whether the propensity to admit patients varies among individual hospitals or whether the propensity to be admitted varies among different sociodemographic groups.
We conducted the current study to evaluate variations in the severity of illness of patients admitted to hospitals in a single large metropolitan area. We studied two prevalent conditions—congestive heart failure and pneumonia—that are often managed on an ambulatory basis. Although we were unable to measure directly the appropriateness of each hospitalization, we were able to quantify each patient’s risk of hospital death using clinical data from patients’ medical records. This allowed us to identify patients for whom the likelihood of death was small and for whom the benefit of being hospitalized may be negligible.13,14 Our primary objectives were to determine whether the proportions of patients with low severity of illness varied across hospitals and according to patient sociodemographic factors.
METHODS
The study was conducted in 30 hospitals in northeast Ohio. All hospitals were participants in Cleveland Health Quality Choice, a regional initiative implemented in 1989 to compare hospital performance.15 Mean bed size of the 30 hospitals was 319 (range 81–936). Five hospitals were members of the Council of Teaching Hospitals of the Association of American Medical Colleges and were classified as major teaching hospitals.
Patients
The sample included 43,209 consecutive eligible patients discharged during a 29-month period (January–May 1991, July–December 1991, July 1992–December 1993) with congestive heart failure or pneumonia. (One month in 1991 and 6 months in 1992 are excluded because chart data were not available.) Patients were identified by specific ICD-9-CM principal diagnosis codes for congestive heart failure (398.91, 402.01, 402.11, 402.91, 404.01, 404.03, 404.11, 404.13, 404.91, 404.93, 428) and pneumonia (480–483, 485, 486, 487, 507). Patients were ineligible if they were less than 18 years of age or were admitted as transfers from other acute care hospitals.
Data
Data were abstracted from patients’ hospital records on standard forms and included sociodemographics, admission source (e.g., home, nursing home), comorbid conditions, admission medications, results of diagnostic testing (laboratory, radiology, electrocardiography, and echocardiography), treatment limitations (e.g., “do-not-resuscitate” orders), length of stay, discharge vital status, discharge destination, and ICD-9-CM diagnosis and procedure codes. Several steps were established to ensure data reliability, including explicit written protocols for abstraction of each variable, electronic editing of data with resubmission by hospitals of variables with missing or out-of-range values, and independent auditing of randomly selected discharges from each hospital.15,16
Admission Severity of Illness
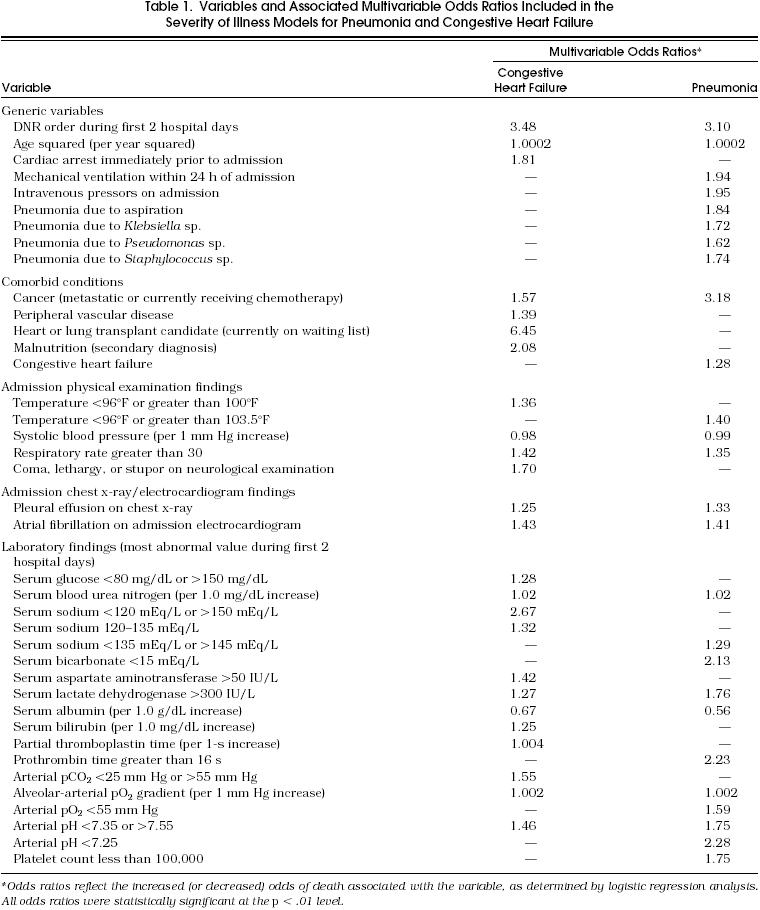
Severity of illness for each diagnosis was measured using validated multivariable models that included sociodemographic and clinical findings independently (p < .01) related to in-hospital mortality (Table 1).15 Discrimination of the severity models was comparable to other methods,17 as measured by receiver operating characteristic curve areas18 of 0.85 for the congestive heart failure model and 0.88 for the pneumonia model.
Table 1.
Variables and Associated Multivariable Odds Ratios Included in the Severity of Illness Models for Pneumonia and Congestive Heart Failure

Analysis
For each patient in the analysis, the severity models were used to estimate a predicted risk of in-hospital death (0 to 100%). Patients in whom the predicted risk of death was less than 1% were categorized as low-severity admissions. Differences between low-severity admissions and other patients were examined using the χ2 test, with the modification for linear trend where appropriate, or the Wilcoxon Signed-Rank Test. For each diagnosis, rates of low-severity admissions in individual hospitals were compared with the rate in all patients using a one-sample test of proportions and a criterion for significance of p < .01. To adjust for sociodemographic differences in the types of patients seen at each hospital, additional analyses compared actual rates of low-severity admissions in each hospital to rates that were predicted on the basis of sociodemographic factors. Predicted rates of low-severity admissions were determined from patient-level logistic regression equations in which the dependent variable was classification as a low-severity admission and the independent variables included age, gender, race, and health insurance. Finally, differences in rates of low-severity admissions in major teaching hospitals and other hospitals were compared using the χ2 statistic.
RESULTS
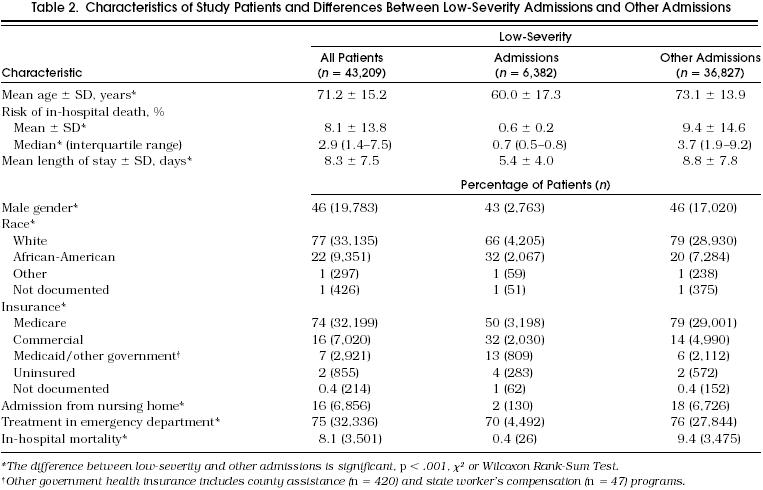
Sociodemographic and clinical characteristics of study patients are shown in Table 2. The mean predicted risk of death among all patients was 8.1% and was higher among patients with pneumonia than patients with congestive heart failure (10.5% vs 6.4%, respectively; p < .001). Nearly 15% of patients were categorized as low-severity admissions (i.e., less than a 1% risk of in-hospital death), including 12% (n = 2,086) of pneumonia patients and 17% (n = 4,296) of congestive heart failure patients. Among low-severity admissions, the mean predicted risk of death was 0.6%, which was similar (p > .5) to the actual in-hospital death rate of 0.4%. Of the 26 low-severity admissions who died, only 8 (i.e., 0.1% of all low-severity admissions) died during the first 4 days of hospitalization. Compared with other patients, low-severity admissions were younger and were less likely to be male, admitted through the emergency department, and residents of nursing homes (Table 2). Low-severity admissions were also more likely than other patients to be nonwhite (33.3% vs 20.4%, respectively, p < .001) and were more likely to have Medicaid or to be uninsured (17.1% vs 7.3%, respectively, p < .001). Although low-severity admissions had a shorter median length of stay (4 vs 7 days; p < .001), they nonetheless accounted for nearly 10% of the total number of hospital days of study patients. In addition, 22% (n = 1,680) of low-severity admissions had lengths of stay of 7 days or longer and only 32% (n = 2,016) were discharged before the fourth hospital day.
Table 2.
Characteristics of Study Patients and Differences Between Low-Severity Admissions and Other Admissions

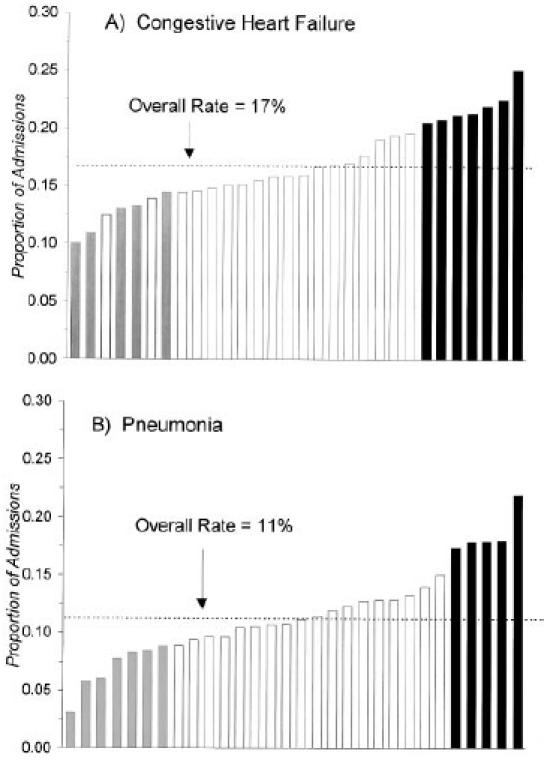
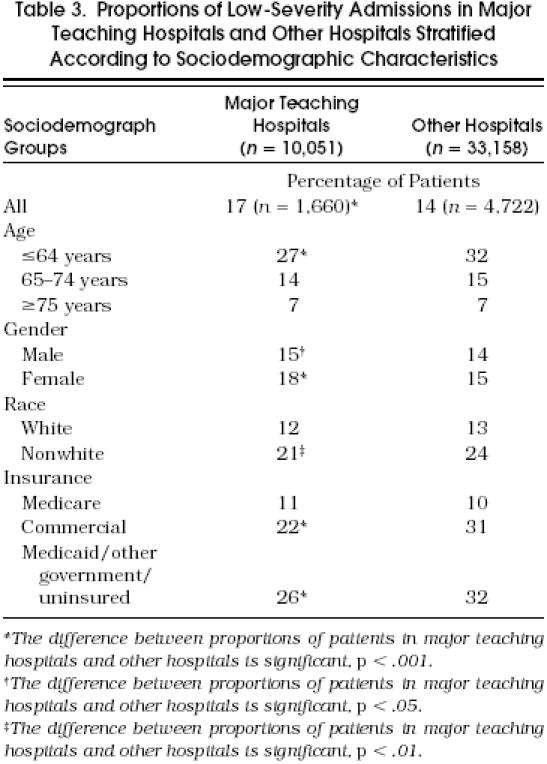
Proportions of low-severity admissions did not vary across the 3 years during which data were collected (14.4%, 15.2%, and 14.9% in 1991, 1992, and 1993, respectively; p = .14). However, proportions did vary across the 30 hospitals (Fig 1A and Fig1BFor congestive heart failure, proportions of low-severity admissions ranged from 10% to 25%; in 12 hospitals proportions were significantly (p < .01) higher or lower than the overall population rate of 17%. For pneumonia, proportions ranged from 3% to 22% in 12 hospitals proportions were higher or lower than the overall population rate of 12%. Proportions of low-severity admissions for the two diagnoses were moderately correlated across hospitals (Pearson correlation coefficient = .41; p = .03) suggesting that the propensity to admit low-severity patients was in part a characteristic specific to the hospital (or physician). Substantial variability across hospitals remained after adjusting for sociodemographic differences. For congestive heart failure, six hospitals had actual rates that were higher (p <. 01) than predicted on the basis of sociodemographic factors while four hospitals had rates that were lower (p < .01) than predicted. For pneumonia four hospitals had actual rates that were higher than predicted, and four hospitals had rates that were lower than predicted. These results were generally similar if different criteria for determining low severity were applied. For example, if patients were classified as low severity if their predicted risk of death was less than 0.5%, hospital variation in low-severity admissions was more than 10-fold for pneumonia (0.3–4.5%) and nearly 4-fold for congestive heart failure (2.0–7.8%). Finally the proportion of low-severity admissions was higher in major teaching hospitals than other hospitals (17% vs 14%; p < .001). This finding however was confounded by differences in sociodemographic characteristics among patients admitted to different hospitals. In stratified analyses according to age, race and health insurance, proportions of low-severity admissions in major teaching hospitals were lower or similar in specific subgroups (Table 3
FIGURE 1.

Proportions of low-severity admissions(i.e., predicted risk of death <1%)in individual hospitals for congestive heart failure (A) and pneumonia (B). Hospitals with rates significantly (p < .01) lower or higher than the overall sample rate are indicated by the gray and black bars, respectively
3.
Proportions of Low-Severity Admissions in Major Teaching Hospitals and Other Hospitals Stratified According to Sociodemographic Characteristics

DISCUSSION
The cost of hospital care remains a major component of health care expenditures, despite efforts to shift care to ambulatory settings.19 In our analysis of consecutive admissions of patients with congestive heart failure and pneumonia in a large metropolitan area, we found that roughly one in seven patients had a very low likelihood of death. Such patients accounted for nearly 10% of total bed days for the two conditions. We found differences in low-severity admissions according to sociodemographic characteristics. Low-severity admissions were roughly 60% more likely to be African-American and more than twice as likely to have Medicaid or to be poorly insured. These differences parallel our recently reported finding that hospitalized African-American patients on average are admitted with lower severity of illness than white patients.16
We also found striking interhospital variation in the frequencies of low-severity admissions, with a roughly 7-fold variation in those for pneumonia and a 2.5-fold variation in those for congestive heart failure. Results were generally similar after adjusting for sociodemographic differences or if different criteria for low severity were applied. In addition, within each hospital, proportions of low-severity pneumonia and congestive heart failure admissions were moderately correlated. In contrast, variation according to teaching status was less marked and was confounded by sociodemographic differences. Taken together, these findings indicate that thresholds for admission vary across hospitals (or physicians) and are, in part, an institution-specific characteristic.
Although the current study cannot identify causes of the variation in low-severity admissions, efforts to understand this variation may lead to improved efficiency of care and lower hospitalization rates. We suggest three potential hypotheses that should be investigated in future studies. First, differences in the rates of low-severity admissions may have been driven by the desire to improve outcomes other than mortality. Even if hospitalization will not reduce the immediate likelihood of death, it may be viewed in some cases as an opportunity to improve longer-term survival or outcomes not related to mortality but important to quality of life (e.g., physical function). Thus, variation in the risk of adverse outcomes other than mortality may explain some of the interhospital variation we observed. If so, then improving the capability of health care systems to address these needs in more cost-effective settings (e.g., intermediate care, patients’ homes) may decrease need for low-severity admissions.
Second, variation in low-severity admissions may reflect differences in access to outpatient care. Providers at hospitals that care for patients with poor access to outpatient services may be more likely to hospitalize low-severity patients because of concerns that patients will be unable to obtain adequate outpatient follow-up or monitoring. Although we have no direct measures of access to primary care, the higher rates of low-severity admissions we found for two patient groups (African-Americans and Medicaid patients) that are less likely to have adequate access to primary care20–22 supports this hypothesis.
Finally, decisions to admit patients with low severity of illness may be subject to physician discretion and in some cases may represent inappropriate use of hospital resources. Although we did not measure the appropriateness of each hospitalization,23,24 it is likely that many of these patients could have been managed safely without hospitalization. This possibility is supported by the very low in-hospital mortality rates for such patients, particularly during the first 4 days of hospitalization.
To our knowledge, no previous studies have directly examined low-severity hospital admissions. However, our findings appear consistent with several earlier studies that found that a substantial proportion of hospital admissions are for inappropriate indications, when appropriateness is defined on the basis of clinical severity.24–30 For example, in the RAND Health Insurance Study, Sui et al. found that 23% of medical and surgical admissions occurring from 1974 to 1982 were inappropriate and that rates of inappropriate admissions varied from 10% to 35% across the six regions studied.25 Other studies conducted prior or proximate to the introduction of prospective payment based on diagnosis-related groups found rates of inappropriate hospitalizations that ranged from 6% to 19%,24 while several studies in pediatric populations have found rates of inappropriate admissions or hospital days ranging between 20% and 30%.26–30 Our findings also appear consistent with small area analyses that have noted higher rates of hospitalization for certain medical diagnosis groups in lower socioeconomic areas,31 although rates of inappropriate hospitalization may not be higher in regions with higher hospital utilization.32
In interpreting our findings, several potential methodologic limitations should be considered. First, because our analysis excluded patients with pneumonia and congestive heart failure who were managed on an ambulatory basis, variations in low-severity admissions across hospitals may, in part, reflect differences in severity of patients presenting for evaluation.33 However, to minimize potential bias due to patient selection and referral, we studied two conditions that are common in nearly all hospitals and specifically excluded patients transferred from other acute care facilities. Second, we identified low-severity admissions using quantitative clinical models that demonstrated excellent statistical discrimination and calibration, but did not examine other indications for hospitalization (e.g., failure to thrive, inability to provide self-care). However, the severity models did include potential proxy measures of such indications (e.g., age, admission from a nursing home, do-not-resuscitate status). Third, our models for measuring severity of illness were developed and validated in patients actually admitted to hospitals. It is possible that observed and predicted mortality rates would have been higher if patients were not admitted. Finally, health insurance information was limited. Although we observed variations across broad categories of payers, we were not able to examine potentially important effects of managed care and capitation on hospital admission practices.11,12
The results, albeit preliminary, have implications for the quality and efficiency of hospital care. The variation across hospitals in proportions of low-severity admissions is similar in magnitude to small-area and large-area variations that have been described for common surgical procedures,1,3,9,31,34 suggesting that low-severity admissions are, in large measure, discretionary. Because the benefits of hospitalization in patients with low-severity illness are uncertain,13,14 efforts to decrease variability (e.g., explicit guidelines for hospital admission, decision aids to identify low-severity patients, improvements in access to ambulatory services and home health care) would be expected to improve the cost-effectiveness of care. Moreover, further study of factors responsible for variations in these admissions may suggest mechanisms for more efficient management strategies in such patients. Such factors are likely to be specific to both the patient and the provider. Finally, improving our understanding of nonclinical factors leading to admission, particularly barriers to primary care in disadvantaged patients, is likely to have important implications for the development of novel strategies for providing care in less costly ambulatory or home settings.
In conclusion, our findings demonstrate marked variability in admission rates for low-severity admissions. Given the increasing proportion of U.S. health care financed through capitated arrangements,35 hospitals and health plans have new incentives to implement protocols that decrease variation in hospital admission practices by identifying patients unlikely to benefit from hospitalization. Understanding the causes of this variation would facilitate these efforts.
JGIM’s E-mail Address
For Letters to the Editor or for information about submitting manuscripts to JGIM: Walklett@mail.med.upenn.edu
Acknowledgements
The authors thank C. Seth Landefeld, MD, and Susan Payne, PhD, for their thoughtful comments and suggestions.
References
- 1.Wennberg J, Gittelsohn A. Small area variations in health care delivery. Science. 1973;182:1102–8. doi: 10.1126/science.182.4117.1102. [DOI] [PubMed] [Google Scholar]
- 2.Wennberg JE, Freeman JL, Culp WJ. Are hospital services rationed in New Haven or over-utilized in Boston? Lancet. 1987;1:1185–9. doi: 10.1016/s0140-6736(87)92152-0. [DOI] [PubMed] [Google Scholar]
- 3.Roos NP, Roos LL. High and low surgical rates: risk factors for area residents. Am J Public Health. 1985;75:263–9. doi: 10.2105/ajph.71.6.591. [DOI] [PMC free article] [PubMed] [Google Scholar]
- 4.Welch WP, Miller ME, Welch HG, et al. Geographic variation in expenditures for physicians’ services in the United States. N Engl J Med. 1993;328:621–7. doi: 10.1056/NEJM199303043280906. [DOI] [PubMed] [Google Scholar]
- 5.Greenfield S, Nelson EC, Aubkoff M, et al. Variations in resource utilization among medical specialties and systems of care: results from the Medical Outcomes Study. JAMA. 1992;267:1624–30. [PubMed] [Google Scholar]
- 6.Whittle J, Conigliaro J, Good CB, Lofgren RP. Racial differences in the use of invasive cardiovascular procedures in the Department of Veterans medical system. N Engl J Med. 1993;329:621–7. doi: 10.1056/NEJM199308263290907. [DOI] [PubMed] [Google Scholar]
- 7.Ayanian JZ, Epstein AM. Differences in the use of procedures between women and men hospitalized for coronary heart disease. N Engl J Med. 1991;325:221–5. doi: 10.1056/NEJM199107253250401. [DOI] [PubMed] [Google Scholar]
- 8.Chassin MR, Kosecoff J, Park RE, et al. Does inappropriate use explain geographic variations in the use of health care services? A study of three procedures. JAMA. 1987;258:2633–7. [PubMed] [Google Scholar]
- 9.Chassin MR, Brook RH, Park RE, et al. Variations in the use of medical and surgical services by the Medicare population. N Engl J Med. 1986;314:285–90. doi: 10.1056/NEJM198601303140505. [DOI] [PubMed] [Google Scholar]
- 10.Goldberg KC, Hartz AJ, Jacobsen SJ, Krakauer H, Rimm AA. Racial and community factors influencing coronary artery bypass surgery rates for all 1986 Medicare patients. JAMA. 1992;267:1473–7. [PubMed] [Google Scholar]
- 11.Robinson JC, Gardner LB, Luft HS. Health plan switching in anticipation of increased medical care utilization. Med Care. 1993;31:43–51. doi: 10.1097/00005650-199301000-00003. [DOI] [PubMed] [Google Scholar]
- 12.Manning WG, Leibowitz A, Goldberg GA, Rogers WH, Newhouse JP. Santa Monica, Calif.: RAND; 1987. A Controlled Trial of the Effect of a Prepaid Group Practice on the Utilization of Medical Services. [Google Scholar]
- 13.Stone RA, Obrosky DS, Singer DE, Kapoor WN, Fine MJ, Pneumonia Patient Outcomes Research Team (PORT) Investigators Propensity score adjustment for pretreatment differences between hospitalized and ambulatory patients with community-acquired pneumonia. Med Care. 1995:AS56–66. [PubMed] [Google Scholar]
- 14. Heart Failure: Evaluation and Care of Patients with Left Ventricular Dysfunction. Clinical Practice Guideline Number 11. Washington, DC: US Department of Health and Human Services, Public Health Service, Agency for Health Care Policy and Research; 1994.
- 15.Rosenthal GE, Harper DL. Cleveland Health Quality Choice: a model for community-based outcomes assessment. Jt Comm J Qual Improv. 1994;20:425–44. doi: 10.1016/s1070-3241(16)30088-8. [DOI] [PubMed] [Google Scholar]
- 16.Gordon HS, Harper DL, Rosenthal GE. Racial variation in predicted and observed in-hospital death: a regional analysis. JAMA. 1996;276:1639–44. [PubMed] [Google Scholar]
- 17.Steen PM, Brewster AC, Bradbury RC, Estabrook E, Young JA. Predicted probabilities of hospital death as a measure of admission severity of illness. Inquiry. 1993;30:128–41. [PubMed] [Google Scholar]
- 18.Hanley JA, McNeil BJ. The meaning and use of the area under a receiver operating characteristic (ROC) curve. Radiology. 1982;143:29–36. doi: 10.1148/radiology.143.1.7063747. [DOI] [PubMed] [Google Scholar]
- 19.Washington, DC: Prospective Payment Assessment Commission; 1993. Medicare and the American Health Care System: Report to the Congress, June 1993. [Google Scholar]
- 20.Blendon RJ, Aiken LH, Freeman HE, Corey CR. Access to medical care for black and white Americans: a matter of continuing concern. JAMA. 1989;261:278–81. [PubMed] [Google Scholar]
- 21.Kasike BL, Neylan JF, Riggio RR, et al. The effect of race on access and outcome in transplantation. N Engl J Med. 1989;329:621–7. doi: 10.1056/NEJM199101313240505. [DOI] [PubMed] [Google Scholar]
- 22.Wenneker MB, Weissman JS, Epstein AM. The association of payer with utilization of cardiac procedures in Massachusetts. JAMA. 1990;264:1255–60. [PubMed] [Google Scholar]
- 23.Inglis AL, Coast J, Gray S, Peters TJ, Frankel SJ. Appropriateness of hospital utilization: the reliability and validity of the Intensity-Severity-Discharge Review System in a United Kingdom acute hospital setting. Med Care. 1995;33:952–7. [PubMed] [Google Scholar]
- 24.Payne SMC. Identifying and managing inappropriate hospital utilization. Health Serv Res. 1987;22:709–69. [PMC free article] [PubMed] [Google Scholar]
- 25.Sui AL, Sonnenberg FA, Manning WG, et al. Inappropriate use of hospitals in a randomized trial of health insurance plans. N Engl J Med. 1986;315:1259–66. doi: 10.1056/NEJM198611133152005. [DOI] [PubMed] [Google Scholar]
- 26.Kemper KJ. Medically inappropriate hospital use in a pediatric population. N Engl J Med. 1988;318:1033–7. doi: 10.1056/NEJM198804213181605. [DOI] [PubMed] [Google Scholar]
- 27.Soulen JL, Duggan AK, DeAngellis CD. Identification of potentially avoidable pediatric hospital use: admitting physician judgment as a complement to utilization review. Pediatrics. 1994;94:421–4. [PubMed] [Google Scholar]
- 28.Gloor JE, Kissoon N, Joubert GI. Appropriateness of hospitalization in a Canadian pediatric hospital. Pediatrics. 1993;91:70–4. [PubMed] [Google Scholar]
- 29.Smith HE, Sheps S, Matheson DS. Assessing the utilization of in-patient facilities in a Canadian pediatric hospital. Pediatrics. 1993;92:587–93. [PubMed] [Google Scholar]
- 30.Havens PL, Butler JC, Day SE, Mohr BA, Davis JP, Chusid MJ. Treating measles: the appropriateness of admission to a Wisconsin children’s hospital. Am J Public Health. 1993;83:379–84. doi: 10.2105/ajph.83.3.379. [DOI] [PMC free article] [PubMed] [Google Scholar]
- 31.Gittelsohn A, Powe NR. Small area variations in health care delivery in Maryland. Health Serv Res. 1995;30:295–317. [PMC free article] [PubMed] [Google Scholar]
- 32.Restuccia J, Schwartz M, Ash A, Payne S. High hospital admission rates and inappropriate care. Health Affairs. 1996;15(7):156–63. doi: 10.1377/hlthaff.15.4.156. [DOI] [PubMed] [Google Scholar]
- 33.Miller MG, Miller LS, Fireman B, Black SB. Variation in practice for discretionary admissions: impact on estimates of quality of hospital care. JAMA. 1994;271:1493–8. [PubMed] [Google Scholar]
- 34.McKenzie L, Stephenson PA. Variation in cesarean section rates among hospitals in Washington state. Am J Public Health. 1993;83:1109–12. doi: 10.2105/ajph.83.8.1109. [DOI] [PMC free article] [PubMed] [Google Scholar]
- 35.Robinson JC, Casalino LP. The growth of medical groups paid through capitation in California. N Engl J Med. 1995;333:1684–7. doi: 10.1056/NEJM199512213332506. [DOI] [PubMed] [Google Scholar]


