SYNOPSIS
Objectives
We examined self-reported health characteristics, health care utilization, activity patterns, and demographic characteristics of U.S. adults 20 years and over by body mass index (BMI) category. We hypothesized that overweight and obese adults would report fair/poor health more often, report more health provider visits annually, experience more joint pain, report greater limitations in their daily activities, and report more hours of sedentary leisure-time activity than normal-weight adults.
Methods
Self-reported health characteristics of U.S. adults from the National Health and Nutrition Examination Survey (NHANES) 1999–2002 were examined for three BMI categories: normal weight (BMI 18.5–24.9), overweight (BMI 25.0–29.9), and obese (BMI ≥30.0). Covariates included gender, race/ethnicity, cigarette smoking, and educational attainment. We examined BMI group differences using descriptive and regression methods.
Results
Compared to normal-weight individuals, overweight individuals reported fair/poor health more often, more limitations in daily activities, and more health provider contacts. Overweight and obese subjects reported more hours of television watching and video game use compared to normal-weight subjects.
Conclusion
Our findings are useful to describe the health characteristics of U.S. adults and may be used to anticipate future demand for health services and to support intervention programs that help individuals achieve desirable weight status.
National health examination surveys conducted by the National Center for Health Statistics (NCHS) have documented the rising prevalences of overweight and obesity among U.S. adults.1 The National Health and Nutrition Examination Survey (NHANES) 1999–2002 age-adjusted prevalence estimates for overweight and obesity among U.S. adults 20 years of age and over were 64.5% for overweight or obese and 30.5% for obesity.1 Higher prevalences of overweight and obesity occurred among males, females, and oversampled race/ethnicity groups during NHANES 1999–2002 compared to NHANES III, 1988–1994. Overweight and obesity constitute a major public health problem, with enormous financial and economic consequences.2,3
The economic impacts of overweight include reduced worker productivity,4 higher rates of work absenteeism,4,5 and higher health care utilization and expenditures.6–8 In 1998, aggregate overweight- and obesity-attributable spending accounted for an estimated $78.5 billion or approximately 9.1% of total U.S. health care expenditures; today this figure is closer to $90 billion.6 Health expenditures associated with overweight and obesity vary according to race/ethnicity and age with the strongest relationship between health care costs and higher BMI occurring among non-Hispanic whites and older adults.9 From a public health perspective, obesity is also a major contributor to mortality among U.S. adults. Obesity contributes to lower life expectancy, particularly among younger adults aged 20–30 years compared to adults over 60 years of age.10
The adverse health outcomes associated with overweight and obesity include increased risk of cardiovascular disease, type 2 diabetes, sleep apnea, gallbladder disease, and some types of cancer.11,12 Previous research examined the associations between overweight and obesity and health-related quality of life (HRQOL), a measure of the impact of illness and treatment on functional status, mental health, and general well-being.13–17 Data from the 2000 Behavioral Risk Factor Surveillance System (BRFSS) for adults 18 years and over showed that obesity, but not overweight, was associated with lower HRQOL scores, more activity limitations, and unhealthy days for physical and mental health.15 Results from a large community-based study of treatment-seeking and non-seeking overweight/obese adults 19–90 years reported greater impairment with increasing BMI.14 Although information about pain was not collected in the study, the authors hypothesized that pain conditions influenced the degree of impairment as reported elsewhere.18 The NHANES provides a rich data source to examine conditions related to overweight and obesity. The survey collects population-based, cross-sectional data on measured and self-reported health characteristics of the general population and major subgroups such as non-Hispanic blacks and Mexican Americans as well as extensive information on comorbid conditions and pain.
Our analysis examined self-reported health and lifestyle characteristics of U.S. adults by BMI category. We hypothesized that overweight and obese adults have a higher prevalence of fair/poor health, utilize health care services more often, experience more joint pain, and report greater limitations in their daily activities than normal-weight adults. We hypothesized that sedentary lifestyle is associated with overweight and obesity and that differences in sedentary behavior among the BMI groups would be observed.
METHODS
Study design
The NHANES is conducted to assess the health and nutritional status of the civilian, noninstitutionalized U.S. population.19 Prior to 1999, the NHANES was conducted periodically; the survey became a continuous program in 1999. Nationally representative samples are selected annually using a complex, stratified, multistage probability cluster sampling design; public data files are released biannually.20 Non-Hispanic blacks, Mexican Americans, adolescents 12–19 years of age, adults 60 years of age and over, pregnant women, and people with low incomes were oversampled to obtain more reliable statistical estimates.
Detailed descriptions of the sample design, data collection methods, and protocols are posted on the NHANES website.20 Standardized household interview and health examination methods were used to collect all data. The NCHS Ethics Review Board approved the survey protocols and informed consent was obtained from all subjects.
Subjects
The data used in this study were collected between 1999 and 2002. A total of 10,291 subjects 20 years and over completed the household interview component; of these, 9,471 (92%) were examined in the NHANES mobile examination centers. Pregnant women (n=582), subjects who did not have measured body mass index (BMI) data (n=384), and subjects defined as underweight using a BMI criterion of <18.5 kg/m2 (n=144) were excluded from the analysis. The final analytic sample consisted of 8,361 subjects.
Variables
Self-reported health status and use of health care services were also obtained from the household interview. Subjects were asked about their overall health during the past 12 months. The response choices “excellent” and “very good” were combined, as were the responses given as “fair” or “poor.” Health care utilization was defined as the number of times the subject had seen a doctor or other health care professional in the past 12 months. We recoded the “no visit” and “1 visit” response categories in the original question as 1 or fewer visits and 10–12 and 13 or more visits as 10 or more times, based on preliminary analyses showing insignificant differences in the categories and the desire to have sufficient sample sizes in each group.
Sedentary behavior was assessed using self-reported interview information. Subjects estimated the number of hours per day spent watching television and the number of hours of computer and computer game use (outside of work) during the past 30 days. The combined total hours spent in these activities were recoded in two categories: 0–2 hours or 3 or more hours per day.
A categorical variable for limitation in daily activities was derived from responses to two questions. The first question asked whether any physical, mental, or emotional problem(s) kept the subject from working at a job or business, and the second question asked whether the subject was limited in any way because of a physical, mental, or emotional problem. A subject who answered affirmatively to either or both questions was classified as having a limitation in their daily activities. A subject who answered both questions negatively was considered not to have a limitation. The survey questionnaire includes a series of questions on joint pain, aching, and stiffness, and separate questions on low back pain. The percentages of individuals with joint pain, aching, or stiffness (any type), and with low back pain were compared by BMI group. Self-reported breathing problems associated with walking at an ordinary pace and while walking on an incline were assessed. Percentages of persons reporting shortness of breath for both scenarios were compared by BMI group.
Statistical analysis
SAS computer software24 was used for data management and SUDAAN25 was used for the statistical analyses. All estimates were weighted using the examination sample weights, which account for unequal probabilities of selection, person-level non-response, and a post-stratification adjustment to the estimated U.S. population. Standard errors were calculated using SUDAAN by the Taylor series linearization method.25,26 A survey design-consistent chi-square method was used for testing hypothesis of no association between the categorical variables and BMI groups and p-values for the chi-squares were examined to determine statistical significance. Crude and adjusted odds ratios were used to examine the relationship between health outcomes and BMI category. Logistic regression was used to compute the adjusted odds ratio; a generalized multinomial logit model was used for dependent variables with more than two outcomes. The logistic models controlled for age, gender, race-ethnicity, education level, and cigarette smoking. A p-value of <0.05 was used to define statistical significance.
RESULTS
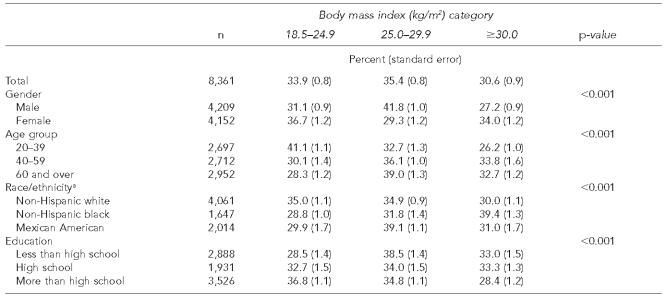
Sample sizes and weighted sample characteristics are shown in Table 1. Chi-square analyses revealed that higher percentages of males were overweight compared to females (41.8% vs. 29.3%; p<0.001). Overall, significantly higher percentages of female subjects were obese compared to male subjects (34.0% vs. 27.2%; p<0.001). The prevalence of overweight increased with age; differences were observed in the prevalence of overweight between subjects 20–29 years and those 60 years and over (32.7% vs. 30.0%; p<0.001). The percentage of obese adults increased between ages 20–39 years and 40–59 years; 20–39 year olds differed from the other two age groups (p<0.001). Overall, Mexican Americans had the highest percentage of overweight subjects (39.1%) while non-Hispanic blacks had the highest prevalence of obesity (39.4%).
Table 1.
Demographic characteristics by body mass index category for U.S. adults 20 years and over, NHANES 1999–2002
Other races excluded
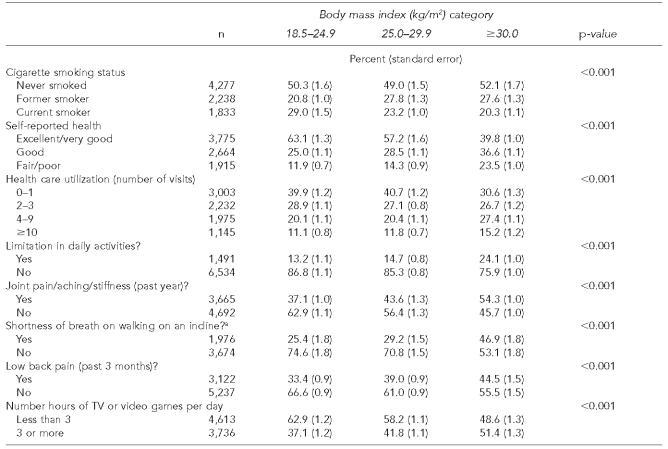
Chi-square analysis demonstrated statistically significant differences in all self-reported health, lifestyle characteristics, health symptoms, and health care utilization among the BMI categories (Table 2). For example, in the normal-weight group, 63.1% reported excellent/very good health compared to 39.8% of obese subjects (p<0.001). Cigarette smoking was more prevalent in the normal-weight group (29%) compared to the overweight (23.2%) and obese (20.3%) groups (p<0.001). Approximately 54% of obese subjects reported joint pain and stiffness symptoms as compared to 37% in the normal-weight group. Low back pain was reported by 44.5% of obese subjects compared to 33.4% of normal-weight subjects. Responses to a general question about limitations in daily activities revealed that approximately 24% of obese subjects experienced limitations in the daily activities compared to 13.2% of normal-weight and 14.7% of overweight subjects.
Table 2.
Self-reported health characteristics by body mass index category, U.S. adults 20 years and over, NHANES 1999–2002
Subjects 40 years and over
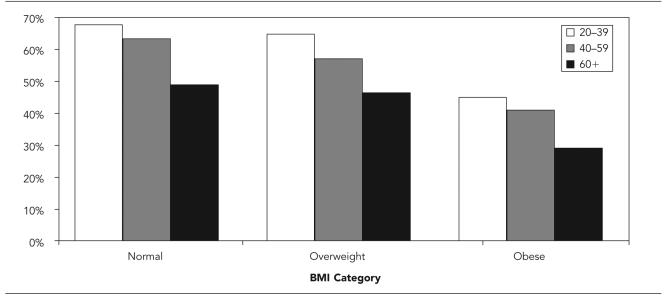
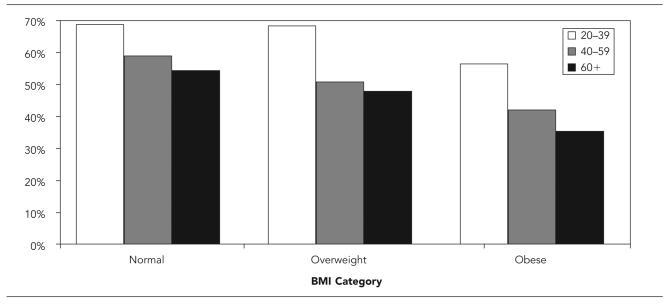
Age-stratified results on general health status and joint pain, aching, and swelling showed the prevalence of excellent/very good health decreased with increased age and BMI (Figure 1). Obese subjects consistently reported overall excellent or very good health less often than their normal- or overweight counterparts. Joint pain symptoms were also associated with age and BMI (Figure 2). Within age groups, lower percentages of obese subjects were symptom-free compared to overweight and normal-weight subjects.
Figure 1.
Percent reporting excellent or very good general health by age group and BMI category, U.S. population 20 years and over, NHANES 1999–2002
Figure 2.
Percent reporting no joint pain, aching, stiffness, or swelling in the past year by age group and BMI category, NHANES 1999–2002
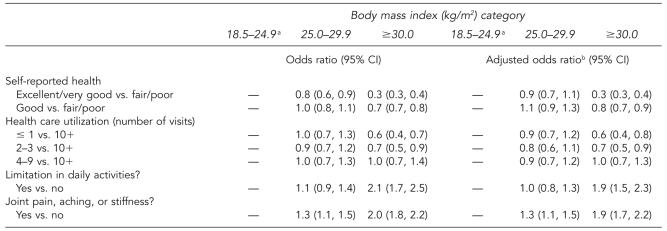
The logistic regression analyses examined the odds of specific outcomes by BMI category; the normal BMI group served as the reference group. Table 3 includes unadjusted and adjusted odds ratios for self-reported and measured health characteristics. The adjusted model controlled for gender, age group, race/ethnicity, education, and cigarette smoking. The odds of excellent/very good health vs. fair/poor health among obese adults was about 0.3 that of normal-weight persons (p<0.001; 95% confidence interval [CI] 0.3, 0.4). Limitations in daily activities were 1.9 times more likely among obese adults compared to normal-weight adults (p<0.001; 95% CI 1.5, 2.3) and the likelihood of having 10 or more health provider visits vs. one or fewer was 0.6 times that of normal-weight persons (p<0.001; 95% CI 0.4, 0.8).
Table 3.
Crude and adjusted odds ratios for self-reported and measured health characteristics by BMI category, U.S. adults 20 years and over, NHANES 1999–2002
Reference group
Adjusted for gender, age group, race/ethnicity, education, and cigarette smoking
CI = confidence interval
DISCUSSION
Increasing BMI was associated with decreased likelihood of self-reported excellent/very good general health among adults, particularly in adults 60 years of age and over. The prevalence of excellent or very good health declined with age in all BMI groups. General health status assessed using self-reported and measured health characteristic data also declined with increasing overweight status. Differences in self-reported current health, limitations in daily activities, joint problems, and health care utilization were observed among the BMI groups after controlling for gender, age group, race/ethnicity, education, and cigarette smoking. We confirmed that sedentary lifestyle behavior is associated with higher BMI levels; overweight and obese adults engaged in more hours of television watching and non-work computer use than the normal BMI group.
The limitations of this analysis include the cross-sectional nature of these data; inferences to causality cannot be made because temporal sequence cannot be established. Potential sources of error for self-reported interview data include recall bias, misinterpretation of the survey questions, interviewer error, and respondent error.27,28 Questionnaire quality control measures included the use of computer-assisted interview methods, standardized questionnaires, intensive interviewer training, and interviewer monitoring.
It is also important to acknowledge that BMI provides an approximation of total body fat as it does not differentiate between persons who have high BMI due to greater lean muscle mass vs. excess body fat.2 Body composition data and measures of abdominal adiposity such as waist circumference were not examined in this analysis. Because fluctuations in body weight occur during a person's lifetime, persons in the normal-weight group may have experienced recent weight loss and conversely, adults who are now overweight may have experienced recent weight gain. Future analyses using the NHANES weight history information may be useful to characterize health outcomes using information on the long-term weight gain/loss patterns of U.S. adults.
Our report is useful to inform health practitioners, researchers, and educators who interact with consumers about the impact of overweight and obesity on functional performance and health status. This information should motivate normal-weight individuals to maintain their weight and could also provide an incentive to those who need to improve their weight status. These findings may also be useful to policymakers and health economists who are concerned about the economic burden associated with adult overweight and obesity. There are compelling health and economic reasons for adults to adopt healthy lifestyles to achieve desirable body weight and improve their overall health and functional status.
REFERENCES
- 1.Hedley AA, Ogden CL, Johnson CL, Carroll MD, Curtin LR, Flegal KM. Prevalence of overweight and obesity among US children, adolescents and adults, 1999–2002. JAMA. 2004;291:2847–50. doi: 10.1001/jama.291.23.2847. [DOI] [PubMed] [Google Scholar]
- 2.Wellman NS, Friedberg B. Causes and consequences of adult obesity: health, social and economic impacts in the United States. Asia Pac J Clin Nutr. 2002;11(Suppl 8):S705–9. [Google Scholar]
- 3.National Heart Lung and Blood Institute Expert Panel on the Identification, Evaluation, and Treatment of Overweight and Obesity in Adults Clinical guidelines on the identification, evaluation, and treatment of overweight and obesity in adults: the evidence report. Obes Res. 1998;6(Suppl 2):51S–209S. [PubMed] [Google Scholar]
- 4.Wolf AM, Colditz GA. Current estimates of the economic cost of obesity in the United States. Obes Res. 1998;6:97–106. doi: 10.1002/j.1550-8528.1998.tb00322.x. [DOI] [PubMed] [Google Scholar]
- 5.Bungum T, Satterwhite M, Jackson AW, Morrow JR., Jr The relationship of body mass index, medical costs, and job absenteeism. Am J Health Behav. 2003;27:456–62. doi: 10.5993/ajhb.27.4.17. [DOI] [PubMed] [Google Scholar]
- 6.Finkelstein EA, Fiebelkorn IC, Wang G. National medical spending attributable to overweight and obesity: how much, and who's paying? [cited 2003 Nov 12]. Health Aff (Millwood) 2003:Suppl Web Exclusives:W3:219-26. Available from: URL: http://www.healthaffairs.org/WebExclusives/Finkelstein_Web_Excl_051403.htm. [DOI] [PubMed]
- 7.Wang G, Zheng ZJ, Heath G, Macera C, Pratt M, Buchner D. Economic burden of cardiovascular disease associated with excess body weight in U.S. adults. Am J Prev Med. 2002;23:1–6. doi: 10.1016/s0749-3797(02)00448-8. [DOI] [PubMed] [Google Scholar]
- 8.Burton WN, Chen C, Schultz AB, Edington DW. The economic costs associated with body mass index in a workplace. J Occup Environ Med. 1998;40:786–92. doi: 10.1097/00043764-199809000-00007. [DOI] [PubMed] [Google Scholar]
- 9.Wee CC, Phillips RS, Legedza AT, Davis RB, Soukup JR, Colditz GA, et al. Health care expenditures associated with overweight and obesity among U.S. adults: importance of age and race. Am J Public Health. 2005;95:159–65. doi: 10.2105/AJPH.2003.027946. [DOI] [PMC free article] [PubMed] [Google Scholar]
- 10.Fontaine KR, Redden DT, Wang C, Westfall AO, Allison DB. Years of life lost due to obesity. JAMA. 2003;289:187–93. doi: 10.1001/jama.289.2.187. [DOI] [PubMed] [Google Scholar]
- 11.Must A, Spadano J, Coakley EH, Field AE, Colditz G, Dietz WH. The disease burden associated with overweight and obesity. JAMA. 1999;282:1523–9. doi: 10.1001/jama.282.16.1523. [DOI] [PubMed] [Google Scholar]
- 12.McGill HC, Jr, McMahan CA, Herderick EE, Zieske AW, Malcom GT, Tracey RE, et al. Obesity accelerates the progression of coronary atherosclerosis in young men. Circulation. 2002;105:2712–8. doi: 10.1161/01.cir.0000018121.67607.ce. [DOI] [PubMed] [Google Scholar]
- 13.Fontaine KR, Bartlett SJ. Estimating health-related quality of life in obese individuals. Dis Manage Health Outcomes. 1998;3:61–70. [Google Scholar]
- 14.Kolotkin RL, Crosby RD, Williams GR. Health-related quality of life varies among obese subgroups. Obesity Res. 2002;10:748–56. doi: 10.1038/oby.2002.102. [DOI] [PubMed] [Google Scholar]
- 15.Hassan MK, Joshi AV, Madhavan SS, Amonkar MM. Obesity and health-related quality of life: a cross-sectional analysis of the U.S. population. Intl J Obesity Relat Metab Disord. 2003;27:1227–32. doi: 10.1038/sj.ijo.0802396. [DOI] [PubMed] [Google Scholar]
- 16.Fontaine KR, Bartlett SJ, Barofsky I. Health-related quality of life among obese persons seeking and not currently seeking treatment. Int J Eating Disord. 2000;27:101–5. doi: 10.1002/(sici)1098-108x(200001)27:1<101::aid-eat12>3.0.co;2-d. [DOI] [PubMed] [Google Scholar]
- 17.Ford ES, Moriarty DG, Zack MM, Mokdad AH, Chapman DP. Self-reported body mass index and health-related quality of life: findings from the Behavioral Risk Factor Surveillance System. Obesity Res. 2001;9:21–31. doi: 10.1038/oby.2001.4. [DOI] [PubMed] [Google Scholar]
- 18.Barofsky I, Fontaine KR, Cheskin LJ. Pain in the obese: impact on health-related quality of life. Ann Behav Med. 1997;19:408–10. doi: 10.1007/BF02895160. [DOI] [PubMed] [Google Scholar]
- 19.Centers for Disease Control and Prevention (US) National Center for Health Statistics. NHANES 1999–2000 public data release file documentation. [cited 2004 Jan 6]. Available from: URL: http://www.cdc.gov/nchs/data/nhanes/gendoc.pdf.
- 20.Centers for Disease Control and Prevention (US) National Center for Health Statistics. NHANES 1999–2000 data release, July 2004, sample person questionnaire, demographics. [cited 2005 Aug 17]. Available from: URL: http://www.cdc.gov/nchs/data/nhanes/frequency/demo_doc.pdf.
- 21.Day JC, Newburger EC. The big payoff: educational attainment and synthetic estimates of work-life earnings. Current Population Reports. Department of Commerce (US), Economics and Statistics Administration, Census Bureau (US). Issued 2002 Jul. [cited 2005 May 25]. Available from: URL: http://www.census.gov/prod/2002pubs/p23-210.pdf.
- 22.Centers for Disease Control and Prevention (US) National Center for Health Statistics. NHANES analytic guidelines; 2004 Jun. [cited 2004 Jan 5]. Available from: URL: http://www.cdc.gov/nchs/data/nhanes/nhanes_general_guidelines_june_04.pdf.
- 23.Center for Chronic Disease Prevention and Health Promotion (US) Smoking and health: a national status report. A report to Congress. Office on Smoking and Health. United States Public Health Service. Office of the Surgeon General. 1990. DHHS Publication No. (CDC) 87-8396; (revised 02/90) [Google Scholar]
- 24.SAS Institute. SAS 9.1. Cary (NC): SAS Institute; 2004. [Google Scholar]
- 25.Research Triangle Institute. SUDAAN 8.0. Research Triangle Park (NC): Research Triangle Institute; 2001. [Google Scholar]
- 26.Wolter KM. Introduction to variance estimation. New York: Springer-Verlag; 1985. [Google Scholar]
- 27.Tourangeau R, Rips L, Rasinski K. The psychology of survey response. Cambridge (UK): Cambridge University Press; 2000. pp. 1–61. [Google Scholar]
- 28.Clark HH, Schober MF. Asking questions and influencing answers. In: Tanur JM, editor. Questions about questions: inquiries into the cognitive bases of surveys. New York: Russell Sage Foundation; 1992. pp. 15–48. [Google Scholar]


