Abstract
The collective motions of the core and C-terminal domains of human topoisomerase I (topo I) have been analysed by molecular dynamics simulation of the protein in covalent complex with a 22 bp DNA duplex. The analysis evidenced a great number of correlated movements of core subdomain I and II residues, and a central role for helix 5 in the protein–DNA communication, in particular with the scissile strand downstream of the cleavage site. The flow of information between these core subdomains and DNA suggests that subdomains I and II play an essential role in the DNA relaxation process. In core subdomain III the majority of DNA contacting residues do not communicate with protein regions far from DNA, suggesting that they have a structural role. However, selected core subdomain III residues, involved in the orientation of the active site region, show correlated movements with residues distant from DNA, indicating that the information concerning the catalytic event is also transmitted. The flexibility of two loops formed by residues 519–520 and 580–584 seems indispensable to the dynamic participation of core subdomain III to the DNA cleavage and religation steps. The motion of specific residues has also been found to explain the effect of single point mutations that make topo I resistant to the anticancer drug camptothecin.
INTRODUCTION
Topoisomerases are a ubiquitous family of enzymes that are essential for the cellular regulation of DNA supercoiling, generated by processes such as replication, transcription and recombination. Eukaryotic topoisomerase I (topo I) enzymes catalyse the relaxation of DNA supercoils by introducing a transient single-strand break and forming a covalent phosphotyrosyl bond with the 3′ end of the broken DNA strand. The human topo I is composed of four domains: the N-terminal, the core (formed by three subdomains), the linker and the C-terminal domain, which includes the catalytic Tyr723. A reconstituted form of the enzyme comprising the core and the C-terminal domains, still active in vitro, has been crystallised in both covalent and non-covalent complexes with a 22 bp DNA duplex (1,2). The X-ray structures of the human topo I–DNA complex indicate that the most likely mechanism for the relaxation process is the so called ‘controlled rotation’, in which the enzyme regulates the rotation of the scissile DNA strand around the intact one, via electrostatic interactions between the positive charged protein domains and the negative charged DNA (1,2).
The topo I catalytic cycle is composed of five subsequent steps: binding of the enzyme to DNA; DNA cleavage; controlled rotation of the DNA scissile strand; DNA religation; and DNA release (3). During these steps the enzyme goes through large conformational variations without any need for energy cofactors, from an ‘open’ structure that allows the DNA binding, to the ‘close’ conformations observed by X-ray diffraction in which the enzyme completely embraces the DNA. X-ray diffraction structures also revealed the presence of a conformation flexibility among the protein domains, consistent with the ‘controlled rotation’ mechanism (4–6). The static and dynamic knowledge of the various topo I conformational changes is an indispensable requirement for the connection of protein motions with enzymatic function, which can open the way to the engineering of more efficient drugs. Topo I, in fact, has been identified as the only cellular target of the antitumoural drug camptothecin (CPT) that acts by stabilising the topo I–DNA cleavage complex (7). Several CPT derivatives, including irinotecan and topotecan, have been introduced for the treatment of ovarian and colon carcinoma (8,9), while others are in phase I–II clinical trials and are likely to be used in a variety of other human cancers (7). Interestingly, several single point mutations of topo I residues distant from the active site have been found to be CPT-resistant (CPTr) (7), indicating that distant protein regions communicate.
Molecular dynamics (MD) is a well consolidated method for the investigation of structural and dynamic properties of proteins and, in the last few years, it has been successfully applied to the study of nucleic acids, either isolated (10–12) or in complex with proteins (13–16). Recently, we have carried out an MD simulation of the covalent topoisomerase–DNA complex which provided useful information on the protein– DNA interactions, and highlighted the role of water, both in the protein–DNA recognition and in the catalytic reaction (14). The simulation of the topo I–DNA complex is particularly challenging because of the dimensions of the system (almost 80 000 atoms) and of the duration of the simulation (1500 ps), and it has generated a great amount of data. MD simulations, in fact, furnish a full description of the atomic movements, but the abundance of information makes it difficult to get a clear picture of the conformational space visited during the simulation. Several types of analyses, like the dynamic cross-correlation (DCC) map (17) or the principal component analysis (18,19), have been proposed with the aim to separate the large collective protein movements connected to functional properties from the small, uninteresting motions (20,21).
In this work we have applied these analyses for the first time on such a large system. The aims of this study were to characterise the collective motions of different topo I regions, and to evaluate the role of single residues in the enzymatic cycle. The analyses performed on the topo I–DNA complex have permitted us to demonstrate the different dynamic behaviour of the various core subdomains and to propose structural interpretations of some single point topo I mutations that confer CPT resistance.
MATERIALS AND METHODS
The starting coordinates of the DNA–topoisomerase complex were obtained from X-ray diffraction (PDB entry 1a31) (1) and modelled with the AMBER95 all-atom force-field (22). The DNA–protein complex was immersed in a rectangular box (105 × 92 × 99 Å3) filled with TIP3P (23) water molecules, imposing a minimum solute-wall box distance of 10 Å. The total system is composed of 7679 protein atoms, 1401 DNA atoms, 27 Na+ counterions and 23 216 water molecules, giving a total of 78 755 atoms, and it was simulated in periodic boundary conditions, using a cut-off radius of 9 Å for the non-bonded interactions, and updating the neighbour pair list every 10 steps. The electrostatic interactions were calculated with the particle mesh Ewald method (24,25). The SHAKE algorithm (26) was used to constrain all bond lengths involving hydrogen atoms. After an initial equilibration, a 1.5 ns simulation was carried out at a constant temperature of 300 K using Berendsen’s method (27) and at a constant pressure of 1 bar with a 2 fs time step. Pressure and temperature coupling constants were 0.5 ps. Further details of the MD protocols are presented elsewhere (14).
The analyses reported in this manuscript refer to the last 1300 ps of the trajectory (i.e. from 200 to 1500 ps), since the trend of the root mean square deviations of the protein–DNA complex indicates that the system was well stabilised after 200 ps (14). The DCC map of the protein–DNA complex was built with in-house written code, taking into account the coordinates of the protein Cα atoms and the DNA phosphate atoms. The elements of the DCC map (Cij) were computed as:
where Δri is the displacement from the mean position of the ith atom and the 〈 〉 represent the time average over the whole trajectory (17). Positive Cij values represent a correlated motion between residues i and j, i.e. the residues move in the same direction. Negative values of Cij represent an anti-correlated motion between residues i and j, i.e. they move in opposite directions. The GROMACS MD package was utilised for all the other analyses (28). Figures 4, 6 and 7 and the movies of the MD projections along the first three eigenvectors, shown as Supplementary Material at NAR Online, were created using the VMD visualisation package (29) and animated with the Gifsicle program (http://www.lcdf.org/gifsicle).
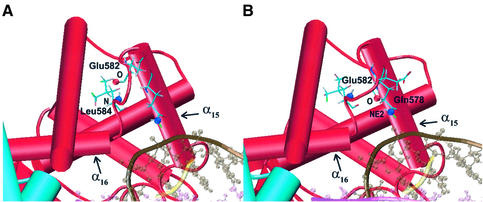
Figure 4.
Two MD snapshots taken as representatives of the two different families of conformations visited by Glu582 during the simulation. (A) The oxygen backbone atom of Glu582 (red sphere) is hydrogen bonded with the N backbone atom of Leu584 (blue sphere). (B) The oxygen backbone atom of Glu582 (red sphere) forms a hydrogen bond with the lateral chain of Gln578 (NE2 atom, blue sphere). Helices 15 and 16 are labelled in both panels.
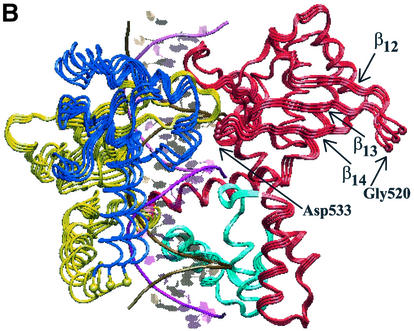
Figure 6.
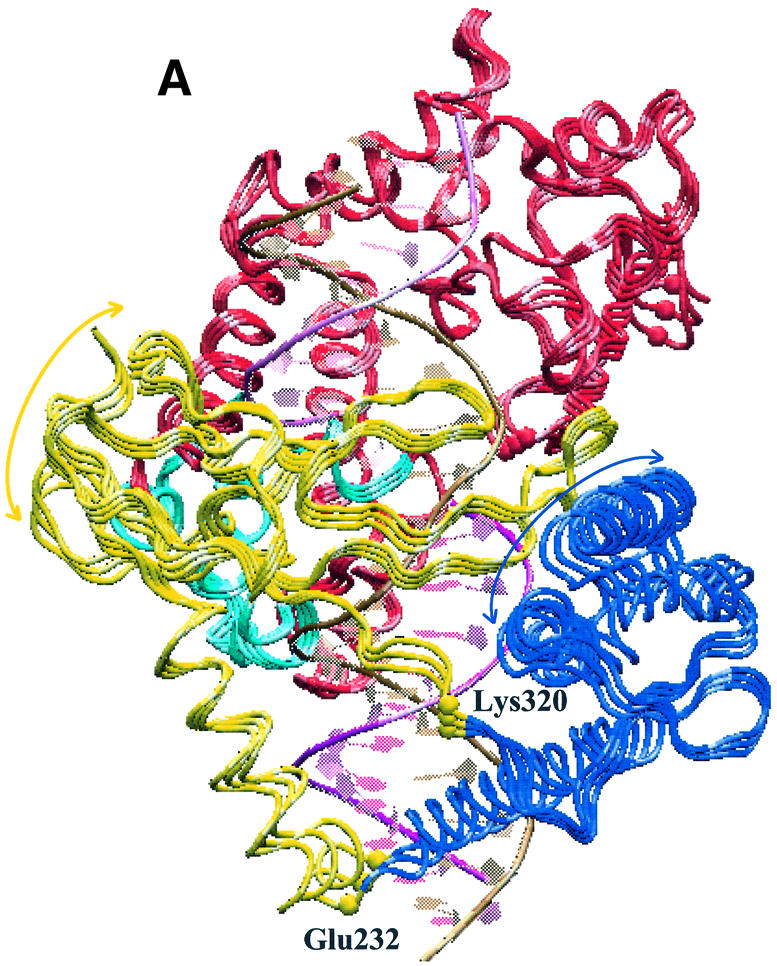
Projections of the topo I MD motions along the first eigenvector. The two extreme projections and the average protein structure are represented from two different viewpoints. Core subdomains I, II and III are represented in yellow, blue and red, respectively; the C-terminal domain in cyan; the intact DNA and scissile strands in purple and gold, respectively. (A) The rotation of core subdomain I and II in the directions shown by the yellow and blue arrows, respectively. The two residues with the largest displacement along this eigenvector, Glu232 and Lys320, are labelled and represented with yellow spheres. (B) The concerted motion of the β12–β13–β14 sheet, permitted by the high flexibility of the loop centred on Gly520 (red sphere). Such a motion is coupled with that of helix 13, containing Asp533 (red sphere).
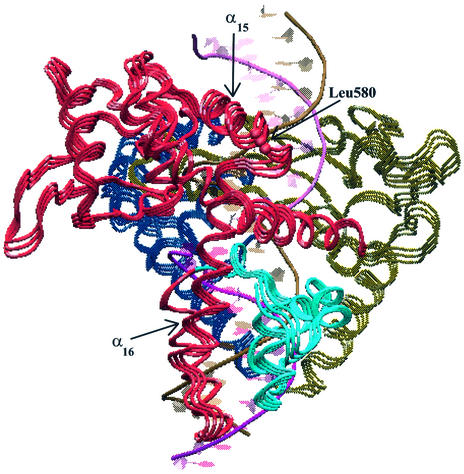
Figure 7.
Projections of the topo I MD motions along the third eigenvector. The two extreme projections and the average protein structure are represented using the same colour scheme of Figure 6. The figure allows the observation of the concerted motion between helix 16, located in core subdomain III, and the C-terminal domain. Leu580, the residue with the largest displacement along this eigenvector, is highlighted with a red sphere. Helices 15 and 16, whose motions are uncoupled by the flexibility of the 580–584 loop, are also labelled.
RESULTS AND DISCUSSION
Dynamic cross-correlation map
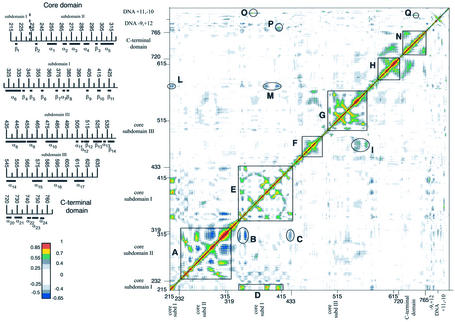
The DCC map for the topoisomerase–DNA complex is shown in Figure 1. This analysis furnishes an aggregate picture of the correlated motions occurring between protein residues and DNA bases during the simulation (17). Highly positive peaks of the elements of the map (Cij) are indicative of strong correlation in the movement of residues i and j, while negative Cij values denote that the two residues move along opposite direction (anti-correlated motion). The analysis was carried out on the 458 Cα atoms of the protein and 42 P atoms of the DNA backbone, since they contain enough information to describe the largest system motions. The regions with the highest interactions were enclosed by squares and circles. In the topo I–DNA complex different protein regions have highly correlated motions, characterised by peaks with intensity of magnitude greater than that usually found in other protein systems (30,31). We think that this unusual large correlation is a peculiarity of the system and reflects the large conformational changes that the protein and DNA must undergo during the functional processes. Protein anti-correlated movements (negative map values) have magnitudes smaller than the correlated movements, but in our opinion they play an important role in the protein–protein domain communication. In order to facilitate the presentation of the data, we used different thresholds and colours to represent the correlated and anti-correlated motions: correlated values with 0.55 ≤ Cij < 0.70, 0.70 ≤ Cij < 0.85 and 0.85 ≤ Cij < 1 are represented in green, yellow and red, respectively, while the maximum anti-correlation values (–0.65 ≤ Cij < –0.50) are represented in blue. The correlation range 0 ≤ Cij < 0.55 and the anti-correlation range –0.50 ≤ Cij < 0 are represented in a grey scale depending on the absolute value of the correlation. The value 1, along the diagonal (correlation of the residue with itself), is represented in black. Even if the DCC map is symmetric, it is represented on the whole square for the sake of clarity.
Figure 1.
DCC map for the topo I–DNA complex. Green, yellow and red points represent correlated values with 0.55 ≤ Cij < 0.70, 0.70 ≤ Cij < 0.85 and 0.85 ≤ Cij < 1, respectively (Cij is defined in Materials and Methods). Anti-correlation values –0.65 ≤ Cij < –0.50 are represented in blue. The correlation range 0 ≤ Cij < 0.55 and the anti-correlation range –0.50 ≤ Cij < 0 are represented in a grey scale depending on the absolute value of the correlation. The value 1, along the diagonal (correlation of the residue with itself), is represented in black. Secondary structure elements are shown in the left part of the figure.
DCC map of core subdomains I and II
The region having the highest concentration of correlated peaks has been highlighted within square A. This region spans from residue 235 to 325, containing the whole core subdomain II and a few residues of core subdomain I. The large number of positive and negative peaks shows a complex network of interactions to which structured and unstructured protein regions participate. Helix 5 (residues Thr303–Met319) likely plays a central role in the topoisomerase architecture, since it moves like a rigid body, with each of its 10 central residues (Ser306–Ala315) having strong correlations (DCC map values between 0.9 and 1) with the four contiguous C-terminal residues. Moreover, helix 5 shows high DCC map values with several protein residues contained in square A, which are either positive (correlated movements) with residues Ala261–His266 and Val238–Lys239, or negative (anti- correlated movements) with residues Glu285–Asn292, forming helix 4. Helix 5 is also in communication with regions belonging to different domains, as shown by circles B and C which enclose the anti-correlated interactions between helix 5 and the β4–β5 hairpin (residues 339–351) and Asn430, respectively, both located within core subdomain I. Further more, during the simulation, helices 5 and 6 form several direct and water-mediated hydrogen bonds with the scissile DNA strand downstream of the cleavage site (14), which must be broken in order to permit the rotation of the scissile strand around the intact one. Therefore, the DNA relaxation process is directly felt by helices 6 and 5, and the information on the relaxation state is then transmitted by this latter helix to core subdomains I and II regions far from DNA.
A central role is also played by the β4–β5 hairpin which, in addition to the communication with helix 5, permits the communication among different residues located in both the N-terminal (residues 215–232) and the C-terminal (residues 320–433) regions of core subdomain I, highlighted in Figure 1 by rectangle D and square E, respectively. In fact, residues 215–221 in the N-terminal portion show highly correlated movements with the β4–β5 hairpin and the β8–β9 parallel sheet (residues 382–387 and 402–408, respectively), both belonging to the C-terminal portion of core subdomain I (rectangle D). Square E encloses the positive correlations among residues located in the subdomain I C-terminal region, involving hairpin β4–β5, helix 7 (residues 379–381), the β8–β9 parallel sheet and hairpin β10–β11 (residues 410–427), and the anti-correlated motion again between the β4–β5 hairpin and the β strands 6 (residues Pro357–Phe361) and 7 (residues Met370–Ile377). The core subdomain I residues enclosed by square E form a great number of direct and water-mediated contacts with DNA. Strands 5, 6, 7 and 9, in particular, interact with the intact DNA strand, while β10–β11 enter into the major groove of DNA roughly opposite the cleavage site, permitting a strong interaction with both DNA strands (14). Strands 9, 10 and 11 have structural similarity with strands 3, 4 and 5 of vaccinia virus topoisomerase, the only type Ib topoisomerase not found in eukaryotic cells (32). In addition, Tyr426, located in β11 of human topo I, which forms a stable direct hydrogen bond with DNA (1,14), superimposes with Tyr70 located in β5 from the vaccinia virus (32). The conservation of this structural motif in evolutionary distant organisms emphasises its central role in protein– protein and DNA–protein communications. Consistently, β11 and lip1 (residues 361–369) are the only core domain regions that have correlated movements >0.7 with the DNA backbone. Residues 409–412, in fact, have correlated movements with the –3 and –4 DNA bases of the scissile strand (encircled by circle P), while Gly363 and Arg364 movements are correlated with the –1 base of the intact strand (encircled by circle O). These correlations correspond to the direct and water- mediated hydrogen bonds that these residues form with DNA (14), but still are very interesting because the absence of such intense correlations in the great majority of the DNA–core subdomain III contacts demonstrate their different characteristics.
Lip1, inserted between β6 and β7, is one of the two lips that close the clamp around the DNA (lip1, Phe361–Lys369 in core subdomain I; lip2, Asn491–Thr501 in core subdomain III) (1), and it is a key region also for the enzymatic activity. Mutations of Phe361, Gly363 and Arg364, in fact, produce CPTr enzymes (33–38), and it has been hypothesised that the interactions between Arg362, Arg364 and DNA regulate the correct positioning in the active site of the catalytic tyrosine (37). The DCC map analysis evidenced that lip1 have correlation motions <0.7 with lip2, even if they form two stable direct hydrogen bonds during the simulation (between Lys369 and Glu497 for 89% of the time and between Asp366 and Asn500 for 82% of the time), demonstrating that stable interactions between two residues are not enough to give a high correlated motion of their main chains.
DCC map of core subdomains III
Residues belonging to core subdomain III shows highly correlated motions concentrated in three regions (represented in Fig. 1 by squares F, G and H), with very few correlations to other residues in the same subdomain or in other protein regions.
Square F shows medium correlation among residues belonging to helices 9 and 10 (residues 457–463 and 472–487, respectively). The last helix has a medium correlation with helix 14 (residues 544–556), highlighted in circle I. Helix 9 is one of the two helices, the other being helix 8, which was proposed to play a role in the mechanism of opening and closure of the enzyme around DNA (1,2). We did not find any confirmation of this hypothesis from the dynamic behaviour of this helix, since a long range correlated motion with other protein regions is not observed.
Almost all the core subdomain III residues enclosed by square G (residues 495–565) have high DCC map values among themselves, the strongest correlations occurring between β12 (residues 510–518) and β13 (residues 521–529), between β13 and β14 (residues 536–543) and within helix 14 residues (residues 545–553). Again, this correlation can be of functional importance, since the short helix 13 (residues 532–534), inserted between strands 13 and 14, contains Lys532 that provides the only base-specific contact with the scissile DNA strand (1,14), and Asp533 whose mutation into asparagine or glycine provokes human CPT resistance (39,40).
In square H (residues 592–625) the correlated motions among the residues belonging to the C-terminal portion of helices 16 and 17 (residues 585–605 and 612–622, respectively) are highlighted. In particular, residues 592–600 display a correlated motions only among themselves, while residues 601–607 of helix 16 have high correlation movements with helix 17. It is worth noting that this is the only core domain region that shows significant correlated motion, though <0.7, with the C-terminal domain, to which belongs the catalytic tyrosine. This correlation regards mainly the interactions between helices 16–17, in the core subdomain III, with helices 20–21 in the C-terminal domain.
In general, as mentioned, core subdomain III is characterised by the lack of long range correlation movements, both intra- or inter-subdomains. Interestingly, the core subdomain III residues 436–443 and 488–501, inserted between squares E–F and F–G, are particularly deficient of correlation movements with any other protein residues, although they form many different direct and water-mediated hydrogen bonds with both the intact and scissile DNA strands (14). This result indicates that the presence of protein–DNA contacts does not necessarily imply the occurrence of a protein–DNA dynamic coupling, as was instead observed for residues in core subdomains I and II. Moreover, this finding suggests that core subdomain III must have a different role in the topoisomerase catalytic cycle when compared with core subdomains I and II. Subdomain III is probably involved in the tight binding of DNA and in the orientation of the active site residues; the other two are more likely involved in the relaxation process which needs communication between distant protein regions.
Also, residues 574–590, inserted between squares G and H, form numerous direct and water-mediated protein–DNA interactions, and again do not show high correlated movements with other protein residues with the exception of a single residue, His576 in helix 15 (570–580). This residue is actually anti-correlated with several core subdomain I residues, such as 215–216, 219–220, 386–387, 406–410, highlighted by circles L and M in Figure 1. These four subdomain I segments belong to structured and unstructured regions that have been already described to play an important role in the communication within subdomain I (highlighted in rectangle D and square E). In our opinion, His576 may play an important role in the topo I–DNA communication and it would be worth studying further, either through MD simulation or site-directed mutagenesis.
DCC map of the C-terminal domain
The intra-domain motions of the C-terminal domain are represented in Figure 1, enclosed by square N, and they show medium correlation between the residues belonging to helix 21 (residues 726–735) and the C-terminal portion of the domain (residues 759–763). This domain has the only other relatively strong correlation with the DNA backbone (highlighted in circle Q), in addition to the two indicated in core subdomain I. It regards the +4 DNA base of the intact strand with residues 749–751, again residues forming several direct hydrogen bonds with DNA during the simulation (14).
φ/ψ Topoisomerase order parameter S2
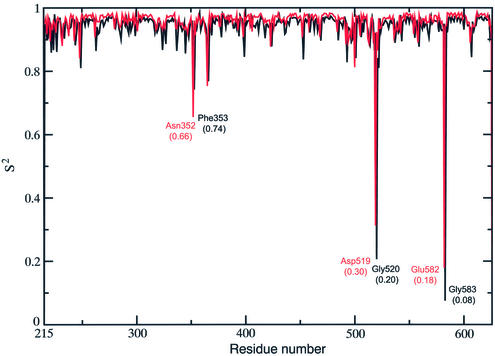
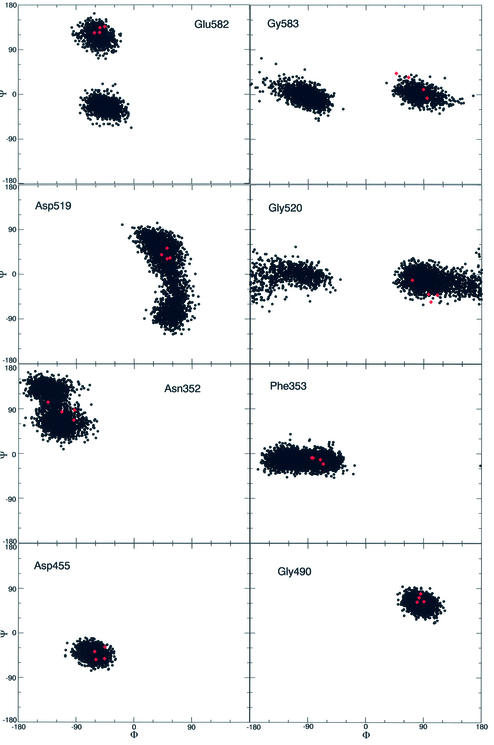
A useful method to monitor the flexibility of a protein is the calculation of an order parameter S2, which can be defined through the φ/ψ dihedral angles of the protein sampled during the simulation (41). S2 gives a measure of the system flexibility, being 1 in a completely rigid system, or 0 in a system where all the possible conformations are sampled. Figure 2 shows this order parameter for the topo I backbone. The protein backbone results quite rigid, with the great majority of the φ/ψ dihedral angles visiting a relatively small conformational space. Two couples of φ/ψ dihedral angles, Gly583/Glu582 and Gly520/Asp519 located in core subdomain III, display a high flexibility, the respective φ/ψ S2 values being 0.08/0.18 and 0.2/0.3. Another couple, Asn352/Phe353 located in core subdomain I, has S2 values that, although not as low as the two previous couples, are still significantly different from the rigid values found for the other residues (Fig. 2). The dynamic behaviour of these dihedral angles is better understood upon inspection of the Ramachandran plots of the respective residues as a function of the simulation time (Fig. 3). The figure also displays, as red dots, the dihedral angles observed in the structures of the topo I–DNA complex, crystallised in different conditions (PDB entries 1a31, 1a35, 1a36 and 1ej9) (1,2,5,42). The data show that the Gly583 and Glu582 residues during the simulation visit two preferred families of conformations, corresponding to well separated range values of the ψ and φ angles, respectively. From 200 to 680 ps of the simulation time the protein backbone visits the conformations defined by the Glu582 ψ angle included between 60° and 150° and by the Gly583 φ angle included between 30° and 150°, while in the last 820 ps the system visits the conformations with the Glu582 ψ angle included between –90° and 30° and the Gly583 φ angle included between –180° and –30°. Two different snapshots of the MD simulation, corresponding to the two above described conformations, are represented in Figure 4. During the first part of the simulation the backbone oxygen atom of Glu582 preferentially forms a hydrogen bond with the main chain of Leu584, which is located at the C-terminal of helix 16, while during the last part of the simulation the same oxygen atom preferentially forms a hydrogen bond with the side chain of Gln578, belonging to helix 15. This conformational switch makes the movement of Glu582 alternatively integrated with helix 16 or 15, two protein elements having a different structural role. Helix 15 in fact interacts tightly with the intact DNA strand through two direct and a water-mediated stable hydrogen bonds (14), and its motion is not correlated with any other protein region (see DCC map results); helix 16 has a correlated motion with helices 20–21 in the C-terminal domain, as already noted in the previous paragraph and further discussed in the next. Therefore, the flexibility of these residues, intercalated between helices 15 and 16, permits the structural and dynamic uncoupling of the two helices, a necessary event for the topo I function.
Figure 2.
Order parameter S2 for the φ (black line) and ψ (red line) dihedral angles of topo I. The six residues with the absolute minimum for the two angles are reported with their respective S2 value in brackets.
Figure 3.
Ramachandran plots of the topo I–DNA complex representing the protein φ/ψ conformations visited by the MD simulation (black dots). The φ/ψ values observed in the four X-ray diffraction structures with PDB entries 1a31, 1a35, 1a36 and 1ej9 are also reported for comparison (red diamonds).
Figure 2 shows that another highly flexible point is represented by Asp519 and Gly520, located in the loop connecting β12 and β13. At variance with Gly583/Glu582, the Asp519–Gly520 low order parameter value is due to the great fluctuations of their backbone during the simulation. In agreement, Asp519 and Gly520 are the residues having the largest Cα fluctuations (data not shown). This flexibility can be well appreciated upon inspection of their Ramachandran plots (Fig. 3), which show the spread range of ψ and φ angles visited during the simulation by Asp519 and Gly520, respectively. These residues, despite their large fluctuations, maintain a correlated motion with the neighbour residues, as demonstrated by the numerous correlation peaks in square G of the DCC map (Fig. 1). This region is composed of the β12–β13–β14 sheet, helix 14 and helix13, the latter one being inserted between strands 13 and 14. The large flexibility of the Asp519–Gly520 loop, inserted between strands 12 and 13, is indispensable for the coordinate movement of the β12–β13–β14 sheet and the fine tuning of the interactions between helix 13 and the scissile DNA base. The dynamic behaviour of this region will be further discussed in the next paragraph.
The third minimum of the order parameter S2 is located in the Asn352/Phe353 backbone. The Ramachandran plots of these residues (Fig. 3) show that Asn352 visits conformations with a nearly uniform spread of the ψ and φ angles, while Phe353 shows larger flexibility along the φ angle. This dynamic behaviour may be relevant for the high inhibitory power displayed by the 7-ethyl-10-hydroxy-20-S-CPT (SN-38), one of the most potent topo I poisons (7). In fact, mutation of Asn352 to Ala produces an enzyme with nearly equal sensitivity to CPT or SN-38 (43). Moreover, the recent X-ray structure of the topotecan–topo I–DNA complex has shown that Asn352 is located in a cavity in front of the N(CH3)2 group of the topotecan A ring (44). It is likely that the high flexibility of the Asn352/Phe353 backbone may play an important role in modulating drug binding.
Figure 3 also shows the Ramachandran plots of Asp455 and Gly490, taken as representatives of any other residue having a high S2, being 0.96/0.97 the φ/ψ S2 order parameter values of both residues. The Ramachandran plots clearly show that these residues sample conformations close to the X-ray ones (red points), during the entire trajectory.
Principal component analysis
The principal component analysis, or essential dynamics, has been applied in order to better identify the protein concerted motions, since it furnishes supplementary information when compared with the DCC map (18,19). In the DCC map analysis, in fact, two residues that move along perpendicular lines have a DCC map correlation value of zero, even though they move in-phase and with the same period. The principal component analysis, based on the diagonalisation of the covariance matrix built from the atomic fluctuations after the removal of the translational and rotational movement, permits the identification of the few 3N directions along which the majority of the protein motion is defined. The analysis, carried out on the 458 Cα atoms of the protein, defines the motion dispersed over 458 eigenvectors; however, 80% of the total protein motion is described by the first 30 eigenvectors with the largest eigenvalues (data not shown), as generally found for many different systems (30,45). Here we describe the topo I motions along the first three eigenvectors, which contain 43% of the total protein motion.
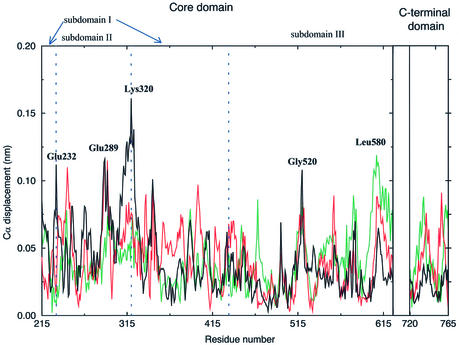
The displacement of each Cα along the three eigenvectors with the largest eigenvalues (Fig. 5) show that the protein motions along the first eigenvector are mainly concentrated in the core subdomains I and II, where three of the four protein regions with displacement >0.11 nm are found. Two of these maxima are located at the two boundaries between core subdomain I and II, being centred on Glu232 and Lys320. The projection of the MD motions along this eigenvector is shown in Figure 6, where the two extreme projections along the eigenvector, together with the average structure, are represented. A dynamic visualisation of the MD projections along the first three eigenvectors are available as Supplementary Material at NAR Online. Both subdomains I and II (yellow and blue in Fig. 6, respectively) move as a whole, and their motions can be described as a rotation in planes perpendicular to the DNA axis, in different directions (Fig. 6A). Glu232 and Lys320, the residues characterised by the highest displacement along this eigenvector (Fig. 5), represent the boundaries between these different rotations. This movement provokes the advancement toward DNA of helices 5 and 6, and the concomitant withdrawal from DNA of hairpin β10–β11, and vice versa. Since helices 5 and 6 are in contact with the DNA scissile strand, it is likely that the rotation of this strand, during the DNA relaxation process, provokes a movement of the helices that is transduced in the observed rotation of these two subdomains. The principal component analysis, therefore, demonstrates that core subdomains I and II play a direct influence on the DNA relaxation process and that helix 5 and hairpin β10–β11 are segments of key importance in mediating the protein–DNA communication, thus confirming the DCC map results (Fig. 1).
Figure 5.
Displacement of each topo I Cα atom along the three eigenvectors having the largest eigenvalues. The displacement along the first, second and third eigenvectors is represented with black, red and green lines, respectively. Residues with the largest displacements are labelled. The boundaries between the three core subdomains are marked with vertical dashed lines.
Core subdomain III residues have generally low displacements along the first eigenvector (Fig. 5), confirming that this domain exerts mainly the role to bind DNA and that the majority of its protein–DNA contacts do not transmit information, at variance from that observed for subdomains I and II. Figure 5 shows that Gly520 is the only residue, in core subdomain III, with a displacement >0.10 nm along the first eigenvector. The flexibility of Gly520 is also confirmed by the maximum root mean square fluctuations of its Cα atom (∼0.19 nm) and by the Ramachandran plot, shown in Figure 3. This flexibility of Gly520, located in the loop between strands 12 and 13, permits the concerted motion of the β12–β13–β14 sheet as a whole (Fig. 6B). Although this movement has a small amplitude (∼0.05 nm) it permits the direct insertion and removal of helix 13 in the DNA minor groove and its participation in the active site orientation. These data suggest that this core subdomain III region plays an essential role in the DNA cleavage and religation reactions, and that the flexibility of Gly520 is a crucial feature for the topoisomerase catalytic event. In agreement, this core subdomain III region shows highly correlated movement among its residues, as shown by the numerous peaks enclosed in square G of the DCC map (Fig. 1). Moreover, helix 13 contains Lys532, which forms a direct and base-specific hydrogen bond with the –1 scissile DNA base (1,14), and Asp533, which is a CPTr mutation site (39,40). It has been proposed that, during the relaxation process, the +1 DNA base rotates out of the DNA helix, forming hydrogen bonds with Asp533, Arg488 and Arg590 (43). This bond should be broken after several rounds of controlled rotation, thus permitting the rotation of the +1 base back into the DNA helix and the religation of the nicked strand (43). Our simulation shows that even small movements of Asp533, such as those due to the formation and disruption of this hydrogen bond, would be transduced in the motion of the β12–β13–β14 sheet.
The C-terminal domain has its maximal displacement along the second and third eigenvector, at variance to that observed for the core domain. In particular, helix 24 and the loop inserted between helices 21 and 22 have the maximum displacement along the second eigenvector, while helix 21 and the N-terminal portion of the domain have the maximum displacement along the third eigenvector (Fig. 5). The other protein region with great displacement along the third eigenvector is located between helices 15 and 17 in core subdomain III, where Leu580 displays the second largest displacement (Fig. 5). The projection of the MD motions along the third eigenvector is shown in Figure 7, where the two extreme conformations along this eigenvector and the average structure are represented. Helices 16–17 of core subdomain III move in a correlated way with the C-terminal domain, in agreement with the DCC map results. This movement provokes the pushing/withdrawing of helices 22 (residues 740–743) and 23 (residues 746–751) toward the intact DNA strand. The same movement also permits the fine tuning of the catalytic residue Tyr723 position, thus controlling the catalytic event. At the same time, helix 15 of core subdomain III maintains stable direct and water-mediated contacts with the DNA intact strand (14). The different dynamic behaviour of helices 15 and 16 produce a strong flexibility of the connecting loop, as evidenced by the maximum displacement along the third eigenvector of Leu580 (Fig. 5), by the low dihedral order parameter S2 of Glu582 and Gly583 (Fig. 2), and by their Ramachandran plots (Fig. 3).
As a final comment we observe that the principal component analysis indicates that the protein motions along the first eigenvector of helices 5, 6 13 and 23 show a synchronised movement toward DNA when β11 moves backward, and vice versa.
CONCLUSIONS
The MD simulation carried out on the human topo I–DNA complex has permitted us to identify the dynamic behaviour of different topoisomerase regions. First, core subdomains I and II have evidenced the presence of several regions having large correlated movements, according to both the DCC map and the principal component analysis. All these strong correlations involve structures that are in direct contact with DNA, such as helix 5, β6–β7 or β10–β11, representing the information flux between DNA contacting and not contacting regions. In particular, helix 5 contacts the DNA scissile strand downstream of the cleavage site, and therefore it probably transmits the information coming from the rotation of this strand, during the relaxation process. All this evidence suggests that core subdomains I and II are mainly involved in the controlled rotation step and in the subsequent enzyme release.
On the contrary, core subdomain III is rich in protein–DNA contacts but shows a much lower number of correlated movements suggesting that it is mainly involved in the tight binding of DNA. A few exceptions are the 495–565 and 580–622 regions. The first one, which contains helix 13, is rich in correlation movements among its residues. Helix 13, through Lys532 and Asp533, couples the position of the scissile DNA base with the concerted motion of the β12–β13–β14 sheet. The 580–622 core subdomain III region contains the sole residues that show correlation movements with the C-terminal domain, thus exerting an influence on the catalytic Tyr723. Moreover, the analysis shows that the structural role described for the two core subdomain III regions is permitted by the unusually high flexibility observed in the backbone of the 519–520 and 580–584 loops. Core subdomain III has then several functions: (i) it tightly binds the DNA; (ii) it orients the active site residues in order to cleave and religate the DNA; and (iii) it transmits the information on the ongoing catalytic event through concerted motions involving catalytic residues and protein regions distant from the active site.
SUPPLEMENTARY MATERIAL
Supplementary Material is available at NAR Online.
Supplementary Material is available at NAR Online.
Acknowledgments
ACKNOWLEDGEMENTS
We thank P. D’Angelo and N. Sanna for helpful suggestions, and M.-A. Ceruso for his contribution to the analysis codes used in this work. We also acknowledge the CASPUR Computational Center for the computer architecture used in this work. This work was partly supported by a MURST COFIN2001 project on DNA Topoisomerase I and by a FIRB project on Bionformatics for Genomics and Proteomics. P.F. was supported by a fellowship from Federazione Italiana Ricerca Cancro (FIRC).
REFERENCES
- 1.Redinbo M.R., Stewart,L., Kuhn,P., Champoux,J.J. and Hol,W.G.J. (1998) Crystal structures of human topoisomerase I in covalent and noncovalent complexes with DNA. Science, 279, 1504–1513. [DOI] [PubMed] [Google Scholar]
- 2.Stewart L., Redinbo,M.R., Qiu,X., Hol,W.G.J. and Champoux,J.J. (1998) A model for the mechanism of human topoisomerase I. Science, 279, 1534–1541. [DOI] [PubMed] [Google Scholar]
- 3.Pommier Y., Pourquier,P., Fan,Y. and Strumberg,D. (1998) Mechanism of action of eukaryotic DNA topoisomerase I and drugs targeted to the enzyme. Biochim. Biophys. Acta, 1400, 83–106. [DOI] [PubMed] [Google Scholar]
- 4.Redinbo M.R., Stewart,L., Champoux,J.J. and Hol,W.G.J. (1999) Structural flexibility in human topoisomerase I revealed in multiple non-isomorphous crystal structures. J. Mol. Biol., 292, 685–696. [DOI] [PubMed] [Google Scholar]
- 5.Redinbo M.R., Champoux,J.J. and Hol,W.G.J. (2000) Novel insight into catalytic mechanism from a crystal structure of human topoisomerase I in complex with DNA. Biochemistry, 39, 6832–6840. [DOI] [PubMed] [Google Scholar]
- 6.Lesher D.-T.T., Pommier,Y., Stewart,L. and Redinbo,M.R. (2002) 8-Oxoguanine rearranges the active site of human topoisomerase I. Proc. Natl Acad. Sci. USA, 99, 12102–12107. [DOI] [PMC free article] [PubMed] [Google Scholar]
- 7.Pommier Y., Pourquier,P., Urasaki,Y., Wu,J. and Laco,G.S. (1999) Topoisomerase I inhibitors: selectivity and cellular resistance. Drug Resistance Updates, 2, 307–318. [DOI] [PubMed] [Google Scholar]
- 8.Ozols R.F. (2000) Optimum chemotherapy for ovarian cancer. Int. J. Gynecol. Cancer, 10, 33–37. [DOI] [PubMed] [Google Scholar]
- 9.Saltz L.B., Cox,J.V., Blanke,C., Rosen,L.S., Fehrenbacher,L., Moore,M.J., Maroun,J.A., Ackland,S.P., Locker,P.K., Pirotta,N., Elfring,G.L. and Miller,L.L. (2000) Irinotecan plus fluorouracil and leucovorin for metastatic colorectal cancer. N. Engl. J. Med., 343, 905–914. [DOI] [PubMed] [Google Scholar]
- 10.Castrignanò T., Chillemi,G. and Desideri,A. (2000) Structure and hydration of BamHI DNA recognition site: a molecular dynamics investigation. Biophys. J., 79, 1263–1272. [DOI] [PMC free article] [PubMed] [Google Scholar]
- 11.Cheatham T.E. and Kollman,P.A. (2000) Molecular dynamics simulation of nucleic acids. Annu. Rev. Phys. Chem., 51, 435–471. [DOI] [PubMed] [Google Scholar]
- 12.Norberg J. and Nilsson,L. (2002) Molecular dynamics applied to nucleic acids. Acc. Chem. Res., 35, 465–472. [DOI] [PubMed] [Google Scholar]
- 13.Castrignanò T., Chillemi,G., Varani,G. and Desideri,A. (2002) Molecular dynamics simulation of the RNA complex of a double-stranded RNA-binding domain revels dynamic features of the intermolecular interface and its hydration. Biophys. J., 83, 3542–3552. [DOI] [PMC free article] [PubMed] [Google Scholar]
- 14.Chillemi G., Castrignanò,T. and Desideri,A. (2001) Structure and hydration of the DNA–human topoisomerase I covalent complex. Biophys. J., 81, 490–500. [DOI] [PMC free article] [PubMed] [Google Scholar]
- 15.Reyes C.M. and Kollman,P.A. (1999) Molecular dynamics study of U1A–RNA complexes. RNA, 5, 235–244. [DOI] [PMC free article] [PubMed] [Google Scholar]
- 16.Giudice E. and Lavery,R. (2002) Simulations of nucleic acids and their complexes. Acc. Chem. Res., 35, 350–357. [DOI] [PubMed] [Google Scholar]
- 17.McCammon J.A. and Harvey,S.C. (1987) Dynamics of Proteins and Nucleic Acids. Cambridge University Press, London, UK.
- 18.Garcia. A.E. (1992) Large amplitude nonlinear motions in proteins. Phys. Rev. Lett., 68, 2696–2699. [DOI] [PubMed] [Google Scholar]
- 19.Amadei A., Linssen,A.B.M. and Berendsen,H.J.C. (1993) Essential dynamics of proteins. Proteins, 17, 412–425. [DOI] [PubMed] [Google Scholar]
- 20.Kitao A. and Go,N. (1999) Investigating protein dynamics in collective coordinate space. Curr. Opin. Struct. Biol., 9, 164–169. [DOI] [PubMed] [Google Scholar]
- 21.Berendsen H.J.C. and Hayward,S. (2000) Collective protein dynamics in relation to function. Curr. Opin. Struct. Biol., 10, 165–169. [DOI] [PubMed] [Google Scholar]
- 22.Cornell W.D., Cieplak,P., Bayly,C.I., Gould,I.R., Kenneth,M., Merz,J., Ferguson,D.M., Spellmeyer,D.C., Fox,T., Caldwell,J.W. and Kolman,P.A. (1995) A second generation force field for the simulation of proteins, nucleic acids and organic molecules. J. Am. Chem. Soc., 117, 5179–5197. [Google Scholar]
- 23.Jorgensen W.L., Chandrasekhar,J., Madura,J.D., Impey,R.W. and Klein,M.L. (1983) Comparison of simple potential functions for simulating liquid water. J. Chem. Phys., 79, 926–935. [Google Scholar]
- 24.Darden T., York,D. and Pedersen,L. (1993) Particle mesh Ewald—an N.log(n) method for Ewald sums in large systems. J. Chem. Phys., 98, 10089–10092. [Google Scholar]
- 25.Cheatham T.E., Miller,J.L., Fox,T. Darden,T.A. and Kollman,P.A. (1995) Molecular dynamics simulation on solvated biomolecular systems: the particle mesh Ewald method leads to stable trajectories of DNA, RNA and proteins. J. Am. Chem. Soc., 117, 4193–4194. [Google Scholar]
- 26.Ryckaert J.-P., Ciccotti,G. and Berendsen,H.J.C. (1977) Numerical integration of the Cartesian equations of motion of a system with constraints: molecular dynamics of n-alkanes. J. Comput. Phys., 23, 327–341. [Google Scholar]
- 27.Berendsen H.J.C., Postma,J.P.M., van Gusteren,W.F., Di Nola,A. and Haak,J.R. (1984) Molecular dynamics with coupling to an external bath. J. Comput. Phys., 81, 3684–3690. [Google Scholar]
- 28.Berendsen H.J.C., van der Spoel,D. and van Drunen,R. (1995) GROMACS—a message-passing parallel molecular-dynamics implementation. Comp. Phys. Comm., 95, 43–56. [Google Scholar]
- 29.Humphrey W., Dalke,A. and Shulten,K. (1996) VMD—visual molecular dynamics. J. Mol. Graph., 14, 33–38. [DOI] [PubMed] [Google Scholar]
- 30.Chillemi G., Falconi,M., Amedei,A., Zimatore,G., Desideri,A. and Di Nola,A. (1997) The essential dynamics of Cu, Zn superoxide dismutase: suggestion of intersubunit communication. Biophys. J., 73, 1007–1018. [DOI] [PMC free article] [PubMed] [Google Scholar]
- 31.Falconi M., Stroppolo,M.E., Cioni,P., Strambini,G., Sergi,A., Ferrario,M. and Desideri,A. (2001) Dynamics–function correlation in Cu, Zn superoxide dismutase: a spectroscopic and molecular dynamics simulation study. Biophys. J., 80, 2556–2567. [DOI] [PMC free article] [PubMed] [Google Scholar]
- 32.Redinbo M.R., Champoux,J.J. and Hol,W.G.J. (1999) Structural insights into the function of type IB topoisomerases. Curr. Opin. Struct. Biol., 9, 29–36. [DOI] [PubMed] [Google Scholar]
- 33.Urasaky Y., Laco,G.S., Pourquier,P., Takebayashi,Y., Kohlhagen,G., Gioffre,C., Zhang,H., Chatterjee,D. and Pantazis,P. (2001) Characterization of a novel topoisomerase I mutation from a camptothecin-resistant human prostate cancer cell line. Cancer Res., 61, 1964–1969. [PubMed] [Google Scholar]
- 34.Benedetti P., Fiorani,P., Capuani,L. and Wang,J.C. (1993) Camptothecin resistance from a single mutation changing glycine 363 of human DNA topoisomerase I to cysteine. Cancer Res., 53, 4343–4348. [PubMed] [Google Scholar]
- 35.Rubin E., Pantazis,P., Bharti,A., Toppmeyer,D., Giovannella,B. and Kufe,D. (1994) Identification of a mutant topoisomerase I with intact catalytic activity and resistance to 9-nitro-camptothecin. J. Biol. Chem., 269, 2433–2439. [PubMed] [Google Scholar]
- 36.Li X.G., Haluska,P., Hsiang,Y.-H., Bharti,A.K., Kufe,D.W., Liu,L.F. and Rubin,E.H. (1997) Involvement of amino acids 361 to 364 of human topoisomerase I in camptothecin resistance and enzyme catalysis. Biochem. Pharmacol., 53, 1019–1027. [DOI] [PubMed] [Google Scholar]
- 37.Fiorani P., Amatruda,J.F., Silvestri,A., Butler,R.H., Bjornsti,M.-A. and Benedetti,P. (1999) Domain interactions affecting human DNA topoisomerase I catalysis and camptothecin sensitivity. Mol. Pharmacol., 56, 1105–1115. [DOI] [PubMed] [Google Scholar]
- 38.Bailly C., Carrasco,C., Hamy,F., Vezin,H., Prudhomme,M., Saleem,A. and Rubin,E. (1999) The camptothecin-resistant topoisomerase I mutant F361S is cross-resistant to antitumor rebeccamycin derivatives. A model for topoisomerase I inhibition by indolocarbazoles. Biochemistry, 38, 8605–8611. [DOI] [PubMed] [Google Scholar]
- 39.Saleem A., Ibrahim,N., Patel,M., Li,X.G., Gupta,E., Mendoza,J., Pantazis,P. and Rubin,E.H. (1997) Mechanisms of resistance in a human cell line exposed to sequential topoisomerase poisoning. Cancer Res., 57, 5100–5106. [PubMed] [Google Scholar]
- 40.Tamura H., Kohchi,C., Yamada,R., Ikeda,T., Koiwai,O., Patterson,E., Keene,J.D., Okada,K., Kjeldsen,E., Nishikawa,K. and Andoh,T. (1991) Molecular cloning of a cDNA of a camptothecin-resistant human DNA topoisomerase I and identification of mutation sites. Nucleic Acids Res., 19, 69–75. [DOI] [PMC free article] [PubMed] [Google Scholar]
- 41.Van der Spoel D. and Berendsen,H.J.C. (1997) Molecular dynamics simulations of Leu-Enkephalin in water and DMSO. Biophys. J., 72, 2032–2041. [DOI] [PMC free article] [PubMed] [Google Scholar]
- 42.Berman H.M., Westbrook,J., Feng,Z., Gilliland,G., Bhat,T.N., Weissig,H., Shindyalov,I.N. and Bourne,P.E. (2000) The Protein Data Bank. Nucleic Acids Res., 28, 235–242. [DOI] [PMC free article] [PubMed] [Google Scholar]
- 43.Laco G.S., Collins,J.R., Luke,B.T., Kroth,H., Sayer,J.M., Jerina,D.M. and Pommier,Y. (2002) Human topoisomerase I inhibition: docking camptothecin and derivatives into a structure-based active site model. Biochemistry, 41, 1428–1435. [DOI] [PubMed] [Google Scholar]
- 44.Staker B.L., Hjerrild,K., Feese,M.D., Behnke,C.A., Burgin,A.B. and Stewart,L. (2002) The mechanism of topoisomerase I poisoning by a camptothecin analog. Proc. Natl Acad. Sci. USA, 99, 15387–15392. [DOI] [PMC free article] [PubMed] [Google Scholar]
- 45.Arcangeli C., Bizzarri,A.R. and Cannistraro,S. (2001) Concerted motions in copper plastocyanin and azurin: an essential dynamics study. Biophys. Chem., 90, 45–56. [DOI] [PubMed] [Google Scholar]


