Abstract
Microarrays of oligonucleotide expression libraries can be hybridised with either cDNA, generated from mRNA during reverse transcription, or cRNA, generated in an Eberwine mRNA amplification procedure. While methods for fluorescent labelling of cDNA have been thoroughly investigated, methods for cRNA labelling have not. To this purpose, we developed an aminoallyl-UTP (aa-UTP) driven cRNA labelling protocol and compared it in expression profiling studies using spotted 7.5 K 65mer murine oligonucleotide arrays with labelling via direct incorporation of Cy-UTPs. The presence of dimethylsulfoxide during coupling of aa-modified cRNA with N-hydroxysuccinimide-modified, fluorescent Cy dyes greatly enhanced the labelling efficiency, as analysed by spectrophotometry and fluorescent hybridisation signals. Indirect labelling using aa-UTP resulted in 2- to 3-fold higher degrees of labelling and fluorescent signals than labelling by direct incorporation of Cy-UTP. By variation of the aa-UTP:UTP ratio, a clear optimal degree of labelling was found (1 dye per 20–25 nt). Incorporation of more label increased Cy3 signal but lowered Cy5 fluorescence. This effect is probably due to quenching, which is more prominent for Cy5 than for Cy3. In conclusion, the currently developed method is an efficient, robust and inexpensive technique for fluorescent labelling of cRNA and allows sensitive detection of gene expression profiles on oligonucleotide microarrays.
INTRODUCTION
DNA arrays have evolved into widely used tools for comprehensive analysis of gene expression (1–3). Both high-density oligonucleotide chips produced by photochemolithography (Affymetrix platform) and spotted cDNA microarrays have produced an overwhelming amount of biological information (see, for example, 4–6). Oligonucleotide chips have certain advantages over cDNA microarrays: cross-hybridisation is avoided and quality control by sequence validation of PCR clones is not required (2,7). Due to the high expenses associated with the use of high-density oligonucleotide chips, this platform is not accessible for every laboratory. Spotted microarrays of longer oligonucleotides (50mers– 70mers) are becoming an attractive, alternative platform (8). Oligonucleotide libraries covering large parts of the transcriptome of several organisms are now available from different companies. The longer oligonucleotides have higher sequence specificity than the shorter oligonucleotides on high-density chips, which means that one probe per gene generally suffices. In addition, spotted oligonucleotide arrays, like cDNA arrays, are flexible, allowing the user to create arrays which are tailored for a specific biological question. Apart from their use in expression profiling, spotted oligonucleotide microarrays have also been successfully applied for validation of exon predictions and mutation detection (9,10).
As commercially available oligonucleotide expression libraries are in the sense orientation, only first strand labelled cDNA, synthesised from total RNA or poly(A)+ RNA, and labelled antisense cRNA, synthesised from double-stranded cDNA during in vitro transcription with T7 RNA polymerase, can be used for hybridisation to current oligonucleotide expression microarrays. The latter routine, also referred to as the Eberwine procedure (11), includes an amplification step, which has been shown to retain information on transcript abundance (12–14), and is especially useful when the amount of RNA available for gene expression profiling is limited.
First strand cDNA fluorescent labelling protocols have been optimised to achieve higher sensitivity and lower variability (15,16). Several researchers have compared cDNA labelling by direct incorporation of Cy3- or Cy5-modified nucleotides with labelling via incorporation of 5-(3-aminoallyl)-dUTP (aa-dUTP) and subsequent coupling of the aa-modified cDNA to Cy3 or Cy5 dyes provided with N-hydroxysuccinimide ester moieties (15–17). Aminoallyl labelling has been shown to result in higher labelling efficiency and consistency, at reduced cost. Labelling methods for cRNA have not been described. In the present study, we explored a new protocol for fluorescent labelling of cRNA through incorporation of aa-UTP during in vitro transcription.
MATERIALS AND METHODS
Preparation of glass oligonucleotide microarrays
Oligonucleotide microarrays were produced in the Leiden Genome Technology Center. Oligonucleotides from the Sigma-Genosys mouse 7.5 K oligonucleotide library (65mer with 5′-hexylaminolinker, 500 pmol in Genetix X6004 384-well plates) were dissolved in 12.5 µl of Millipore water (pH ∼ 8) by rocking on a platform for 30 min at room temperature. Subsequently, an equal volume of dimethylsulfoxide (DMSO) was added. The final oligonucleotide concentration was 20 µM in 50% DMSO. Plates were again incubated on a rocking platform for 30 min and stored at –20°C. Ambion’s ArrayControl oligos (eight sense oligos) and bacterial control oligos (nine sense and nine antisense oligos) were spotted together with the Sigma mouse 7.5 K library, in duplicate, on poly-l-lysine (Sigma)-coated glass slides (cut edges, 3 × 1 inch; Menzel). Cleaning and coating of the slides was performed as described previously (http://cmgm.stanford.edu/pbrown/) (18). Oligos were spotted in duplicate with an Omnigrid 100® microarrayer (Genemachines) supplied with 24 SMP 3 Microspotting pins (Telechem). Control stainings with SYBR-Green II (Molecular Probes) indicated that the amount of deposited oligonucleotide was highly reproducible between slides.
Prehybridisation of oligonucleotide glass arrays
Slide prehybridisation was done as described for cDNA micorarrays (19). However, oligonucleotides were cross-linked by UV irradiation (Stratalinker Model 1800 UV Illuminator; Stratagene) at higher energy than described for cDNAs. Throughout this study, the applied cross-linking energy was 600 mJ/cm2. Later experiments indicated that 250 mJ/cm2 may be slightly better because of a lower background of empty spots.
Isolation, amplification and labelling of RNA
Mouse heart total RNA was isolated with RNA Bee (Campro Scientific) and purified on RNeasy Mini columns (Qiagen) after on-column DNase I treatment (RNase-free DNase set; Qiagen). The quality of the RNA was checked with Agilent’s Lab-on-a-Chip total RNA nano biosizing assay. Total RNA (2 µg) was supplied with Ambion’s ArrayControl RNA spikes (amounts per spike varying from 0–200 pg) and in vitro synthesised polyadenylated Bacillus subtilis T3 RNA spikes (prepared as described in chapter 4 of the Affymetrix GeneChip® Technical Manual; amounts per spike varying from 0–400 pg) and amplified according to the Eberwine procedure (11) using Ambion’s MessageAmp™ kit. During in vitro transcription (9 h, 37°C), either Cy3- or Cy5-labelled UTPs (NEN) (ratio Cy-UTP:UTP = 1:9) or aa-UTP (Ambion) were incorporated. Different aa-UTP:UTP ratios were applied, but the total concentration of UTP and other NTPs in the reaction was always 7.5 mM. Aminoallyl-modified nucleotides were coupled with Amersham’s monoreactive Cy3 and Cy5 dyes. To this end, one vial of monoreactive dyes was dissolved in 40 µl of dry DMSO and divided into aliquots of 2 µl, which were immediately vacuum dried. To 2 µg of aa-modified cRNA in 3.33 µl of diethylpyrocarbonate-treated water, 5 µl of DMSO and 1.66 µl of 0.3 M sodium bicarbonate buffer, pH 9.0, was added. Immediately after addition of bicarbonate buffer, the cRNA was transferred to the vacuum dried dyes. The dyes were resuspended by repeated pipetting and the coupling reaction was allowed to continue for 1 h at room temperature in the dark. To quench non-reacting dye molecules, 4.5 µl of 4 M hydroxylamine (Sigma) solution was added to the mixture. After 15 min, the mixtures were applied to Microcon-YM30 columns and washed three times with 500 µl of TE (10 mM Tris–HCl, 1 mM EDTA, pH 8.0). Subsequently, the labelled cRNA was collected in 3–10 µl of TE and TE was added up to 40 µl. Ten microlitres was used for determination of the UV-VIS absorption spectrum (200– 700 nm) on an Ultrospec 2100 pro UV-VIS spectrophotometer (Amersham). To calculate the degree of labelling the following extinction coefficients were used: RNA, ε260 = 8250; Cy3, ε550 = 150 000 (correction factor A260/A550 = 0.08); Cy5, ε650 = 250 000 (correction factor A260/A650 = 0.05). Thirty microlitres was used for hybridisation.
Hybridisation of glass oligonucleotide microarrays
Hybridisation of oligonucleotide microarrays was done as described for cDNA arrays (http://cmgm.stanford.edu/pbrown/) (18) with some modifications. The hybridisation mix was prepared by adding TE to the combined Cy3- and Cy5-labelled cRNAs to a total volume of 80 µl, and subsequent addition of 2 µl of yeast tRNA and 2 µl of poly(A)+ RNA (both 10 µg/µl), 17 µl of 20× SSC and 3 µl of 10% (w/v) SDS. The hybridisation solution was heated for 2 min at 95°C, cooled to room temperature and centrifuged for 10 min at 16 000 g in an Eppendorf centrifuge. Slides were hybridised in a GeneTAC hybridisation station (Genomic Solutions). Slides were preheated for 5 min at 55°C prior to hybridisation at 55°C for 14–16 h. After hybridisation, each slide was washed in the hybridisation station with 2× SSC, 0.1% SDS for five cycles at 30°C, 1× SSC for five cycles at 30°C. Each cycle lasted 1 min and comprised 20 s flow time and 40 s hold. Slides were dehydrated by short incubation in 70, 90 and 100% ethanol, respectively.
Scanning, feature extraction and analysis
Slides were scanned in an Agilent G2565BA microarray scanner. Photomultiplier tube voltage was always set at 100% for both the red and green channels. The resulting images were split into red and green. Red and green images were overlaid using ScanAlyze (M. Eisen). Feature extraction was done with GenePix Pro 3.0 (Axon Instruments Inc.) software. Spots with high local background or aberrant spot shape were flagged by the software and checked manually. For each slide, the global background was subtracted from the signal intensities. The global background was calculated for the red and green channels separately by averaging the signal intensities from 332 empty spots, which were spread over the array and where only spot buffer was deposited, and adding twice the standard deviation. The signal intensities from antisense control oligonucleotide spots were always below this background threshold, indicating that cross-hybridisation was negligible. The reproducibility of labellings and hybridisations was assessed by calculating the standard deviation in signal intensities of individual spots across four replicate arrays. This was, on average, 0.4 log units, corresponding to a 1.5-fold difference in absolute signal intensities on different arrays.
To calculate the number of spots which could be reproducibly measured in the self–self hybridisations (‘consistently present’ calls), we used the following filtering algorithm: (i) flagged spots and spots with negative background-corrected signal intensities in either one or both channels were discarded; (ii) background-corrected signal intensities were log transformed (natural logarithm) and normalised by setting the average ln(red/green) to 0; (iii) spots with |ln(red/green)| ≥ 0.4 (corresponding to a >1.5-fold difference in red and green signal intensities) were discarded.
Data analysis
Data were analysed with Microsoft Excel 2000, SPSS, version 10.0.7, and Spotfire Decision site 7.0.
RESULTS
Spectrophotometric determination of labelling degrees
Gene expression profiling in amplified RNA samples using oligonucleotide arrays calls for efficient and consistent cRNA labelling methods. We explored and optimised cRNA labelling by incorporation of aa-UTPs during RNA amplification and compared this labelling method with cRNA labelling by direct incorporation of Cy3- or Cy5-modified UTPs, as has described before (20).
As in some, but not all, published protocols for aa-mediated labelling of cDNA variable concentrations of DMSO were used (15–17), the effect of the presence of DMSO during cRNA labelling was investigated. We found that the presence of 50% DMSO in the coupling reaction of aa-modified cRNA with Cy3 or Cy5 monoreactive dyes increased the labelling efficiency 4-fold, as determined through spectrophotometric determination of A550/A260 and A650/A260 ratios, respectively (not shown). Therefore, all our subsequent coupling reactions were done in sodium bicarbonate buffer, pH 9.0, including 50% DMSO.
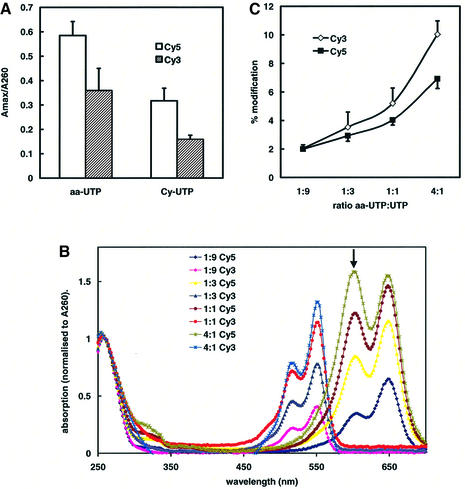
We then compared indirect aa-UTP-mediated cRNA labelling with direct Cy-UTP-mediated labelling at an identical ratio of modified UTP over normal UTP of 1:9. The length of the synthesised cRNA products, as determined in a mRNA biosizing assay, was not significantly affected by the addition of Cy-UTP or aa-UTP, and was similar to that of non-modified cRNA (500–2000 nt; data not shown). Spectrophotometric determination of the amounts of incorporated fluorescent label indicated that the degree of labelling using aa-UTP was 2-fold higher than using Cy-UTPs (Fig. 1A). Although with both methods the absorption of the Cy5-labelled product was higher than that of the Cy3-labelled product, the modification degree was similar, since the extinction coefficient of Cy5 is 1.7 times greater.
Figure 1.
Spectrophotometric determination of labelling degrees. Wavelength scans were recorded from cRNA, which was labelled by direct incorporation of Cy3-UTP or Cy5-UTP or by incorporation of aa-UTP and subsequent coupling to Cy3 or Cy5 monoreactive dyes. (A) The ratios A550:A260 (Cy3, hatched bars) and A650:A260 (Cy5, open bars) are plotted for Cy-UTP- and aa-UTP-labelled cRNA (Cy-UTP:UTP = aa-UTP:UTP = 1:9). Mean values ± SEM of four separate in vitro transcription reactions are shown. (B) Wavelength scans from cRNA labelled at the indicated ratios of aa-UTP:UTP are displayed. The absorption values were normalised with respect to the absorption at 260 nm (averages of two independent in vitro transcription reactions are shown). (C) The percentage of Cy3-modified (open diamonds) and Cy5-modified (closed squares) nucleotides in cRNA, labelled after incorporation of the indicated ratios of aa-UTP:UTP, were calculated from the absorption spectra. Mean values ± SEM of three to six separate in vitro transcription reactions are shown.
The labelling degree of cRNA could further be improved by increasing the aa-UTP:UTP ratio in the in vitro transcription reaction (Fig. 1B and C). The degree of modification increased from 1 dye molecule per ∼50 nt (aa-UTP:UTP = 1:9) to 1 dye molecule per ∼12 nt (aa-UTP:UTP = 4:1). The increase was, however, not completely proportional to the relative amount of aa-UTP added. For Cy5, we observed that the ratio of the absorption from the peaks at 600 and 650 nm increased at higher aa-UTP:UTP ratios. The peak at 600 nm (marked in Fig. 1B) is derived from a non-fluorescent state of Cy5 and has been shown earlier to be associated with quenching of Cy5 dye molecules that are in close proximity (21).
Effect of labelling degree on signals in cRNA hybridisations
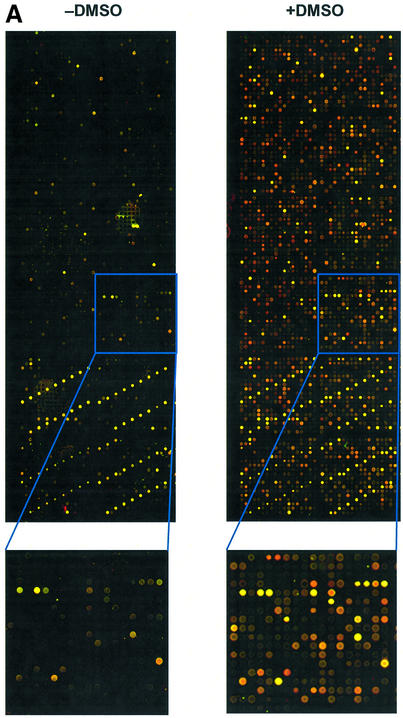
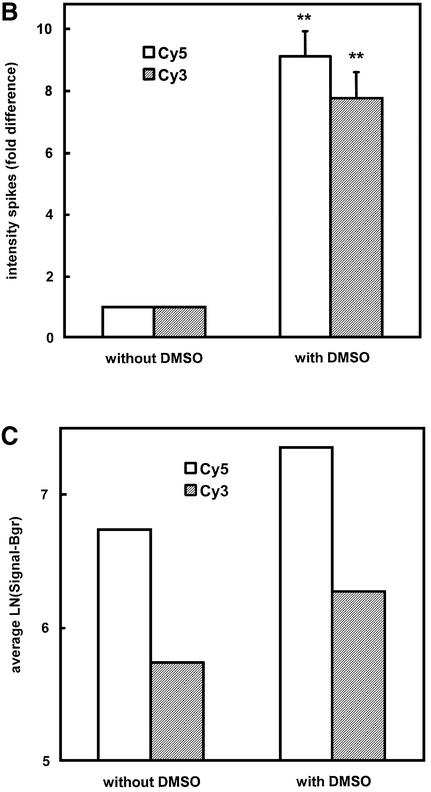
To evaluate whether higher degrees of labelling translate into improved signals in microarray hybridisations, we hybridised differentially labelled mouse heart cRNA to home-made mouse 7.5 K 65mer oligonucleotide glass arrays in a self-to-self fashion. In accordance with the observed increase in labelling degree, the presence of DMSO during the coupling of aa-UTP-modified cRNA to monoreactive dyes resulted in a dramatic increase in signal (Fig. 2A). The signal intensities from the control oligonucleotide spots that detect the spiked RNA transcripts were found to be elevated 7.5- to 9-fold by the addition of DMSO during labelling (Fig. 2B). The signal intensity in the mouse oligonucleotide spots was increased by approximately the same factor. The improved labelling procedure also increased the number of spots that could be detected. Since different labelling procedures may not only lead to differences in signal intensity but also to differences in variability of detected signals, we did not only rely on the number of ‘present’ calls, i.e. spots with signal above the background threshold, but applied an additional criterion. Only those spots for which the normalised red and green signals did not differ by more than a factor of 1.5 in the self-to-self hybridisation were regarded as ‘consistently present’. The number of ‘consistently present’ calls increased from 2.8 × 10³ (19%) in cRNA labelled in the absence of DMSO to 5.4 × 10³ (36%) in cRNA labelled in the presence of DMSO. Despite the huge increase in the number of low abundant transcripts that could be detected, the average signal of all ‘consistently present’ mouse oligonucleotide spots was still higher in cRNA that was labelled in the presence of DMSO (Fig. 2C). The correlation of natural log transformed signal intensities in the Cy5/Cy3 plots was also improved by the addition of DMSO (r2 = 0.93–0.98 in the presence of DMSO versus 0.90–0.92 in the absence of DMSO; not shown).
Figure 2.
Effect of presence of DMSO during labelling of aa-UTP-modified cRNA on hybridisation intensities. Total heart cRNA was spiked with polyadenylated bacterial spikes and Ambion ArrayControl spikes and subsequently amplified and labelled as described in Materials and Methods (aa-UTP:UTP = 1:1). (A) Representative images of identical quarters and blocks (inset) of oligonucleotide arrays hybridised with cRNA, coupled to monoreactive dyes in the absence or presence of DMSO, are shown. Identical gains were used to generate the images. (B) For each consistently measured spike, the average signal intensity in the red (open bars) and green channels (hatched bars) of the spikes, labelled in the presence of DMSO, was expressed relative to the average signal intensity in the spikes, labelled in the absence of DMSO. Averages ± SEM of six different spikes in two separate hybridisations are shown. **P < 0.001 (one-sample Student’s t-test in SPSS). (C) Average ln transformed signal intensities (corrected for background) were calculated for ‘consistently present’ mouse oligo spots (mean of two separate hybridisations).
Fragmentation of the cRNA is common practice for hybridisation on short oligonucleotide arrays (e.g. Affymetrix chips). We investigated the effect of fragmentation after labelling of the cRNA, according to the Affymetrix procedure, on signal intensities. There was no significant difference between average signals from fragmented cRNA (40–200 nt) and signals from intact cRNA (500–2000 nt) on longer oligonucleotide microarrays: ln(Cy5 fragmented/Cy5 unfragmented) = 0.4 ± 0.9; ln(Cy3 fragmented/Cy3 unfragmented) = 0.2 ± 1.1. The large standard deviation indicates that the effect of fragmentation on signal intensity is highly dependent on the gene and oligonucleotide sequence. As the variation in Cy5:Cy3 ratios seems to be higher in fragmented cRNA than in unfragmented cRNA and fragmentation introduces an extra source of variation, we advise not to fragment cRNA when hybridising on longer oligonucleotide microarrays.
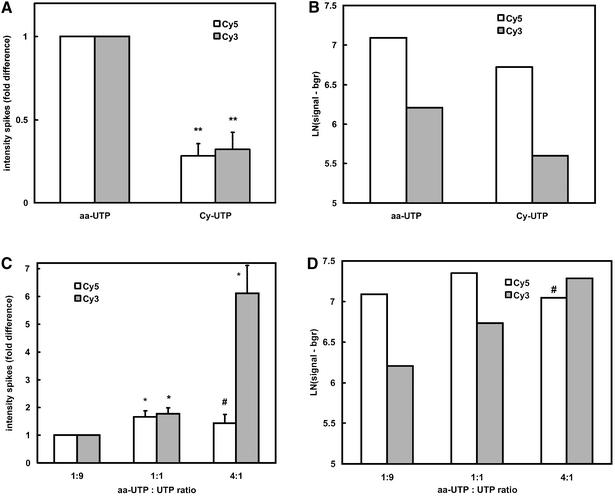
To determine the effect of the labelling method on hybridisation signals, the signal intensities from cRNA that was labelled via aa-UTP or via Cy-UTP at identical ratios of modified UTP over UTP, were compared (Fig. 3A and B). In agreement with the higher labelling degree of aa-UTP-labelled cRNA, the signal intensities (corrected for background) from aa-UTP-labelled cRNA in both the control (spiked RNAs) and the mouse oligonucleotide spots were 2- to 3-fold higher than the signal intensities from Cy-UTP-labelled cRNA. Due to the somewhat lower variation in background levels on slides with Cy-UTP-labelled cRNA, we could not find a significant difference in the number of ‘consistently present’ calls [3.1 × 10³ (21%) for both labelling methods]. The reproducibility of the two labelling methods was comparable, since the correlation coefficient (r2) for two independently amplified samples in ln(Cy5) versus ln(Cy3) plots was between 0.85 and 0.89 for both methods. With both labelling methods the signal in the red channel was higher than the signal in the green channel (at identical photomultiplier settings). This is probably due to the higher quantum yield of the Cy5 fluorophore (21).
Figure 3.
Effect of labelling degree on hybridisation intensities. Mouse heart cRNA was labelled by incorporation of Cy-UTP or aa-UTP and hybridised to a home-made mouse 7.5 K 65mer oligonucleotide glass array. (A and B) A comparison of (background-corrected) signal intensities from the ‘consistently present’ spikes and mouse oligonucleotide spots, respectively, after Cy-UTP and aa-UTP labelling of cRNA (both at a 1:9 ratio). (C and D) A comparison of signal intensities from the ‘consistently present’ spike control and mouse oligonucleotide spots, respectively, in aa-labelled cRNAs after incorporation of different ratios of aa-UTP:UTP. (A and C) Relative median signal intensities (corrected for background) of the different spikes were calculated by setting the average intensities in the red (open bars) and green (hatched bars) channels in the 1:9 aa-UTP-labelled cRNA to 1. Averages ± SEM of five different spikes in two to three separate hybridisations are shown. *P < 0.05; **P < 0.005 (one-sample Student’s t-test in SPSS). (B and D) Average ln transformed signal intensities (corrected for background) were calculated for ‘consistently present’ mouse oligo spots (mean of two to three separate hybridisations). #: Cy5 signal is reduced despite higher label incorporation, most probably due to quenching of proximal dye molecules.
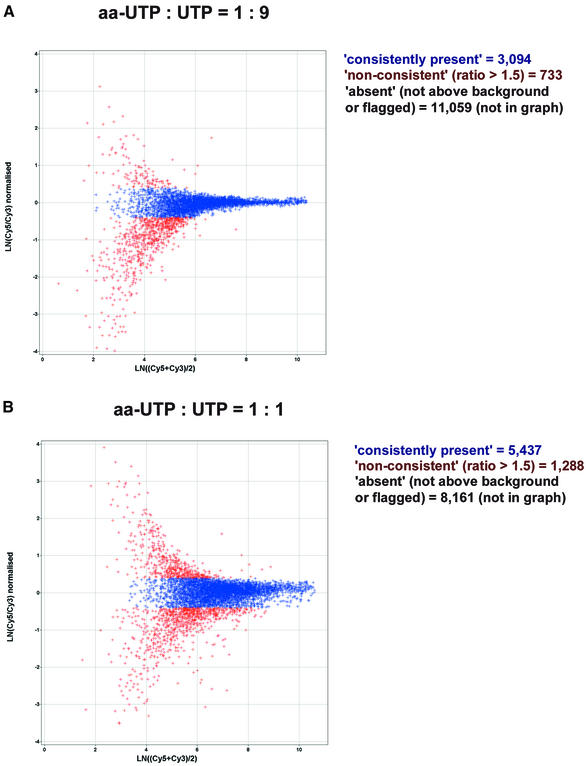
The labelling degree of cRNA molecules could be modulated by variation of aa-UTP:UTP ratios in the in vitro transcription reaction (Fig. 1). After hybridisation, we saw a 1.4- to 1.7-fold increase in the signal intensities from control (spikes) and mouse oligonucleotide spots when comparing aa-UTP:UTP ratios of 1:9 and 1:1 (Fig. 3C and D). Also the number of ‘consistently present’ calls increased from, on average, 3.1 × 10³ (21% of all spots) to 5.4 × 10³ (36% of all spots) (Fig. 4). The increase in the number of ‘consistently present’ calls at higher aa-UTP:UTP ratios was despite the slightly higher variability in ratios (Fig. 4).
Figure 4.
MA plots for hybridisations of cRNA labelled at different aa-UTP:UTP ratios. Total RNA from mouse heart was amplified and labelled by incorporation of the indicated ratios of aa-UTP:UTP. Flagged spots and spots with intensities lower than the background threshold were discarded (‘absent’ spots). For all other spots, the natural logarithm of the normalised ratios of Cy5 and Cy3 (background-corrected) signal intensities are plotted against the average ln transformed signal in the Cy5 and Cy3 channels. Spots for which Cy5 and Cy3 signal intensities differ by not more than a factors of 1.5 are called ‘consistently present’ and are indicated in blue. Other spots are considered ‘non-consistent’ and are indicated in red. The plots are representative of a set of three hybridisations. The numbers of ‘absent’, ‘non-consistent’ and ‘consistently present’ calls for the representative hybridisations are indicated.
At the higher aa-UTP:UTP ratio of 4:1, the signal from control and mouse oligonucleotide spots in the Cy3 channel increased even more (Fig. 3C and D). However, the signal in the Cy5 channel decreased when compared to an aa-UTP:UTP ratio of 1:1, despite the higher labelling degree. This is likely to be caused by quenching of Cy5 dyes. The number of spots which could consistently be measured was not significantly different between aa-UTP:UTP ratios of 1:1 and 4:1.
DISCUSSION
In the present study, we optimised the fluorescent labelling of cRNA for hybridisation on spotted oligonucleotide microarrays. It was calculated from the absorption spectra that incorporation of aa-UTPs during in vitro transcription and subsequent coupling to Cy3 or Cy5 monoreactive dyes resulted in a 2-fold higher degree of labelling than direct incorporation of Cy-modified UTPs. This implies that aa-UTPs are more efficiently incorporated by T7 RNA polymerase than Cy-UTPs. This was expected since the bulky Cy moieties will be accommodated less easily than the small aminoallyl moieties. Next to the higher labelling efficiency, aa-UTP-mediated labelling of cRNA is at least 8 times less expensive. An additional reduction in cost is achieved in dye swap experiments, since one in vitro aa-UTP amplification reaction per sample suffices, whereas two independent amplifications have to be performed when incorporating Cy-modified UTPs.
So far, we could only find one report in which cRNA was labelled by incorporation of aa-UTPs (8). In this publication no DMSO was added during coupling with Cy dyes. We found that DMSO was required to achieve efficient coupling of aa-modified cRNA but not of aa-modified cDNA with Cy dyes. At present, we have no explanation for the differential effect of DMSO in cRNA and cDNA aminoallyl labelling.
The degree of labelling could be manipulated by varying the aa-UTP:UTP ratio in the in vitro transcription reaction. An important finding in our study is that a higher labelling degree does not necessarily result in higher fluorescent signals from hybridised cRNA. This can probably be attributed to quenching effects. In a protein labelling study, quenching has been shown to be prominent for Cy5 at higher labelling degrees, whereas, in contrast, fluorescence of Cy3 dyes is still increasing at these higher labelling degrees (21). This corresponds very well with our data on cRNA labelling. In the absorption spectrum of Cy5-labelled cRNA, the ‘quenching’ peak at 600 nm was prominently present at higher labelling degrees. Concordantly, we observed in cRNA hybridisations that the Cy5 signal decreased at higher labelling degrees, whereas the Cy3 signal continued to increase. Quenching of proximal dye molecules may also introduce an extra source of variation, which accounts for the observed increase in variation of Cy5:Cy3 ratios at higher labelling degrees. Our hybridisation results suggest that an aa-UTP:UTP ratio of 1:1 is optimal for fluorescent labelling of cRNA, which is comparable to the initially suggested 2:3 aa-dUTP:dUTP ratio for cDNA labelling (16,17). We calculated from the absorption spectra that this corresponds to an incorporation of 1 dye molecule per 20–25 nt. Protocols which use considerably higher ratios of aa-dUTP:dUTP have appeared on the Internet. Labelling at higher aa-(d)UTP:(d)UTP may prove useful to increase the signal from Cy3, but will probably compromise detection of the Cy5 signal and affect ratio measurements. When higher sensitivity is required, substitution of Cy5 dyes with fluorescent dyes that are less susceptible to quenching may be rewarding.
In conclusion, we have shown that incorporation of aa-UTP and subsequent coupling to monoreactive Cy3 and Cy5 dyes in the presence of DMSO is an efficient and cost-effective method for fluorescent labelling of cRNA. With the currently developed methods for mRNA amplification and cRNA labelling, spotted oligonucleotide microarrays have become an attractive platform for gene expression profiling of samples with small amounts of RNA.
Acknowledgments
ACKNOWLEDGEMENTS
This research was financially supported by the Dutch Ministry of Economic Affairs (contract BTS01002). The authors wish to thank Judith Boer, Ellen Sterrenburg, Rolf Turk (Human Genetics, Leiden University Medical Center) and Prof. Ton Raap (Molecular Cell Biology, Leiden University Medical Center) for their critical comments on the manuscript.
REFERENCES
- 1.Brown P.O. and Botstein,D. (1999) Exploring the new world of the genome with DNA microarrays. Nature Genet., 21, 33–37. [DOI] [PubMed] [Google Scholar]
- 2.Lockhart D.J. and Winzeler,E.A. (2000) Genomics, gene expression and DNA arrays. Nature, 405, 827–836. [DOI] [PubMed] [Google Scholar]
- 3.Noordewier M.O. and Warren,P.V. (2001) Gene expression microarrays and the integration of biological knowledge. Trends Biotechnol., 19, 412–415. [DOI] [PubMed] [Google Scholar]
- 4.Lockhart D.J., Dong,H., Byrne,M.C., Follettie,M.T., Gallo,M.V., Chee,M.S., Mittmann,M., Wang,C., Kobayashi,M., Horton,H. et al. (1996) Expression monitoring by hybridization to high-density oligonucleotide arrays. Nat. Biotechnol., 14, 1675–1680. [DOI] [PubMed] [Google Scholar]
- 5.Perou C.M., Sorlie,T., Eisen,M.B., van de Rijn,R.M., Jeffrey,S.S., Rees,C.A., Pollack,J.R., Ross,D.T., Johnsen,H., Akslen,L.A. et al. (2000) Molecular portraits of human breast tumours. Nature, 406, 747–752. [DOI] [PubMed] [Google Scholar]
- 6.Arbeitman M.N., Furlong,E.E., Imam,F., Johnson,E., Null,B.H., Baker,B.S., Krasnow,M.A., Scott,M.P., Davis,R.W. and White,K.P. (2002) Gene expression during the life cycle of Drosophila melanogaster. Science, 297, 2270–2275. [DOI] [PubMed] [Google Scholar]
- 7.Kane M.D., Jatkoe,T.A., Stumpf,C.R., Lu,J., Thomas,J.D. and Madore,S.J. (2000) Assessment of the sensitivity and specificity of oligonucleotide (50mer) microarrays. Nucleic Acids Res., 28, 4552–4557. [DOI] [PMC free article] [PubMed] [Google Scholar]
- 8.Hughes T.R., Mao,M., Jones,A.R., Burchard,J., Marton,M.J., Shannon,K.W., Lefkowitz,S.M., Ziman,M., Schelter,J.M., Meyer,M.R. et al. (2001) Expression profiling using microarrays fabricated by an ink-jet oligonucleotide synthesizer. Nat. Biotechnol., 19, 342–347. [DOI] [PubMed] [Google Scholar]
- 9.Okamoto T., Suzuki,T. and Yamamoto,N. (2000) Microarray fabrication with covalent attachment of DNA using bubble jet technology. Nat. Biotechnol., 18, 438–441. [DOI] [PubMed] [Google Scholar]
- 10.Shoemaker D.D., Schadt,E.E., Armour,C.D., He,Y.D., Garrett-Engele,P., McDonagh,P.D., Loerch,P.M., Leonardson,A., Lum,P.Y., Cavet,G. et al. (2001) Experimental annotation of the human genome using microarray technology. Nature, 409, 922–927. [DOI] [PubMed] [Google Scholar]
- 11.Van Gelder R.N., von Zastrow,M.E., Yool,A., Dement,W.C., Barchas,J.D. and Eberwine,J.H. (1990) Amplified RNA synthesized from limited quantities of heterogeneous cDNA. Proc. Natl Acad. Sci. USA, 87, 1663–1667. [DOI] [PMC free article] [PubMed] [Google Scholar]
- 12.Baugh L.R., Hill,A.A., Brown,E.L. and Hunter,C.P. (2001) Quantitative analysis of mRNA amplification by in vitro transcription. Nucleic Acids Res., 29, e29. [DOI] [PMC free article] [PubMed] [Google Scholar]
- 13.Wang E., Miller,L.D., Ohnmacht,G.A., Liu,E.T. and Marincola,F.M. (2000) High-fidelity mRNA amplification for gene profiling. Nat. Biotechnol., 18, 457–459. [DOI] [PubMed] [Google Scholar]
- 14.Iscove N.N., Barbara,M., Gu,M., Gibson,M., Modi,C. and Winegarden,N. (2002) Representation is faithfully preserved in global cDNA amplified exponentially from sub-picogram quantities of mRNA. Nat. Biotechnol., 20, 940–943. [DOI] [PubMed] [Google Scholar]
- 15.Richter A., Schwager,C., Hentze,S., Ansorge,W., Hentze,M.W. and Muckenthaler,M. (2002) Comparison of fluorescent tag DNA labeling methods used for expression analysis by DNA microarrays. Biotechniques, 33, 620–628, 630. [DOI] [PubMed] [Google Scholar]
- 16.Yu J., Othman,M.I., Farjo,R., Zareparsi,S., MacNee,S.P., Yoshida,S. and Swaroop,A. (2002) Evaluation and optimization of procedures for target labeling and hybridization of cDNA microarrays. Mol. Vis., 8, 130–137. [PubMed] [Google Scholar]
- 17.Xiang C.C., Kozhich,O.A., Chen,M., Inman,J.M., Phan,Q.N., Chen,Y. and Brownstein,M.J. (2002) Amine-modified random primers to label probes for DNA microarrays. Nat. Biotechnol., 20, 738–742. [DOI] [PubMed] [Google Scholar]
- 18.DeRisi J.L., Iyer,V.R. and Brown,P.O. (1997) Exploring the metabolic and genetic control of gene expression on a genomic scale. Science, 278, 680–686. [DOI] [PubMed] [Google Scholar]
- 19.Sterrenburg P.J.E., Turk,R.T., Boer,J.M., van Ommen,G.B. and den Dunnen,J.T. (2002) A common reference for cDNA microarray hybridizations. Nucleic Acids Res., 30, e116. [DOI] [PMC free article] [PubMed] [Google Scholar]
- 20.Relogio A., Schwager,C., Richter,A., Ansorge,W. and Valcarcel,J. (2002) Optimization of oligonucleotide-based DNA microarrays. Nucleic Acids Res., 30, e51. [DOI] [PMC free article] [PubMed] [Google Scholar]
- 21.Gruber H.J., Hahn,C.D., Kada,G., Riener,C.K., Harms,G.S., Ahrer,W., Dax,T.G. and Knaus,H.G. (2000) Anomalous fluorescence enhancement of Cy3 and Cy3.5 versus anomalous fluorescence loss of Cy5 and Cy7 upon covalent linking to IgG and noncovalent binding to avidin. Bioconjugate Chem., 11, 696–704. [DOI] [PubMed] [Google Scholar]


