


Abstract
The presence of restriction enzymes in bacterial cells has been predicted by either classical phage restriction-modification (R-M) tests, direct in vitro enzyme assays or more recently from bacterial genome sequence analysis. We have applied phage R-M test principles to the transformation of plasmid DNA and established a plasmid R-M test. To validate this test, six plasmids that contain BamHI fragments of phage lambda DNA were constructed and transformed into Escherichia coli strains containing known R-M systems including: type I (EcoBI, EcoAI, Eco124I), type II (HindIII) and type III (EcoP1I). Plasmid DNA with a single recognition site showed a reduction of relative efficiency of transformation (EOT = 10–1–10–2). When multiple recognition sites were present, greater reductions in EOT values were observed. Once established in the cell, the plasmids were subjected to modification (EOT = 1.0). We applied this test to screen E.coli clinical strains and detected the presence of restriction enzymes in 93% (14/15) of cells. Using additional subclones and the computer program, RM Search, we identified four new restriction enzymes, Eco377I, Eco585I, Eco646I and Eco777I, along with their recognition sequences, GGA(8N)ATGC, GCC(6N)TGCG, CCA(7N)CTTC, and GGA(6N)TATC, respectively. Eco1158I, an isoschizomer of EcoBI, was also found in this study.
INTRODUCTION
Phage DNA containing a recognition sequence for a host restriction endonuclease is subject to cleavage, which is revealed by an efficiency of plating (EOP) equal to 10–2–10–5 (1). Surviving phages, modified by the host methyltransferase, are protected from restriction and have an EOP close to 1.0. Both the genetic and enzymatic basis of restriction and modification (R-M) phenomena have been well elucidated and R-M systems are now classified as types I, II and III (2,3).
Among the 3392 restriction enzymes found to date, 3333 (98.3%) are type II (4). This high percentage may be due to their ease of detection and high demand, but may not necessarily reflect the actual distribution of R-M systems. Recent bacterial genome projects including Archae, have revealed that out of the first 28 completely sequenced genomes, 74, 51 and 21% have sequences homologous to either type I, II or III R-M systems, respectively (5). Sequences homologous to R-M systems could not be detected in only four of the 28 genomes. Thus, it is possible to predict that many more type I and III enzymes exist in nature.
Several methods have been used to detect R-M systems. Classical bacteriophage (EOP) assay is a simple method to detect the presence of restriction enzymes. Many bacterial strains, however, are not susceptible to infection by phages commonly used in laboratories. Anti-restriction systems (6), present in many phages, can also obscure the detection of R-M systems. An alternate method to screen bacterial strains for type II enzymes involves mixing cell extracts with known DNA substrates to look for distinct DNA fragments following gel electrophoresis. This method, however, may not be suitable to find type I or type III R-M systems mainly due to either non-specific cleavage of DNA or to the presence of non-specific nucleases in the sample. After R-M genes are cloned, DNA hybridization (7) or PCR can also be used to detect genes coding for restriction enzymes. Analysis of data from current bacterial genome projects is an alternative method to find restriction enzymes, but is limited to currently sequenced bacterial genomes.
Restriction enzyme recognition sequences are identified using several methods (8–11). Following cleavage of DNA with a purified restriction enzyme, fragments can be compared with a set of patterns generated by a computer (12). This in vitro method is commonly used to find the recognition sequences for type II enzymes. Alternatively, substrate DNA can be labeled using a purified methylase and then digested using several type II restriction enzymes. Following gel electrophoresis, labeled fragments are compared to find a common sequence (8). An in vivo strategy uses M13 phage vectors containing DNA fragments of known sequence (9, 10). This method relies on the principle that a phage DNA fragment containing an unmodified target site plates with a reduced efficiency when transferred into a strain containing an R-M system (13).
Restriction enzymes in the cell destroy not only invading phage DNA but also DNA transferred by conjugation, transformation or transduction. To protect incoming DNA, Escherichia coli strains lacking restriction systems, such as DH5α (r–K) and HB101 (r–B), are commonly used. Previously, we developed two r– m+ Salmonella typhimurium strains, LB5000 (14) and JR501 (15) in which all three restriction enzymes are mutated.
To date, no method has been reported that uses transformation to estimate the presence of in vivo R-M activities. Here we describe a quantitative R-M test using plasmid DNA and a CaCl2-heat shock transformation method (16). To test the validity of the method, we constructed a series of plasmids containing lambda DNA fragments. Lambda DNA was chosen because it contains the recognition sequences for all known type I and III, and most type II R-M systems and the 48.5 kb DNA sequence is documented (17). Transformation efficiencies of plasmids can vary due to both the properties of the cell and experimental conditions. However, by using a standard cold CaCl2-heat shock method and appropriate controls, we found that efficiencies were very consistent.
RM Search, a computer program, was recently developed to identify recognition sequences for restriction enzymes (18). We screened clinical E.coli strains for the presence of restriction activity, and here we report four new restriction enzymes and their recognition sequences.
MATERIALS AND METHODS
Bacterial strains
All bacterial strains used in this study are E.coli. Escherichia coli C ( r0 m0) has no R-M system and was used as a control in some experiments. Strain DH5α (r–K m+K) is a restriction-minus mutant of EcoKI (16). Strains 2000 (r+B m+B) and 2379 (r+A m+A) produce the type IA and type IB R-M enzymes, EcoBI and EcoAI, respectively (19). The type IC R-M enzymes, EcoR124I, were produced by E.coli C pEKU67 (r+124I m+124I) (20). DH5α pJL4 (r–K m+K r+HindIII m+HindIII) contains the 2.2 kb fragment in pACYC184 and was used to produce the type II enzyme, HindIII. This plasmid was constructed for this study. Strain WA921 (r–K m–K r+P1I m+P1I, P1cIts) is a P1 phage lysogen that produces the type III enzyme EcoP1I (21). Clinical E.coli strains, EC377, EC585, EC646, EC777 and EC1158 were all obtained from Loma Linda University Medical Center.
Bacteria were grown in Luria–Bertani (LB) medium and incubated at 37°C with the exception of strain WA921 (P1 lysogen) that was incubated at 30°C. Ampicillin was added to a final concentration of 200 µg/ml. Chloramphenicol and tetracycline were added to a final concentration of 20 µg/ml. Growth was monitored using optical density (OD) measurements at 510 nm.
Enzymes and reagents
Reagents were purchased from Fisher Scientific (Hanover Park, IL, USA) and Sigma (St Louis, MI, USA). Restriction enzymes and T4 DNA ligase were obtained from New England Biolabs (Beverly, MA, USA) and Promega (Madison, WI, USA). DNA sequencing was done by the Center for Molecular Biology and Gene Therapy, Loma Linda University (Loma Linda, CA, USA).
Plasmid transformation
A simplified CaCl2-heat shock method was used for plasmid transformation as described previously (15) with the following modifications. An overnight culture was diluted 20-fold into 10 ml of LB broth and incubated at 37°C on a rotating shaker to OD510 = 0.4 (∼2.0 × 10⁸/ml). One milliliter of culture was then centrifuged and washed with 1 ml of cold 100 mM CaCl2 and concentrated 10-fold by resuspension in 100 µl of cold 100 mM CaCl2. Five microliters (∼10 ng) of plasmid DNA was then added to either 100 or 10 µl (mini-scale) of the cells prepared above and the mixture was kept in ice for 30 min. Cells were then heat shocked for 90 s at 43°C and placed in ice for 30 s. One milliliter or 85 µl (mini-scale) of SOC (16) was added and the mixture was incubated for 30 min and plated on L-agar containing ampicillin or other antibiotics.
Definition of efficiency of transformation
Efficiency of transformation (EOT) is defined in this study as the relative number of transformants obtained, using the same amount of plasmid DNA, from the test strain compared with the number of transformants obtained from the control strain. This term is analogous to the EOP of bacteriophage. However, EOT should not be confused with the commonly used term, transformation efficiency (16) defined as the transformant number per microgram of DNA. EOT is identical to the term relative transformation efficiency.
Rationale of the plasmid R-M tests
Figure 1 shows the overall protocol and rationale of the test. In this scheme, hypothetical recognition sites are shown in pL3 and pL5. When pL3 is transformed into a bacterial strain containing a restriction endonuclease (R+), a reduction of the ampicillin-resistant transformants is expected when compared with the R– control bacteria, resulting in an EOT = 10–1–10–2. On the other hand, pL4, which does not contain a recognition site, should not show a reduction of AmpR transformant numbers and the EOT should be equal to 1.0. When modified plasmids are obtained and challenged to the same strain, the EOT should be equal to 1.0.
Figure 1.

A diagram showing the subcloning of the six lambda BamHI (HI) fragments into pMECA (top) and the plasmid restriction (center) and modification test (bottom) using a transformation method. In this figure, it is assumed that lambda BamHI fragments no. 3 (cloned in pL3) and no. 5 (pL5) each contain a recognition site (darkened area), whereas fragment no. 4 (pL4) and the remaining fragments do not contain a restriction site. Plasmid pMECA is a cloning vector and is represented as a solid line. R+ bacteria produce a restriction enzyme that cleaves pL3, which has an unmodified recognition site. R– bacteria have no restriction activity and are used as a control for the restriction test. Modified pL3 can be isolated from surviving colonies following transformation. Using this modified pL3, a modification test can be performed by transforming this plasmid to both R– and R+ strains. Modified plasmids are expected to result in the same number of transformants in both strains.
Calculation of EOT
Compared with phage experiments, the transformation process is more sensitive to various physiologic conditions that may result in a change in transformation efficiency between strains. For this reason, depending on the experimental conditions, four methods were used in this study to calculate EOT values for each R-M system tested.
When an isogenic strain was available, the number of AmpR transformants obtained from both the test strain (e.g. DH5α pJL4) and the control strain (DH5α), was normalized to the number obtained from the control strain, i.e. EOT = no. of AmpR transformantstest / no. of AmpR transformantscontrol. All EOT values (pMECA, pL1–pL6) were calculated using this process for the type II R-M system, HindIII.
A second method was used when pMECA, the original cloning vector, did not contain any relevant recognition sites. In this case, EOT values obtained from the test versus control strains for pMECA were compared. When a subtle but consistent difference was observed, this factor (pMECA EOTtest / pMECA EOTcontrol) was considered in the final EOT calculation. This subtle difference may be a reflection of a particular physiologic condition, such as the presence of an additional plasmid carrying the R-M genes, or a difference in the growth stage between strains. This method was used to calculate EOT values for EcoR124I.
When an isogenic strain was not available but a control plasmid was available, E.coli C was used as a cell control and pMECA was used as a plasmid control. EOT values were adjusted as described in the second method, EcoR124I, and the second normalization step was always required. This third method was used to calculate the EOT values for EcoBI and EcoAI.
Lastly, when an isogenic strain was not available and the control plasmid pMECA contained a restriction site, we used modified plasmid DNA to calculate EOT values for all plasmids, including pMECA. This method was used to calculate EOT values for the type III R-M system, EcoP1I using E.coli C as a control. In this case, the number of AmpR transformants obtained from the transformation of modified and non-modified plasmids into the test strain was compared with the number of transformants from the control strain. EOT values were then adjusted by the relative values obtained from each EcoP1I modified plasmid.
Lambda BamHI plasmid library construction
To clone the lambda BamHI fragments, 200 ng of lambda DNA cIts857S7 (17) was completely digested with BamHI and ligated into the BamHI site of pMECA (22), a pUC derivative. The ligation mixture was transformed into E.coli DH5α using CaCl2-heat shock method (15), and the clones were selected by plating the mixture on L-agar containing ampicillin and 5-bromo-4-chloro-3-indolyl-β-d-galactoside (X-gal) to a final concentration of 40 µg/ml.
DH5α contains an active EcoKI modification methylase, thus plasmids should be methylated at the EcoKI site. However, none of the known R-M systems tested have recognition sites that overlap with any EcoKI site.
Plasmid DNA was then prepared using either the Rapid Pure Miniprep (RPM) from Bio101 (Carlsbad, CA, USA) or Midiprep kit from Qiagen (Valencia, CA, USA). Plasmids were digested with restriction enzymes and electrophoresed in 0.8 % acrylamide gel using 0.5× TBE buffer. A total of six clones, each containing a different lambda BamHI fragment were selected (Fig. 2). This set of six plasmids was designated pL1–pL6 (L from lambda). Plasmids pL2–pL6 consist of lambda BamHI fragments and the vector, pMECA. Plasmids pL1 and pL6 contain the left (5′) and right (3′) end lambda fragments, respectively, and have only one BamHI site resulting in a single band (Fig. 2). pL1 was obtained from a lambda BamHI library as a clone with a single 8 kb (5.5 and 2.8 kb vector) BamHI band. DNA sequencing showed that this plasmid contains a 5.5 kb 5′ end BamHI fragment and, in addition, 255 bp of the lambda 3′ end. This plasmid seems to be a product of an aberrant ligation. pL6 was derived from a plasmid pL1-6, which has a 12.3 kb insert created by an end to end ligation containing both the 5′ and 3′ end lambda BamHI fragments. To obtain pL6, pL1-6 was digested with XbaI and self ligated. DNA sequencing revealed that pL6 contains the entire 3′ end BamHI fragment (6.8 kb) as well as 408 bp of the 5′ end BamHI fragment.
Figure 2.
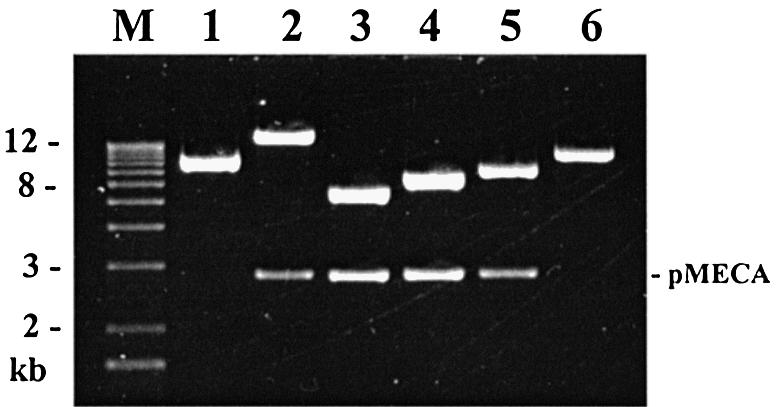
pL1 to pL6 plasmid subclones derived from phage lambda. To construct the pL series of subclones, lambda DNA was digested with BamHI and cloned into the BamHI site of pMECA. The subclones are shown here after digestion with BamHI. Lane M, 1 kb ladder; lanes 1–6, pL1–pL6. Lanes 2–5 show both the inserts (16.8, 5.6, 6.5, 7.2 kb, respectively) and the pMECA vector (2.8 kb). Plasmids pL1 and pL6 (5.8 and 7.2 kb inserts, respectively) contain a single BamHI site and include the end clones of phage lambda.
The pE series subclones were derived from E.coli K-12 chromosomal DNA (J. K. A. Kasarjian, M. Hidaka, T. Horiuchi, M. Iida and J. Ryu, manuscript submitted for publication).
Screening of E.coli clinical strains for restriction activity
Clinical E.coli strains, collected from LLUMC laboratory, were grown on L-amp plates (200 µg/ml) and cataloged according to ampicillin sensitivity or resistance. Ampicillin-sensitive strains were selected and transformed using the control plasmid pMECA (AmpR). Highly transformable ampicillin-sensitive strains were then tested using the pL and pE series plasmids to determine restriction activity. Restriction activity was considered positive when a reduction in EOT of 10–1 or less was observed. Modification tests were done on positive plasmids to confirm that any reduction in EOT was a result of the presence of one or more recognition sites in the plasmid DNA. Positive and negative DNA sequences were then compared using the computer program RM Search (18), to determine the recognition sequence for each system.
RESULTS AND DISCUSSION
In order to estimate the in vivo R-M activity in bacteria, six lambda BamHI fragments were cloned into pMECA (Fig. 2). Each of the six plasmids, designated pL1–pL6, was then transformed into bacteria possessing a known restriction enzyme and a corresponding modification methylase (plasmid restriction test). A total of five R-M systems were selected, representing all three types of R-M systems: EcoBI (type IA), EcoAI (type IB), Eco124I (type IC), HindIII (type II) and EcoP1I (type III). Phage lambda contains at least one site for each R-M system as shown in either Figure 3 (type I and II) or Figure 5 (type III). EcoAI, for example, has only one recognition sequence located in pL5, whereas EcoR124I has a total of 14 sites in lambda, two or three in each plasmid.
Figure 3.

Locations of type I and type II recognition sequences in pMECA and lambda DNA. Each black star represents one recognition site. Plasmids pL1–pL6 each contain a BamHI fragment of lambda DNA. Note that the vector, pMECA, contains one HindIII site. Map not to scale.
Figure 5.

Possible EcoP1I sites present in pMECA and the pL series plasmids. Plasmid DNA is shown in a linear form after digestion with BamHI. Type III R-M systems require a pair of inversely oriented EcoP1I sites. Each arrow represents one EcoP1I site. A P1 pair, formed of two inversely oriented sites, is shown in the inset. Pairs separated by a distance of <3.5 kb are shown as solid arrows. In some cases, additional pairs can be formed using a similar end. For clarity, only the shortest pairs are counted in the parentheses at the left.
Plasmid R-M tests for type I systems
EOT data for each representative type I and type II systems are shown in Table 1. Genes for both EcoBI and EcoAI R-M systems are located on the chromosome at a unique allelic position (2). EcoR124I is expressed on a plasmid (pEKU67) (20) in E.coli C. The vector pMECA does not contain recognition sequences for any of the type I R-M systems tested. It is expected that if there is no restriction activity in the recipient cells, the EOT will be close to 1.0, whereas if there is restriction activity, the EOT will be substantially reduced (Fig. 1). An EOT value as low as 10–3 was observed for all the type I R-M systems tested (EcoBI, EcoAI and EcoR124I). When plasmid DNA contained a single recognition site, a 10–1 level of restriction was observed for the EcoBI system and more than a 10–2 reduction was observed for EcoAI.
Table 1. Plasmid restriction tests.
| R-M system (strain) | pMECA | pL1 | pL2 | pL3 | pL4 | pL5 | pL6 |
|---|---|---|---|---|---|---|---|
| EcoBI (2000) | 1.0 | 4.5 × 10⁻³ (±1.9 × 10⁻³) | 2.0 × 10⁻² (±3.2 × 10⁻²) | 0.11 (±0.15) | 8.4 × 10⁻² (± 8.8 × 10⁻²) | 1.9 (±0.75) | 0.2 (±0.2) |
| EcoAI (2379) | 1.0 | 1.2 (±0.51) | 1.5 (±0.29) | 0.8 (±0.17) | 0.7 (±0.15) | 7.8 × 10⁻³ (±5.1 × 10⁻³) | 1.3 (±0.32) |
| EcoR124I (E.coli C pEKU67) | 1.0 | 5.4 × 10⁻² (±7.7 × 10⁻²) | 3.1 × 10⁻² (±4.2 × 10⁻²) | 4.7 × 10⁻² (±6.6 × 10⁻²) | 2.1 × 10⁻² (±1.9 × 10⁻²) | 7.9 × 10⁻³ (±7.8 × 10⁻³) | 9.3 × 10⁻³ (±1.1 × 10⁻²) |
| HindIII (DH5α pJL4) | 7.6 × 10⁻² (±7.1 × 10⁻²) | 6.0 × 10⁻² (±4.5 × 10⁻²) | 0.19 (±8.9 × 10⁻²) | 7 × 10⁻³ (±7.1 × 10⁻⁴) | 0.17 (±4.4 × 10⁻²) | 2.0 × 10⁻³ (±3.4 × 10⁻⁴) | 2.0 × 10⁻² (±8.8 × 10⁻³) |
Escherichia coli C was used as a control strain for EcoBI, EcoAI and EcoR124I. EOT values were normalized to pMECA, which does not contain EcoBI, EcoAI or EcoR124I sites. An isogenic strain, DH5α, was used as a control for HindIII experiments. Because pMECA contains one HindIII recognition sequence, a reduction in EOT was seen compared with DH5α. Standard deviations are shown in parentheses.
The relationship between EOT and the number of sites was calculated and is shown in Figure 4. A greater reduction of EOT was observed when plasmid DNA contained more than one recognition site. These data suggest that the limiting factor for this reaction is the number of restriction sites present in the plasmid and not the enzyme concentration contained in the test strain. This agrees with previous observations that bacteriophage DNA containing more recognition sequences is also more strongly restricted (1).
Figure 4.

Relationship between EOT and the number of recognition sequences present in plasmid DNA. Average EOT values are plotted against the number of recognition sequences for R-M systems EcoBI (A), EcoAI (B), EcoR124I (C) and HindIII (D). Average EOT values and standard deviations were calculated from the data shown in Table 1.
Although EOT values should be equal to 1.0 when a plasmid does not contain any target sites, observed EOT values fluctuated between 0.7 and 1.9 after the values were normalized to the plasmid pMECA (Table 1). This fluctuation has also been observed in phage EOP values and seems to be inherent to the experimental system (19). However, the obtained EOT values are sufficient to detect clearly the presence of even one recognition sequence in the plasmid DNA.
To confirm that the reduction of EOT was due to the direct action of restriction enzymes, a series of plasmid modification tests were performed for type I R-M systems. For this test, plasmids were purified from any surviving AmpR colonies after the restriction tests. Prior to the modification test, restriction enzyme analysis was performed to confirm the structural integrity of the plasmid DNA. Plasmids smaller in size than expected were occasionally observed. Only intact modified plasmids were transformed into the original r+ and r– control strains and the EOT was calculated. We observed a fluctuation of EOT values between 0.9 and 1.5, close to 1.0 (Table 2). Therefore, we concluded that plasmids were successfully modified by the host methyltransferase.
Table 2. Plasmid modification tests.
| R-M system | Modified plasmids | ||||||
|---|---|---|---|---|---|---|---|
| pMECA | pL1 | pL2 | pL3 | pL4 | pL5 | pL6 | |
| EcoBI | 1.0 | 1.3 (±0.15) | 1.2 (±0.21) | 1.0 (±0.18) | 1.0 (±0.80) | – | 1.3 (±0.38) |
| EcoAI | 1.0 | – | – | – | – | 1.5 (±0.29) | – |
| EcoR124I | 1.0 | 1.2 (±0.06) | 1.2 (±0.21) | 1.4 (±0.22) | 1.1 (±0.45) | 1.2 (±0.41) | 1.1 (±0.52) |
| HindIII | 1.0 | 1.0 (±0.31) | 1.0 (±0.35) | 0.9 (±0.19) | 0.9 (±0.14) | 1.1 (±0.28) | 0.9 (±0.14) |
Control and test strains are as described in Table 1. To obtain EOT values modified plasmid DNA was purified from surviving transformants and transformed again into the R-M producing strain. The relative number of transformants was calculated and the value was normalized to a similar value obtained from the results using pMECA. Standard deviations are shown in parentheses. When no value is given the plasmid did not contain a corresponding recognition sequence.
Plasmid R-M test for type II R-M systems
In this experiment, E.coli DH5α cells containing HindIII clones (pJL4) were used to represent type II R-M systems and the parental strain, DH5α, was used as a control. A single HindIII site is located in pMECA (Fig. 3) and an EOT of ∼10–1 was observed when pMECA was transformed into DH5α pJL4 (Table 1). A further reduction in EOT was observed when plasmids contained additional restriction sites (pL3, pL5 and pL6) (Fig. 4). EOT values similar to the pMECA control were observed for plasmids with no additional restriction sites (pL1, pL2 and pL4). Modification tests using plasmid DNA from surviving HindIII clones clearly showed that the plasmids were modified by the host modification methylase (Table 2). These results suggest that type II enzymes can also be detected using this transformation method.
Plasmid R-M tests for type III R-M systems
Similar experiments were performed using the type III R-M system, EcoP1I. Enzyme EcoP1I recognizes a pair of nonmethylated, inversely oriented recognition sites (5′-AGACC-3′) (23). All P1 recognition sites are shown along with their orientation (Fig. 5). Previous in vitro experiments, using EcoP15I, have shown that the distance required between the two sites varies from 13 bp to 3.5 kb (23). It has been observed that stronger restriction activity occurs when a shorter distance is present between inversely oriented sites. More recent work shows that a distance of <100 bp decreases the DNA cleavage efficiency of EcoP15I (24). Although the minimum or maximum distances necessary between two EcoP1I sites for restriction activity in vivo have not yet been established, we assumed that EcoP1I would behave similarly to EcoP15I.
Three recognition sites, forming two possible P1 pairs, are present in the pMECA vector. The distance between the shorter P1 pair in circularized pMECA is 2.6 kb. Escherichia coli C and modified plasmid DNA were used as controls. All results for the EcoP1I restriction tests were normalized to modified plasmid EOT values (Fig. 6). To illustrate the results more clearly, a bar graph was used to show EOT values for the EcoP1I R-M system (Fig. 6). Many potential EcoP1I pairs exist in each plasmid. To make the interpretation of the data easier, only EcoP1I pairs separated by a distance of <3.5 kb, with the exception of the pair in pL3 (8.2 kb), are shown as solid arrows in Figure 5.
Figure 6.

EcoP1I plasmid restriction test. All plasmids were transformed into strain WA921 using E.coli C as a control. Modified plasmids were then obtained and transformed into each strain. Details of the EOT calculation are described in the Materials and Methods.
Weak restriction (EOT ∼10–1) was observed for those plasmids containing only one or two potential pairs, such as pMECA, pL3, pL4 and pL6. Results for the remaining plasmids were more clear. Both pL1 and pL5 contain three potential EcoP1I pairs and the EOT was 10–2, whereas pL2 contains four potential pairs and the EOT was 10–3. As seen for both type I and type II R-M systems (Fig. 4), the reduction of EOT for the type III R-M systems was also greater when plasmid DNA contained more potential target sites. Compared with type I and II enzymes, detection of a single site in plasmid DNA may be difficult since the reduction in EOT is not as dramatic.
Screening of clinical E.coli strains for restriction activity using the plasmid R-M test
To apply this method to clinical strains, ampicillin-sensitive E.coli strains were collected from Loma Linda University Medical Center. The transformation frequency for each strain was determined using plasmid pMECA. Among the 700 strains tested, 15 strains showed a comparable transformation frequency to the DH5α control strain. These 15 transformable strains were then tested using plasmids pL1–pL6 to determine restriction activity. Restriction activity was measured by EOT. Modification tests were done when the EOT was 10–1 or less to confirm that any reduction in EOT was the result of the presence of one or more recognition sites in the plasmid DNA. Plasmid pL5 was not transformable into many of the clinical strains, so was not used in further studies. Out of 15 strains tested, 14 showed restriction activity (data not shown). Therefore, 93% of strains tested had at least one R-M system. Restriction activity could not be identified if the restriction enzyme recognizes a sequence that does not exist in phage lambda DNA.
Determination of the recognition sequences for the R-M systems of E.coli strains EC377, EC585, EC646, EC777 and EC1158
Strains EC377, EC585, EC646, EC777 and EC1158 were selected for further study. To determine the recognition sequence of these five strains, the newly developed pE series of plasmids (J. K. A. Kasarjian, M. Hidaka, T. Horiuchi, M. Iida and J. Ryu, manuscript submitted for publication) were used in addition to plasmids pL1–pL6 described in this paper. A reduction of EOT (∼10–1) was used to identify the presence of a target site in positive plasmids. When an ambiguous EOT, 0.1–0.5, was obtained, a modification test was performed. The RM Search program identifies nucleotide sequences that exist in all positive plasmids and are absent from all negative plasmids. One recognition sequence was identified for each strain (Table 3). These putative sequences were confirmed by constructing pMECA plasmids for each strain containing the specific recognition sequence in a 19 bp oligonucleotide. Plasmid R-M tests were performed using these plasmids to confirm the target sequences. EOT values for the restriction tests were all <10–1 whereas the values for the modification tests were close to 1.0 (Fig. 7).
Table 3. Plasmid restriction test results for E.coli clinical strains.
| Plasmid | Strain | ||||
|---|---|---|---|---|---|
| EC377 | EC585 | EC646 | EC777 | EC1158 | |
| pMECA | – | – | – | – | – |
| pL1 | + | – | – | – | + |
| pL2 | + | + | + | + | + |
| pL3 | + | – | – | + | + |
| pL4 | + | – | – | + | + |
| pL6 | + | – | + | + | + |
| pE2 | – | + | – | + | – |
| pE3 | + | + | – | – | – |
| pE4 | – | + | – | – | – |
| pE5 | + | + | + | – | + |
| pE6 | + | + | + | – | – |
| pE8 | – | + | + | – | + |
| pE9 | – | – | – | – | – |
| pE10 | – | – | – | – | – |
| pE11 | – | – | – | – | + |
| pE12 | – | + | – | + | – |
| pE14 | + | + | + | + | + |
| pE15 | – | + | + | – | + |
| pE16 | – | – | – | + | – |
| pE17 | + | – | + | – | – |
| pE18 | – | + | – | + | – |
| pE19 | – | + | + | + | – |
| pE22 | + | – | – | – | + |
| pE23 | + | + | + | – | – |
| pE24 | – | – | + | – | – |
| pE25 | + | – | – | + | – |
| pE26 | + | – | – | + | + |
| pE28 | – | – | – | – | – |
| pE29 | + | – | – | – | – |
| pE31 | – | – | – | – | – |
| pE32 | + | + | + | + | + |
| pE33 | – | – | – | + | + |
| pE38 | – | – | – | – | – |
| pE41 | + | + | – | + | – |
| pE44 | – | – | – | – | – |
| pE45 | + | + | + | – | + |
| Recognition sequence | GGA(8N)ATGC | GCC(6N)TGCG | CCA(7N)CTTC | GGA(6N)TATC | TGA(8N)TGCT |
| Type | I (new) | II (?) (new) | I (new) | I (new) | I (EcoBI isoschizomer) |
Plus (+) or minus (–) indicates the presence or absence of a recognition sequence in each plasmid.
Figure 7.

Recognition sequence confirmation using plasmid R-M test. EOT data for R-M tests are shown as solid and striped bars, respectively. Bacterial strain DH5α and plasmid pMECA were used as controls.
Unique type I sequences were found for strains EC377, EC646 and EC777 (Table 3). The tetranucleotide component of the recognition sequence for Eco377I is identical to that of EcoEI [GAG(7N)ATGC]. Similarly, Eco646I and EcoPrrI [CCA(7N)RTGC)] share a common trinucleotide component in their recognition sequences. These similarities may predict a high degree of similarity in the amino acid target recognition sequence (TRD) of these enzymes (9). EcoKI and StySPI, members of the IA family, also share an exact trinucleotide component and their amino TRDs share 90% identity (25). The recognition sequence found for strain EC1158 is identical to the EcoBI (type IA) sequence (26–28). An interesting comparison could be made between the nucleotide and protein sequences for the prototype type IA enzyme, EcoBI and Eco1158I. The Eco585I sequence, GCC(6N) TGCG, resembles a type I sequence, but may be a type II sequence since there are no target adenines for methylation in the trinucleotide component. However, when a cell extract of EC585 was mixed with substrate DNAs of known sequence, the predicted banding pattern was not observed possibly due to the presence of non-specific nucleases. Thus, further study is necessary to identify the character of this restriction enzyme.
Advantages of the plasmid R-M test
All plasmids containing recognition sequences showed a reduced EOT (0.3–7.8 × 10⁻³; Table 1 and Fig. 6) and we conclude that this plasmid transformation method is useful to detect the presence of restriction enzymes in E.coli. Restriction activity can theoretically be detected in any transformable bacteria. However, additional sets of plasmids may be needed to overcome bacterial host ranges.
To detect restriction activities in the cell, the same principle may be applied to other transfer methods including transduction and conjugation. Compared with these transfer systems, the plasmid transformation system can be used with a wide variety of bacterial strains by using different selection markers. To detect recognition sequences using a computer, it is essential to have a variety of DNA sequences that may or may not contain the recognition sequence (18). Since plasmid DNA is easy to manipulate, this transformation system is more practical than other methods of DNA transfer.
Recently, we also applied this method to determine the recognition sequence for KpnAI, a type I restriction enzyme from Klebsiella species (J. K. A. Kasarjian, M. Hidaka, T. Horiuchi, M. Iida and J. Ryu, manuscript submitted for publication). This method is especially useful for type I enzymes because their cutting sites give little information about the actual location of their recognition sequences and many known type I R-M systems have unknown recognition sequences (4).
Sixteen sequences coding for restriction or modification genes were found in Helicobacter pylori, however, only four of these systems are expressed (5). Our present method offers an advantage as it detects in vivo expression of restriction enzymes. After new enzymes are identified and cloned, DNA hybridization can then be used to screen many bacterial strains for homologous sequences as demonstrated by Barcus using the ECOR collection (7). Identification of more type I enzymes with similar recognition sequence specificities and comparing the corresponding portion of their HsdS subunits, may lead to important information about protein–DNA interactions (29). Further analysis of new R-M enzymes may help explain the development of diversity of R-M systems.
Acknowledgments
ACKNOWLEDGEMENTS
We thank W. Langridge and G. Javor for critical reading of the manuscript, J. Lewis for the construction of plasmid pJL4, Vicky Valinluck for construction of plasmid pL6, Terence Tay, Shannon Jackson and Sandra White for their contribution to the collection and analysis of the clinical E.coli strains. This work was supported by grant DAMD17-97-2-7016 from the Department of the Army. The content of the information does not necessarily reflect the position or the policy of the federal government or of the National Medical Technology Testbed, Inc.
REFERENCES
- 1.Arber W. and Linn,S. (1969) DNA modification and restriction. Annu. Rev. Biochem., 38, 467–500. [DOI] [PubMed] [Google Scholar]
- 2.Murray N.E. (2000) Type I restriction systems: sophisticated molecular machines (a legacy of Bertani and Weigle). Microbiol. Mol. Biol. Rev., 64, 412–434. [DOI] [PMC free article] [PubMed] [Google Scholar]
- 3.Redaschi N. and Bickle,T.A. (1996) DNA restriction and modification systems. In Neidhardt,F.C. (ed.), Escherichia coli and Salmonella typhimurium: Cellular and Molecular Biology. ASM Press, Washington, DC, pp. 773–781.
- 4.Roberts R.J. and Macelis,D. (2001) REBASE—restriction enzymes and methylases. Nucleic Acids Res., 29, 268–269. [DOI] [PMC free article] [PubMed] [Google Scholar]
- 5.Kong H., Lin,L.F., Porter,N., Stickel,S., Byrd,D., Posfai,J. and Roberts,R.J. (2000) Functional analysis of putative restriction-modification system genes in the Helicobacter pylori J99 genome. Nucleic Acids Res., 28, 3216–3223. [DOI] [PMC free article] [PubMed] [Google Scholar]
- 6.Kruger D.H. and Bickle,T.A. (1983) Bacteriophage survival: multiple mechanisms for avoiding the deoxyribonucleic acid restriction systems of their hosts. Microbiol. Rev., 47, 345–360. [DOI] [PMC free article] [PubMed] [Google Scholar]
- 7.Barcus V.A., Titheradge,A.J. and Murray,N.E. (1995) The diversity of alleles at the hsd locus in natural populations of Escherichia coli. Genetics, 140, 1187–1197. [DOI] [PMC free article] [PubMed] [Google Scholar]
- 8.Nagaraja V., Shepherd,J.C., Pripfl,T. and Bickle,T.A. (1985) Two type I restriction enzymes from Salmonella species. Purification and DNA recognition sequences. J. Mol. Biol., 182, 579–587. [DOI] [PubMed] [Google Scholar]
- 9.Cowan G.M., Gann,A.A. and Murray,N.E. (1989) Conservation of complex DNA recognition domains between families of restriction enzymes. Cell, 56, 103–109. [DOI] [PubMed] [Google Scholar]
- 10.Gann A.A., Campbell,A.J., Collins,J.F., Coulson,A.F. and Murray,N.E. (1987) Reassortment of DNA recognition domains and the evolution of new specificities. Mol. Microbiol., 1, 13–22. [DOI] [PubMed] [Google Scholar]
- 11.Titheradge A.J., King,J., Ryu,J. and Murray,N.E. (2001) Families of restriction enzymes: an analysis prompted by molecular and genetic data for type ID restriction and modification systems. Nucleic Acids Res., 29, 4195–4205. [DOI] [PMC free article] [PubMed] [Google Scholar]
- 12.Gingeras T.R., Milazzo,J.P. and Roberts,R.J. (1978) A computer assisted method for the determination of restriction enzyme recognition sites. Nucleic Acids Res., 5, 4105–4127. [DOI] [PMC free article] [PubMed] [Google Scholar]
- 13.Arber W. (1974) DNA modification and restriction. Prog. Nucleic Acid Res. Mol. Biol., 14, 1–37. [DOI] [PubMed] [Google Scholar]
- 14.Bullas L.R. and Ryu,J. (1983) Salmonella typhimurium LT2 strains which are r– m+ for all three chromosomally located systems of DNA restriction and modification. J. Bacteriol., 156, 471–474. [DOI] [PMC free article] [PubMed] [Google Scholar]
- 15.Ryu J. and Hartin,R.J. (1990) Quick transformation in Salmonella typhimurium LT2. Biotechniques, 8, 43–45. [PubMed] [Google Scholar]
- 16.Hanahan D. and Bloom,F.R. (1996) Mechanisms of DNA transformation. In Neidhardt,F.C. (ed.), Escherichia coli and Salmonella typhimurium. Cellular and Molecular Biology. ASM Press, Washington, DC, pp. 2449–2459.
- 17.Sanger F., Coulson,A.R., Hong,G.F., Hill,D.F. and Petersen,G.B. (1982) Nucleotide sequence of bacteriophage lambda DNA. J. Mol. Biol., 162, 729–773. [DOI] [PubMed] [Google Scholar]
- 18.Ellrott K.P., Kasarjian J.K.A., Jiang,T. and Ryu,J. (2002) Restriction enzyme recognition sequence search program. Biotechniques, 33, 1322–1326. [DOI] [PubMed] [Google Scholar]
- 19.Bullas L.R., Colson,C. and Neufeld,B. (1980) Deoxyribonucleic acid restriction and modification systems in Salmonella: chromosomally located systems of different serotypes. J. Bacteriol., 141, 275–292. [DOI] [PMC free article] [PubMed] [Google Scholar]
- 20.Kulik E.M. and Bickle,T.A. (1996) Regulation of the activity of the type IC EcoR124I restriction enzyme. J. Mol. Biol., 264, 891–906. [DOI] [PubMed] [Google Scholar]
- 21.Wood W.B. (1966) Host specificity of DNA produced by Escherichia coli: bacterial mutations affecting the restriction and modification of DNA. J. Mol. Biol., 16, 118–133. [DOI] [PubMed] [Google Scholar]
- 22.Thomson J.M. and Parrott,W.A. (1998) pMECA: a cloning plasmid with 44 unique restriction sites that allows selection of recombinants based on colony size. Biotechniques, 24, 922–924, 926,, 928. [DOI] [PubMed] [Google Scholar]
- 23.Meisel A., Bickle,T.A., Kruger,D.H. and Schroeder,C. (1992) Type III restriction enzymes need two inversely oriented recognition sites for DNA cleavage. Nature, 355, 467–469. [DOI] [PubMed] [Google Scholar]
- 24.Mucke M., Reich,S., Moncke-Buchner,E., Reuter,M. and Kruger,D.H. (2001) DNA cleavage by type III restriction-modification enzyme EcoP15I is independent of spacer distance between two head to head oriented recognition sites. J. Mol. Biol., 312, 687–698. [DOI] [PubMed] [Google Scholar]
- 25.Fuller-Pace F.V. and Murray,N.E. (1986) Two DNA recognition domains of the specificity polypeptides of a family of type I restriction enzymes. Proc. Natl Acad. Sci. USA, 83, 9368–9372. [DOI] [PMC free article] [PubMed] [Google Scholar]
- 26.Lautenberger J.A., Kan,N.C., Lackey,D., Linn,S., Edgell,M.H. and Hutchison,C.A.,III (1978) Recognition site of Escherichia coli B restriction enzyme on phi XsB1 and simian virus 40 DNAs: an interrupted sequence. Proc. Natl Acad. Sci. USA, 75, 2271–2275. [DOI] [PMC free article] [PubMed] [Google Scholar]
- 27.Ravetch J.V., Horiuchi,K. and Zinder,N.D. (1978) Nucleotide sequence of the recognition site for the restriction-modification enzyme of Escherichia coli B. Proc. Natl Acad. Sci. USA, 75, 2266–2270. [DOI] [PMC free article] [PubMed] [Google Scholar]
- 28.Sommer R. and Schaller,H. (1979) Nucleotide sequence of the recognition site of the B-specific restriction modification system in E. coli. Mol. Gen. Genet., 168, 331–335. [DOI] [PubMed] [Google Scholar]
- 29.Thorpe P.H., Ternent,D. and Murray,N.E. (1997) The specificity of StySKI, a type I restriction enzyme, implies a structure with rotational symmetry. Nucleic Acids Res., 25, 1694–1700. [DOI] [PMC free article] [PubMed] [Google Scholar]