Abstract
Theoretical analysis has shown the possibility of determining causal connectivities of reacting species and the reaction mechanism in complex chemical and biochemical reaction systems by applying pulse changes of concentrations of one or more species, of arbitrary magnitude, and measuring the temporal response of as many species as possible. This method, limited to measured and pulsed species, is given here an experimental test on a part of glycolysis including the sequence of reactions from glucose to fructose 1,6-biphosphate, followed by the bifurcation of that sequence into two branches, one ending in glycerol 3-phosphate, the other in glyceraldehyde 3-phosphate. Pulses of concentrations of one species at a time are applied to the open system in a non-equilibrium stationary state, and the temporal responses in concentrations of six metabolites are measured by capillary zone electrophoresis. From the results of these measurements and the use of the theory for their interpretation, we establish the causal connectivities of the metabolites and thus the reaction mechanism, including the bifurcation of one chain of reactions into two. In this test case of the pulse method, no prior knowledge was assumed of the biochemistry of this system. We conclude that the pulse method is relatively simple and effective in determining reaction mechanisms in complex systems, including reactants, products, intermediates, and catalysts and their effectors. The method is likely to be useful for substantially more complex systems.
For some time, we have studied and reported on the development of novel methods for the determination of reaction mechanisms in both theory and experiments. New methods are necessary to replace the guessing of reaction mechanisms, that is, the sequence of elementary reaction steps leading from reactants to products. Our approaches are designed not to dissect a system into its elementary steps to be studied one at a time, as has been practiced, but rather to keep the system, and hence all its interactions, intact. For a method for the determination of the mechanism of oscillatory reactions, chemical and biochemical, see ref. 1 (and references 9, 10, 14, 18, 38, and 41 therein); for the application of the techniques of genetic algorithms, see refs. 2 and 3; for general reactions, we have developed a method of correlation metric construction. Time-dependent correlations of the concentrations of two species at a time are transformed into correlation diagrams that show the reaction pathway and significant parts of the reaction mechanism (4, 5). This method was successfully tested with experiments on a part of glycolysis (6, 7). It can also yield predictions on the connectivities of reacting chemical species, but for that it requires more accurate measurements than necessary for the determination of reaction pathways.
In yet another approach, we presented a theory of pulse perturbations for the determination of the connectivities of measured and pulsed chemical species in a reaction system (8) and, hence, the reaction mechanism itself. Consider a reaction system in a non-equilibrium stationary state. Increase the concentration of one (or more) species for a brief period by an arbitrary amount, i.e., administer a pulse of arbitrary magnitude in concentration of that species. (For discussions of pulse methods applied to obtain information on reaction mechanisms but limited to small perturbations, see refs. 9–11; for studies on computational functions in complex chemical and biochemical reaction systems, see references 42–44, 48, and 53 in ref. 1.) Then determine the responses of as many species as possible, e.g., reactants, products, intermediates, catalysts, and effectors on catalysts, by measuring their concentrations as a function of time as they return to the stationary state after the application of the pulse.
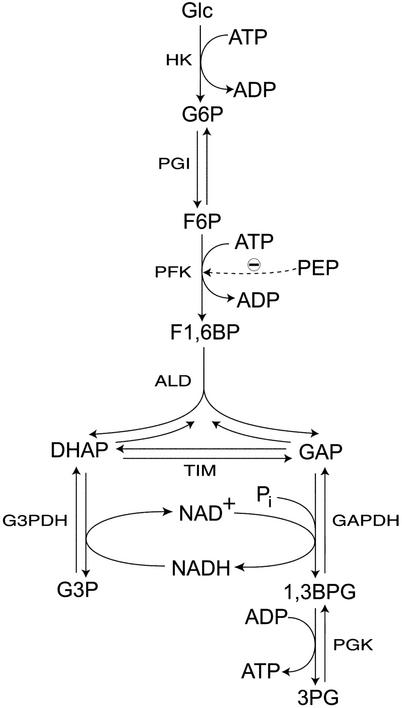
The theory presented in ref. 8 offers methods for determining the connectivities of the reacting species, the stoichiometric coefficients of species, the reaction orders, and estimates of rate coefficients from such measurements. We investigated analytically several types of reaction mechanisms: a straight chain of reactions, for example, the first three reactions in Fig. 1; a bifurcating chain, for example, the fourth reaction in Fig. 1; converging chains; negative and positive feed-forward and feedback reactions; and others. From the measurements described, it may be possible to obtain much information:
Figure 1.
Reaction scheme of the system under study. Glc, glucose; HK, hexokinase; PGI, phosphoglucose isomerase; PFK, phosphofructokinase; PEP, phosphoenolpyruvate; ALD, aldolase; TIM, triose phosphate isomerase; G3PDH, glycerol 3-phosphate dehydrogenase; 1,3BPG, 1,3-bisphosphoglycerate; PGK, phosphoglycerate kinase.
Several observations, which often hold, may be used as guidelines in the initial construction of connectivities of species in a reaction network. 1. The time of (appearance) of an extremum increases (and its amplitude decreases) as the number of reaction steps separating that species from the initially perturbed species increases, unless some species act as effectors in distant reactions. 2. Conversely, the initial curve of concentration changes of a species with time approaches the time axis (closer) as the number of reaction steps separating that species from the initially perturbed species increases. 3. Species that are directly connected through reactions to the initially perturbed species exhibit non-zero initial slopes. 4. Species that are not directly connected through reactions to the initially perturbed species exhibit zero initial slopes. 5. All responses are positive deviations from the stationary state unless there is a feedback, feedforward or higher order (>1) kinetic step. 6. For short times, before the exit of material from the pulse to the surroundings of the system, the concentration change of the pulse is conserved: the sum of deviations of concentrations (weighted by stoichiometric coefficients) must be constant and equal to the change in concentration of the initial pulse. This property is useful in determining that all species produced from the pulse through reactions have been detected and can help in determining correct stoichiometric coefficients (8).
In this article, we report on an experimental test of the pulse perturbation method on a part of glycolysis shown in Fig. 1.
Materials and Methods
The experiments were carried out in a continuous-flow, stirred-tank reactor (CSTR). A Teflon stirring disk was used, which reduced the reactor volume to 0.86 ml. Enzymes were confined to the reactor with a 10,000 molecular weight ultrafiltration membrane (Millipore by Amicon). The membrane was permeable to all small molecular weight species present in the system (7). All chemicals and enzymes were purchased from Sigma. Reactions were carried out in a solution of 30 mM Hepes, 50 μM adipate (internal standard), 50 mM potassium chloride, 1.0 mM sodium phosphate, 1.3 mM DTT, 5.0 mM magnesium chloride, 0.5 mM ATP, 0.5 mM NAD+, and 0.5 mM glucose, buffered at pH 7.1. In a typical pulse experiment, this solution was flowed into the CSTR through a peristaltic pump at a rate of 0.2 ml/min for at least 45 min to ensure a steady state in the reactor. A mixture of enzymes was then introduced into the CSTR, composed of 6.69 units of hexokinase (EC 2.7.1.1); 6.10 units of phosphoglucose isomerase (EC 5.3.1.9); 94.05 units of triose phosphate isomerase (EC 5.3.1.1); and 12.96 units of phosphoglycerate kinase (EC 2.7.2.3), from Saccharomyces cerevisiae; 10.88 units of phosphofructokinase (EC 2.5.1.11), from Bacillus stearothermophilus; and 0.29 units of aldolase (EC 4.1.2.13); 10.65 units of GAPDH (EC 1.2.1.12); and 5.25 units of glycerol 3-phosphate dehydrogenase (EC 1.1.1.8), from rabbit muscle. Samples of the outflow were collected over 20-s periods beginning 5 min after the input of the enzyme mixture and then every 10 min until 1 h elapsed. These samples were used to check that the enzyme products had reached a steady state before the injection of the pulse. Typical concentrations at steady state were 140 ± 5 μM glucose 6-phosphate (G6P), 36 ± 4 μM fructose 6-phosphate (F6P), 13 ± 2 μM fructose 1,6-bisphosphate (F1,6BP), 54 ± 5 μM dihydroxyacetone phosphate (DHAP), 243 ± 6 μM glycerol 3-phosphate (G3P), and 126 ± 7 μM 3-phosphoglycerate (3PG). Pulses were applied by introducing a concentrated solution of the perturbed metabolite (10 μl). A typical concentration of the pulse in the reactor was 0.5 mM. This high concentration was used to compensate for the outflow of nonreacted metabolite. After the pulse was injected, 10 samples were collected (over 20 s) every minute, then 2 samples every 5 min, and finally 2 samples every 10 min.
In complementary experiments, the solution flowed into the reactor was supplemented with other metabolites to test for their effects. In particular, we checked that fructose 2,6-bisphosphate, an activator in eukaryotic phosphofructokinase, is not an effector in the bacterial enzyme we used.
Samples were analyzed by capillary zone electrophoresis by using an Agilent (Palo Alto, CA) 3D Capillary Electrophoresis (CE) machine equipped with photodiode-array detection and silica capillaries with a diameter of 50 μm and an effective length of 56 cm. Indirect UV detection was used, with 5.0 mM 4-hydroxybenzoate as background electrolyte and 0.5 mM electroendosmotic modifier Anion-BT (Waters, MA), pH 11.8, reversing the polarity of the capillaries. A previously developed method for the separation and quantification of glycolytic metabolites was used (6). Most of the system components present in the reaction mixture, including G6P, F6P, F1,6BP, DHAP, G3P, and 3PG, were analyzed simultaneously by CE.
Every sample was injected four times into the CE device. To improve the accuracy of the measurements, the areas of the electropherogram were corrected by the retention time of each peak (12) and normalized to the corrected area of the adipate peak, which was used as an internal standard. The resulting ratios of corrected areas are proportional to the concentrations and were averaged over all four injections. Relative variations of the concentrations with respect to the steady state value were calculated directly from these averages. Absolute variations were determined by comparison with average corrected areas obtained from repeated injections of 100-μM standard solutions. Typical relative errors were 4% for G6P, 11% for F6P, 15% for F1,6BP, 9% for DHAP, 6% for 3PG, and 3% for G3P. Steady state concentrations were determined from a linear fit of the last two points of every experiment, along with a few points before the pulse injection (typical regression coefficients were 0.9). This procedure allowed for correction of slight decays of the concentrations due to slow inactivation of the enzymes.
Results and Discussion
Pulse Experiments.
G6P pulse.
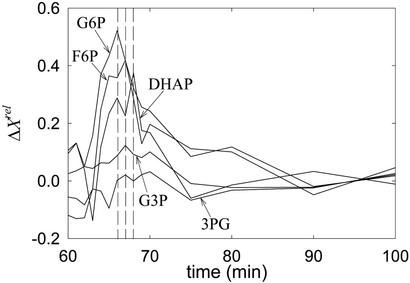
Fig. 2 depicts the relative variation of the concentrations, ΔXrel, after a pulse of G6P was applied (60 min after enzyme injection). Complete relaxation to the initial steady state took approximately half an hour. As seen from the amplitudes of ΔXrel, the temporal order of propagation of the pulse is as follows: G6P, F6P, DHAP, G3P, and 3PG. The times at which maximum variations occur agree with the preceding order, except perhaps for G3P and 3PG, where the maxima occur nearly simultaneously. In some experiments, F1,6BP could not be measured well, as here, and it is not shown.
Figure 2.
Relative variations of several concentrations after a pulse of G6P.
F1,6BP pulse.
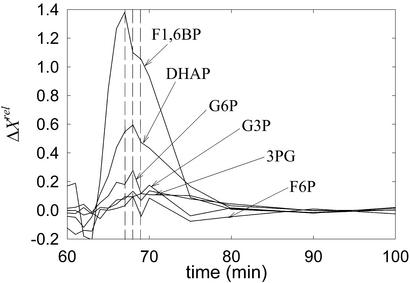
An example is displayed in Fig. 3. The order of propagation, in terms of maximum relative concentrations, is as follows: F1,6BP, DHAP, and, with similar amplitudes, G6P (slightly higher), G3P, 3PG, and F6P (slightly lower). These small differences were within measured errors and thus are not significant. Here, the measurements of F1,6BP are reliable. The times of maximum relative variation do not differ significantly, although it is clear that the first one corresponds to F1,6BP. The intercepts of successive curves (in order of amplitudes) support the same order of propagation as that of the maximum relative concentrations: the curve of DHAP crosses that of F1,6BP before G3P and 3PG intercept DHAP. G6P and F6P seem to behave differently, with a slightly faster decay than that of G3P and 3PG.
Figure 3.
Relative variations of several concentrations after a pulse of F1,6BP.
DHAP pulse.
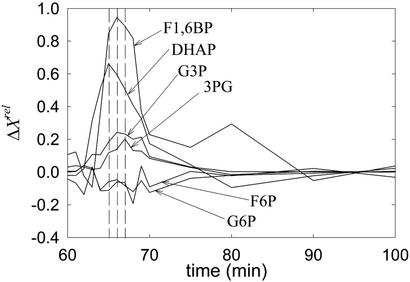
F1,6BP exhibits the maximum relative variation of a concentration (Fig. 4; see Data Analysis). The maximum of DHAP, the perturbed intermediate, is next in amplitude, followed by G3P and 3PG, which display similar amplitudes. G6P and F6P either responded with very low positive amplitudes or a slight negative variation (shown in Fig. 4). However, caution should be used here, because the signal-to-noise ratio of their variation is close to the limit of detection and normalization may have amplified the error. In contrast to the ordering of amplitudes, the maximum of ΔX occurs before that of ΔX
 , which is nearly simultaneous with the extremes of 3PG and G3P.
Figure 4.
Relative variations of several concentrations after a pulse of DHAP.
G3P and 3PG pulses.
DHAP was the only species to respond, and with low amplitude, to a pulse of G3P. No species responded to a pulse of 3PG.
NADH pulse.
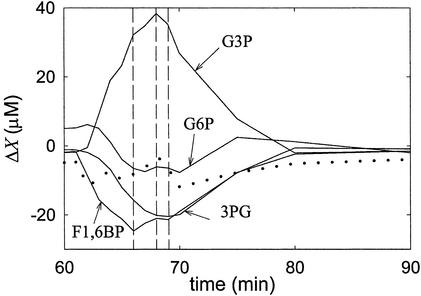
Absolute concentration variations, ΔX, are more useful in these experiments because negative responses occurred for F1,6BP, 3PG, and G6P (see Ref.8). Only G3P showed a significant positive response (Fig. 5). The order of extremes by time is as follows: F1,6BP, G3P, G6P, and 3PG. The amplitudes of the variations of F1,6BP and 3PG are about half that of G3P (in absolute value). G6P showed the smallest detectable absolute variation.
Figure 5.
Absolute variations of several concentrations after a pulse of NADH. The dotted line is the sum of variations of F1,6BP, G3P, and 3PG.
Data Analysis.
In the analysis of the experiments, we made a point of sequestering ourselves from as much information as possible to have a severe test of the pulse method. We did the analysis first by assigning random numbers to the species. Because knowing the names of the metabolic species did not modify our conclusions, we present the analysis using those names. We were not able to detect GAP and 1,3-bisphosphoglycerate, and we assumed DHAP and GAP to be at equilibrium although this assumption is not required for the analysis. In fact, we tested this finding in control experiments with triose phosphate isomerase at the same concentration as in the whole-system experiments. The ratio of DHAP and GAP concentrations was close to the equilibrium constant of the isomerization, 0.045 (13).
Many features of the pathway can be deduced from the propagation of a single pulse of G6P. In the first place, strong propagation to F6P suggests that this species follows G6P in the chain of reactions (Fig. 2). This finding is consistent with the observation that F6P is the first species to respond to the pulse. After propagating to F6P, G6P pulses propagate to DHAP. This result indicates that DHAP follows F6P. The most damped responses to G6P pulses were those of 3PG and G3P, indicating that they most likely follow DHAP in the pathway. However, they could participate in one or more irreversible reactions preceding G6P. Hence, further experiments were needed to establish their position unambiguously.
Pulses of F1,6BP (Fig. 3), a species that could not be reliably measured in G6P pulse experiments, showed that it must be an intermediate between F6P and DHAP. The latter displayed the strongest response to F1,6BP pulses, whereas propagation to G6P and F6P is extremely damped. This result suggests that an irreversible reaction mediates between F6P and F1,6BP, because DHAP responds significantly to G6P pulses, in agreement with theoretical predictions that upstream propagation is weak when the reactions are far from equilibrium. Propagation to G3P and 3PG is damped, consistent with these species having either initial or terminal positions in the reaction chain. Therefore F1,6BP pulses do not clarify whether G3P and 3PG precede G6P or not.
To answer that question, DHAP pulses were used (Fig. 4). In this case, G3P and 3PG respond significantly and similarly, although with low intensity, hinting that G3P and 3PG follow DHAP in the pathway. If these two species were located before G6P, their responses should be undetectable, because propagation of G6P pulses to DHAP is quite strong, but the opposite is not true. In fact, the concentration of G6P and F6P vary little, if at all, in response to DHAP pulses, indicating, once more, that irreversible reactions are present. Because the response of F1,6BP is strong, such irreversible reactions must precede this species, in accordance with F1,6BP pulse experiments. Furthermore, the relative variation of the F1,6BP concentration is greater than that of DHAP itself, which suggests that the stoichiometry is not 1:1; that both species are connected by fast reactions; and that the equilibrium constant, with F1,6BP as the reactant, must be low. Reported values for the equilibrium constant of aldolase are close to 0.069 mM (13). The stoichiometry of the F1,6BP/DHAP transformation can be deduced as follows: because the maximum relative variation of F1,6BP is approximately twice that of DHAP at the same time, one can conclude that two molecules of DHAP are produced from one of F1,6BP. The theory (8), applied to the model in Fig. 1, also predicts this observed behavior.
3PG does not respond to G3P pulses and vice versa. This fact could be explained by assuming that they are separated by slow and/or irreversible reactions. However, this assumption is not compatible with other experiments in which the responses of these intermediates are similar. For example, it has been mentioned that they respond similarly to pulses of DHAP (Fig. 4). This finding indicates that they have a common precursor, but they are not precursors of each other. Hence, they must be located in different branches of the pathway. Furthermore, there is no response of any measured intermediate to 3PG, which proves that it is a terminal species of the pathway and suggests that it is produced by either several or irreversible reactions, as these two possibilities would prevent the pulse from propagating upstream in the pathway. A slight response is observed for DHAP when G3P is perturbed (not shown), indicating that the reactions connecting these intermediates are few and reversible.
Additional evidence in favor of the hypothesis that two branches are present comes from NADH pulse experiments (Fig. 5). The variation of the concentration of G3P was positive, whereas that of 3PG was negative. This behavior can be explained assuming that NADH acts as an activator/substrate in the branch where G3P is and an inhibitor/product in the other branch. Furthermore, the concentration variations of G3P, F1,6BP, and 3PG add up to zero (dotted line in Fig. 5). This result can be interpreted as follows: NADH elicits an overall activation on the two branches leading to 3PG and G3P, thus increasing the sum of the two concentrations. As a consequence, the concentration of the common precursor decreases by the same amount. DHAP follows F1,6BP (Fig. 3). Therefore, the common precursor must be DHAP. However, the response of this species to NADH pulses was either too low to be measured or slightly negative (not shown). This finding is consistent with observations from DHAP pulse experiments that variations of DHAP quickly propagate to F1,6BP (see above). Therefore, the reaction(s) connecting F1,6BP and DHAP must be close to, although not in, equilibrium.
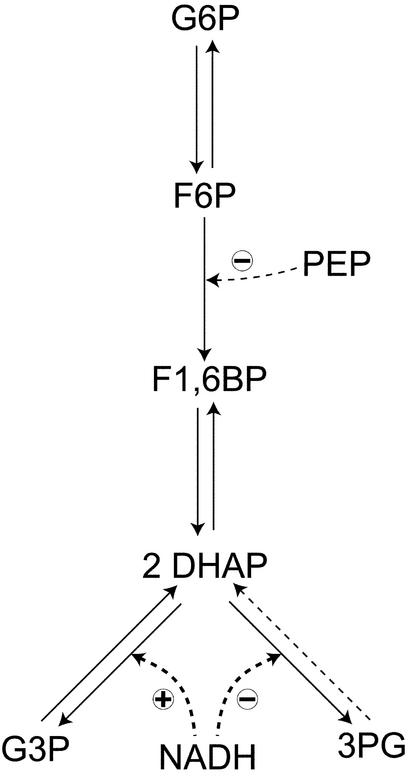
From the above deductions, a pathway can be suggested with the structure shown in Fig. 6. In summary, G6P is transformed into F6P, which in turn is irreversibly converted to F1,6BP. Subsequently, two molecules of DHAP are produced from one of F1,6BP in a fast reaction, which is likely to be close to equilibrium. DHAP undergoes two alternative transformations into either 3PG or G3P. Finally, NADH is involved in activation, as effector or substrate, on the branch producing G3P and in inhibition, as effector or substrate, on the other branch.
Figure 6.
Proposed reaction scheme based on experiments. Dashed lines with circles indicate that activation (+) or inhibition (−) may be effected by a metabolite either as a substrate or product, or as an effector. PEP, phosphoenolpyruvate.
Information obtained from propagation of pulses was supplemented with results from other experiments in which a concentration was varied over a long period. From such experiments, it was concluded that phosphoenolpyruvate (PEP) is an inhibitor of the enzyme mediating the conversion of F6P and F1,6BP, as it produced at a concentration of 0.5 mM increases of G6P and F6P, and decreases of F1,6BP, DHAP, G3P, and 3PG, which could be reverted by removing PEP when the system was at steady state (after 60 min). This result is also depicted in Fig. 6.
Conclusions
By applying a pulse method previously developed (8), we were able to establish the salient features of a part of glycolysis reconstituted in vitro. With respect to the species measured or pulsed, we note that the precision of the measurements is modest yet sufficient to obtain substantial information. Although for the application of the pulse method to an unknown or only partially known reaction mechanism we would of course use all information available in determining that mechanism, we restricted ourselves to employing the time courses obtained from the experiments. We did not use, for example, information on the chemical structure of the metabolites.
A single pulse of G6P was enough to determine the relative positions of most intermediates in the pathway. The method is advantageous in that one need not introduce pulses of all metabolites. For instance, we did not perturb F6P but were able to show that it follows G6P from G6P and F1,6BP pulses. It is also possible to apply the method to species that cannot be detected to ascertain their effects on the pathway. As an example, we did not attempt to measure the concentration of NADH. However, pulses of this species produced strong variations of the concentration of several metabolites. These results suggest the location of NADH in the pathway. In actual applications of the method, some information is likely to be available that can be used to confirm some results. For example, our conclusions that there are two branches and that NADH activates one and inhibits the other is consistent with standard knowledge on metabolic regulation. Nevertheless, such knowledge is not essential, and we did not use it to deduce the branched structure of the pathway, refraining even from mass balance considerations.
Fast reactions (compared with others) are difficult to detect by this method because the response of the metabolites involved tends to occur simultaneously. However, such responses may affect stoichiometry, especially in branching points. We have shown that this fact can be inferred from the method, as we observed that two molecules of DHAP are produced per molecule of F1,6BP.
Acknowledgments
We thank Prof. Richard N. Zare for a useful suggestion regarding the title. This work was supported in part by the National Science Foundation and the National Institutes of Health (HG00205). A.S.T. is a recipient of a fellowship from the Training for Academic Positions program of the Ministerio de Educación, Cultura y Deporte of Spain.
Abbreviations
- G6P
glucose 6-phosphate
- F6P
fructose 6-phosphate
- F1,6BP
fructose 1,6-bisphosphate
- DHAP
dihydroxyacetone 3-phosphate
- GAP
glyceraldehyde 3-phosphate
- G3P
glycerol 3-phosphate
- 3PG
3-phosphoglycerate
- CSTR
continuous-flow, stirred-tank reactor
References
- 1.Ross J, Vlad M O. Annu Rev Phys Chem. 1999;50:51–78. doi: 10.1146/annurev.physchem.50.1.51. [DOI] [PubMed] [Google Scholar]
- 2.Gilman A, Ross J. Biophys J. 1995;69:1321–1333. doi: 10.1016/S0006-3495(95)79999-4. [DOI] [PMC free article] [PubMed] [Google Scholar]
- 3.Tsuchiya T, Ross J. J Phys Chem A. 2001;105:4052–4058. [Google Scholar]
- 4.Arkin A, Ross J. J Phys Chem. 1995;99:970–979. [Google Scholar]
- 5.Samoilov M, Arkin A, Ross J. Chaos. 2001;11:108–114. doi: 10.1063/1.1336499. [DOI] [PubMed] [Google Scholar]
- 6.Shen P, Hauri D, Ross J, Oefner P. J Cap Electr. 1996;3:155–163. [PubMed] [Google Scholar]
- 7.Arkin A, Shen P, Ross J. Science. 1997;277:1275–1279. [Google Scholar]
- 8.Vance W, Arkin A, Ross J. Proc Natl Acad Sci USA. 2002;99:5816–5821. doi: 10.1073/pnas.022049699. [DOI] [PMC free article] [PubMed] [Google Scholar]
- 9.Tyson J. J Chem Phys. 1975;62:1010–1015. [Google Scholar]
- 10.Chevalier T, Schreiber I, Ross J. J Phys Chem. 1993;97:6776–6787. [Google Scholar]
- 11.Mihalik E, Skodt H, Hinne F, Sorenson P G, Showalter K. J Phys Chem A. 1999;103:8246–8251. [Google Scholar]
- 12.Altria K D. Chromatographia. 1993;35:177–182. [Google Scholar]
- 13.Teusink B, Passarge J, Reijenga C A, Esgalhado E, van der Weijden C C, Schepper M, Walsh M C, Bakker B M, van Dam K, Westerhoff H V, Snoep J L. Eur J Biochem. 2000;267:5313–5329. doi: 10.1046/j.1432-1327.2000.01527.x. [DOI] [PubMed] [Google Scholar]


