Abstract
We evaluate the impact of anthropogenic and natural NOx sources over the contiguous United States on tropospheric NOx and O3 levels by using a global 3D chemical transport model. The effects of major U.S. surface NOx emission sources (including anthropogenic, biomass burning, and soil emissions) are compared with that of lightning-produced NOx. Summer lightning is shown to play a dominant role in controlling NOx and O3 concentrations in the middle and upper troposphere, despite the fact that fossil-fuel burning represents the largest source of NOx over the U.S. Furthermore, the effect of regional U.S. lightning is propagated through large areas of the Northern Hemisphere by atmospheric circulation. The results reveal that a thorough assessment of atmospheric NOx emission sources and their impact is required to devise control strategies for regional and global air pollution.
Nitrogen oxides (NOx = NO + NO2) are atmospheric catalysts that are related to ozone and hydroxyl radicals (1–3). The abundance of NOx regulates the atmospheric oxidizing power and global biogeochemical cycles (4, 5). In the troposphere, NOx is closely related to the ozone chemistry via two separate processes. In regions of high NOx concentrations ozone is produced photochemically in the cycling of NO to NO2, which is facilitated by peroxy radicals formed during oxidation of carbon monoxide, methane, and volatile organic compounds, whereas in regions of low NOx concentrations ozone is catalytically destroyed. Nitrogen oxides are also intricately linked to the hydroxyl radical OH, another key atmospheric oxidizing species. The reaction between NO2 and OH leads to the formation of relatively stable nitric acid HNO3, which can be removed from the atmosphere by precipitation and provides fixed nitrogen for the biosphere. Also, because O3 absorbs strongly the Earth's IR radiation, knowledge of the regional and global NOx distribution is important for climate studies (6).
NOx is emitted into the atmosphere from natural and anthropogenic sources, i.e., from fossil fuel combustion, biomass burning, oxidation of atmospheric ammonia, and lightning (3, 7). Transport of NOx from the stratosphere and aircraft emissions could also be important sources in the upper troposphere (8, 9). Over the contiguous U.S., anthropogenic emissions from fossil-fuel burning of automobiles, power plants, or industries constitute the main source of NOx, with an estimated production of 7.3 Tg N yr−1 (1 Tg = 1012 g) (10, 11). Other NOx emission sources over the U.S. include biomass burning and soil release, which are about 0.3 and 0.5 Tg N yr−1, respectively (10, 11). Lightning accounts for ≈5% of the total U.S. NOx emissions (0.4 Tg N yr−1) and the lightning emission increases in the summer, reaching ≈14% of the total emission in July (7). Compared with the global NOx emission of 32 Tg N yr−1 (with 21 Tg N yr−1 attributed to fossil-fuel burning) (10, 11), the U.S. contributes to a significant fraction of the world's total anthropogenic NOx production.
In this study we assess the impacts of anthropogenic and natural NOx sources over the continental United States on tropospheric chemistry by using a 3D global numerical model, Model of Ozone and Related Chemical Tracers (mozart, version 2) (12). The tropospheric budgets of NOx and O3 are analyzed to determine the relative contributions of the various NOx sources over the U.S.
Methods
The meteorological data for mozart is produced from the output of the National Center for Atmospheric Research community climate model (12). mozart accounts for advection, convection, cloud formation, diffusive exchanges, gas phase and heterogeneous chemistry, photochemical transformations, wet deposition, and dry deposition processes. mozart includes biogenic emissions of chemicals such as isoprene, carbon monoxide emissions from the ocean surface, and aircraft emissions of NOx. The global and U.S. NOx surface emissions (i.e., from anthropogenic activity, biomass burning, and soil release) are taken from recent compilations by Olivier and colleagues (10, 11). NOx production by lightning over the U.S. is based on ground- and satellite-based lightning measurements (7). Monthly cloud-to-ground (CG) flashes are obtained by averaging the National Lightning Detection Network (NLDN) data over the 5-year period 1995–1999, and intracloud (IC) flashes are obtained from the observed geographical distribution of the IC/CG ratio based on NLDN and satellite optical transient detector (OTD) measurements. The IC and CG flashes are distinguished according to the procedure described in refs. 7, 13, and 14. IC flashes are believed to have significantly lower energies than CG flashes and hence have a lower NOx production efficiency (15). Lightning production outside the U.S. is based on parameterization developed by Price et al. (15) and satellite observation from OTD (13). The annual production of NOx by lightning used in this study are 0.4 and 7.0 Tg N yr−1 over the U.S. and the whole globe, respectively. Lightning-produced NOx is distributed uniformly within the vertical extent of the convective clouds. The distributions of lightning-produced NOx are slightly extrapolated to coincide with the modeled convective cloud distributions. The uncertainty of NOx production by lightning has been evaluated in our previous studies (7).
Results and Discussion
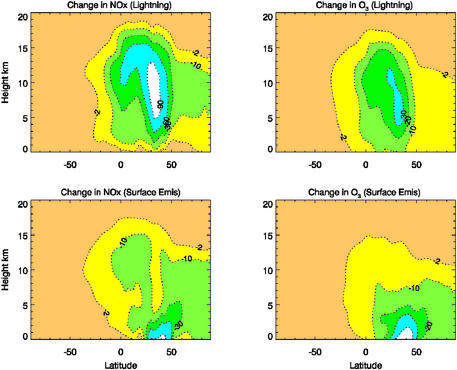
To assess the importance of the various NOx sources over the U.S. on tropospheric chemistry, we simulate the concentrations of NOx and O3 by using mozart. Three model runs are considered: (i) with both lightning and surface (including anthropogenic, biomass burning, and soil release) emission sources of NOx, (ii) without the lightning source, and (iii) without the surface emission sources within the boundaries of the continental U.S. Fig. 1 illustrates the zonally averaged percentage changes in NOx and O3 concentrations in July calculated because of lightning or surface emission sources. The lightning impact is determined by subtracting the concentrations derived by model run ii from those of model run i (Fig. 1 Upper). Similarly, the surface emission impact is evaluated by using the results from the difference of model runs iii and i (Fig. 1 Lower). Lightning has a significant impact on the concentration of NOx in the middle and upper troposphere. Between 5 and 15 km inclusion of lightning NOx production leads to a change of >90% in the NOx concentration between 30° and 40° N. The model results also indicate that the impact of U.S. lightning is propagated throughout the Northern Hemisphere and into the Southern Hemisphere. A change of >60% in the NOx concentration occurs at 10–12 km near the equator, and a change of >30% extends as far as 10° S at 12 km. On the other hand, the impact of the U.S. surface NOx sources is important only in the lower troposphere (<5 km). In July lightning also strongly affects upper tropospheric O3, resulting in a change of 30% or more in the ozone concentration from 4 to 12 km within 30–40° N. An area of >20% changes extends across the equator at 10 km. As is the case with NOx, the influence of surface NOx sources on O3 is limited primarily at lower levels.
Figure 1.
Zonally averaged percentage changes in NOx and O3 concentrations caused by lightning (Upper) and surface (Lower) NOx emissions (see text). Results are averaged over the month of July and the longitudes correspond to the continental U.S. (75–125° W).
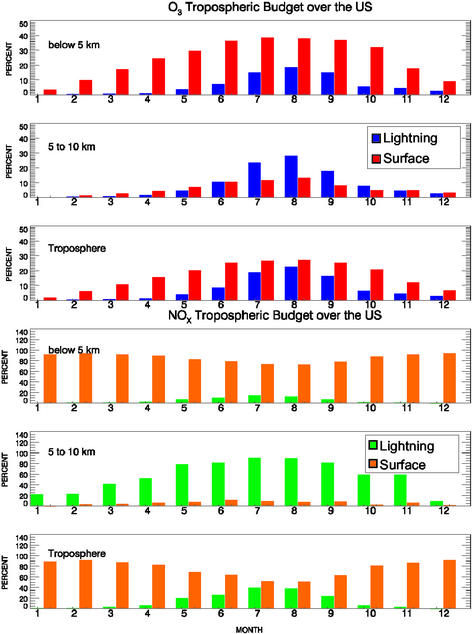
To quantify the relative importance of lightning and surface NOx emissions over the U.S., monthly budget analyses are performed by computing the column mass-weighted percentage changes in concentrations of NOx and O3, depicted in Fig. 2. The summations are calculated for the latitudinal and longitudinal domain of the continental U.S. over three altitude ranges: 0–5 km (lower troposphere), 5–10 km (upper troposphere), and 0–10 km (entire troposphere). In the lower troposphere, contribution of lightning to the NOx budget peaks at ≈20% in the summer months and diminishes in the winter; throughout the year anthropogenic emissions dominate the NOx budget. In the upper troposphere, however, the lightning impact is significant in the spring, summer, and fall, i.e., >50% from April to November and ≈90% in July and August. In July and August, the entire tropospheric NOx budget is nearly equally contributed by lightning and surface sources. In the O3 analysis, the influence of lightning is at least equal to that of surface emissions from June to November and is twice as large from July to September in the upper troposphere. The largest lightning impact on the upper tropospheric O3 budget reaches ≈30% in August. Below 5 km O3 production is dominated by surface NOx emissions, with the lightning contribution reaching 20% in August. Over the entire troposphere, lightning and surface NOx emissions account for comparable O3 production in July and August. Note that, in addition to ozone production caused by NOx, transport and chemical processing also strongly affect tropospheric O3, including stratospheric injection, horizontal advection, and in situ chemical production/destruction.
Figure 2.
Source influences on NOx and O3 budgets. The y axis represents the mass-weighted percentage change in concentrations summed vertically over the altitudes and horizontally over the contiguous U.S. domain (30–50° N and 75–125° W). In the NOx panels, green columns represent lightning emission and orange columns represent the surface emissions (i.e., anthropogenic, biomass burning, and soil). In the O3 panels, the lightning case is shown in blue and the surface emission case is in red. Months are shown on the x axis with 1 denoting January and 12 denoting December. The troposphere panels correspond to the altitudes between 0 and 10 km.
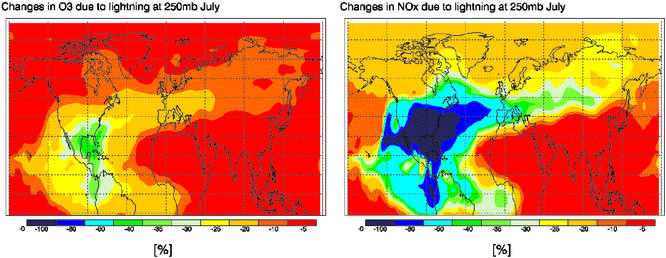
The horizontal extent of influence exerted by U.S. lightning is depicted in Fig. 3, showing the percentage changes in NOx (Right) and O3 (Left) concentrations at the 250-mbar level averaged for the month of July. At this level, NOx concentrations over the U.S. and other large areas of the Northern Hemisphere are noticeably controlled by lightning. An area of 25–60% influence extends across Europe and into Asia. U.S. lightning also has a significant influence on O3 concentrations for much of the Northern Hemisphere. There is 25–40% influence on the O3 concentrations over the entire Gulf of Mexico and a large area of the Atlantic Ocean east of the U.S. Influence of at least 20% extends across the Atlantic Ocean into Europe.
Figure 3.
Lightning impact on O3 and NOx at 250 mbar in July. Shown are percentage changes in NOx (Right) and O3 (Left) concentrations at the 250-mbar level averaged for the month of July.
The dominance of lightning in controlling summertime NOx and O3 in the middle and upper troposphere is unexpected, considering the fact that lightning accounts for only a small fraction of the total NOx emission over the U.S (7). The main difference between lightning and surface NOx sources lies in the vertical distribution of the emissions. Lightning consists of both CG and IC flashes: a typical CG flash extends vertically up to 8 km, whereas a representative IC flash occurs at ≈6–10 km (16). Hence lightning directly deposits NOx in the free troposphere. In contrast, NOx emissions from anthropogenic activity, biomass burning, and soil are released within the atmospheric planetary boundary layer (PBL). Because the lifetime of NOx varies considerably with altitude, being only a few hours near the PBL and up to a few days in the upper troposphere (17, 18), NOx emitted directly in the mid and upper troposphere is more efficient in influencing NOx and producing ozone in that region. In addition, emissions of lightning and surface NOx sources are seasonally and geographically different. Lightning occurs primarily in the southeast portion of the U.S. in the summer, whereas anthropogenic NOx is emitted in many urban areas throughout the country and the year. Surface NOx emissions do not always coincide with the convective process. Our model calculations indicate that surface NOx emissions indeed contribute to the NOx and O3 budgets in the upper troposphere (Fig. 3), consistent with the notion that convection associated with thunderstorms transports chemical compounds from the polluted PBL (19). However, such a process may experience a significant dilution with ambient air before reaching the mid or upper cloud region (20). Field and satellite observations show that near mature convective storms in the subtropical and mid-latitude regions lightning is primarily responsible for a significant NOx enhancement in the upper troposphere (21–23).
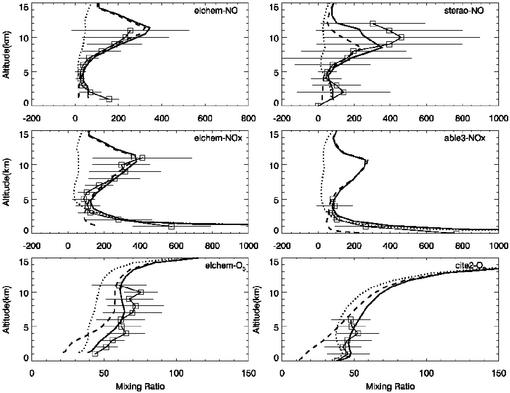
Several field campaigns in North America measured the concentrations of NO, NOx, and O3 (24). The field campaigns considered in the present study cover the following spatial and temporal ranges: Elchem, July 27-August 22, 1989, 30–35° N and 110–105° W; Sterao, June 26-July 16, 1996, 39–42° N and 78–74° W; Able3, July 6-August 15, 1990, 35–45° N and 80–70° W; and Cite2, August 11-September 5, 1986, 35–45° N and 125–110° W. The observed vertical mixing ratio profiles of NO, NOx, and O3 (averaged over the duration of the studies) are compared with the corresponding concentrations calculated by model runs for the same time period and location in Fig. 4. Inclusion of lightning NOx production in the model is essential to reproduce NO and NOx enhancement in the upper troposphere. For the field campaign conducted along the heavily populated Northeast of the U.S. (Able3), the inclusion of surface NOx sources is necessary to bring agreement between the modeled and measured NOx concentrations in the lower atmosphere. The model simulations including both lightning and surface NOx emissions produce O3 concentrations that are consistent with the field observations, but removal of the surface emissions leads to an underpredicted O3 in the lower troposphere. The good agreement between modeled and measured concentrations of NOx, NO, and O3 hence validates the treatment of the various NOx emissions in our model simulations.
Figure 4.
Vertical mixing ratio profiles of NO, NOx, and O3 from model results and aircraft observations. The solid line with symbols shows the averages of concentrations observed from aircraft during the field studies. The horizontal lines represent the standard deviations of the observations. The solid line without symbols shows the concentrations calculated in model run i. Similarly, the dotted line represents model run ii, and the dashed line corresponds to model run iii.
Conclusions
In this article we have assessed the impact of anthropogenic and natural NOx sources over the contiguous U.S. on tropospheric NOx and O3 levels by using a global 3D chemical transport model. The results provide a quantitative assessment of the impacts of regional lightning over the U.S. on tropospheric chemistry, unambiguously establishing that summer lightning over the U.S. plays a surprising role in controlling NOx and O3 concentrations in the middle and upper troposphere. There have been intensive debates on NOx emissions and control regulations among the scientific and industrial communities and at the political decision-making level (Intergovernmental Panel on Climate Change, Summary for Policymakers by Working Group 1, www.ipcc.ch). A reduction in fossil-fuel combustion leads to a lesser amount of tropospheric ozone precursors and can be essential to abate urban air pollution. In particular, the U.S. produces a significant fraction of the world anthropogenic NOx emission (≈33%). Our model calculations confirm that fossil-fuel combustion over the U.S. contributes overwhelmingly to the NOx budget and exacerbates O3 formation in the lower troposphere. On the other hand, the results reveal that summer lightning over the U.S. dominates the NOx budget in the middle and upper troposphere and strongly affects regional and global O3 production. Hence a comprehensive assessment of the atmospheric NOx emission sources and their impact is required to devise control strategies for regional and global air pollution. Furthermore, there is now increasing evidence that cloud electrification is inadvertently modified because of urbanization and air pollution (25), leading to significantly more lightning flashes. Such enhanced lightning could exert profound effects on the tropospheric oxidizing power, global biogeochemical cycles, and the climate.
Acknowledgments
We thank Prof. Robert A. Duce for helpful comments on this manuscript. This research was partially supported by the National Aeronautics and Space Administration New Investigator Program in Earth Science and the Texas Air Research Center. The National Center for Atmospheric Research is supported by the National Science Foundation.
Abbreviations
- CG
cloud-to-ground
- IC
intracloud
References
- 1.Crutzen P J. Q J R Meterol Soc. 1970;96:320–327. [Google Scholar]
- 2.Thompson A M. Science. 1992;256:1157–1165. doi: 10.1126/science.256.5060.1157. [DOI] [PubMed] [Google Scholar]
- 3.Seinfeld J H, Pandis S N. Atmospheric Chemistry and Physics: From Air Pollution to Global Change. New York: Wiley; 1998. [Google Scholar]
- 4.Schlesinger W H. Biogeochemistry. New York: Academic; 1997. [Google Scholar]
- 5.Navarro-Gonzalez R, Mckay C P, Mvondo D N. Nature. 2001;412:61–63. doi: 10.1038/35083537. [DOI] [PubMed] [Google Scholar]
- 6.Ramanathan V, Dickinson R E. J Atmos Sci. 1979;36:1084–1104. [Google Scholar]
- 7.Bond W D, Zhang R, Tie X, Brasseur G, Huffines G, Orville R E, Boccippio D J. J Geophys Res. 2001;106:27701–27710. [Google Scholar]
- 8.Lamarque J F, Brasseur G P, Hess P G, Muller J F. J Geophys Res. 1996;101:22995–22968. [Google Scholar]
- 9.Penner J E, Lister D H, Griggs D J, Dokken D J, McFarland M, editors. Aviation and the Global Atmosphere: A Special Report of IPCC Working Groups I and III. New York: Cambridge Univ. Press; 1999. [Google Scholar]
- 10.Olivier J G J, Bouwman A F J, Berdowski J M, Veldt C, Bloos J P J, Visschedijk A J H, van der Maas C W M, Zandveld P Y J. Description of EDGAR Version 2.0: A Set of Global Emission Inventories of Greenhouse Gases and Ozone-Depleting Substances for All Anthropogenic and Most Natural Sources on a Per-County Basis and on a 1′1 Degree Grid, RIVM Report 771060 002/TNO-MEP Report R96/119. Bilthoven, The Netherlands: National Institute for Public Health and the Environment; 1996. [Google Scholar]
- 11.Olivier J G J, Bouwman A F, Van der Maas C W M, Berdowski J J M, Veldt C, Bloos J P J, Visschedijk A J H, Zandveld P Y J, Haverlag J L. Environ Sci Policy. 1999;2:241–264. [Google Scholar]
- 12.Brasseur G P, Hauglustaine D A, Walters S, Rasch P J, Müller J F, Granier C, Tie X. J Geophys Res. 1998;103:28265–28289. [Google Scholar]
- 13.Nesbitt S W, Zhang R, Orville R E. Tellus B. 2000;52:1206–1215. [Google Scholar]
- 14.Bond D W, Steiger S, Zhang R, Tie X, Orville R E. Atmos Environ. 2002;36:1509–1519. [Google Scholar]
- 15.Price C, Penner J, Prather M. J Geophys Res. 1997;102:5929–5941. [Google Scholar]
- 16.Uman M A. The Lightning Discharge. San Diego: Academic; 1987. [Google Scholar]
- 17.Tie X, Zhang R, Brasseur G, Emmons L, Lei W. J Geophys Res. 2001;106:3167–3178. [Google Scholar]
- 18.Tie X, Zhang R, Brasseur G, Lei W. J Atmos Chem. 2002;43:61–74. [Google Scholar]
- 19.Dickerson R R, Huffman G J, Luke W T, Nummermacker L J, Pickering K E, Leslie A C D, Lindsey C G, Slinn W G N, Kelley T J, Daum P H, et al. Science. 1987;235:460–464. doi: 10.1126/science.235.4787.460. [DOI] [PubMed] [Google Scholar]
- 20.Telford J W, Chai S K. J Appl Meterol. 1993;32:700–715. [Google Scholar]
- 21.Ridley B A, Dye J E, Ealega J G, Zheng J, Grahek F E, Rison W. J Geophys Res. 1996;101:20985–21005. [Google Scholar]
- 22.Huntrieser H, Schlager H, Feigl C, Holler H. J Geophys Res. 1999;103:28247–28264. [Google Scholar]
- 23.Zhang R, Sanger N T, Orville R E, Tie X, Randel W, Williams E R. Geophys Res Lett. 2000;27:685–688. [Google Scholar]
- 24.Bradshaw J, Davis D, Grodzinsky G, Smyth S, Newell R, Sandholm S, Liu S. Rev Geophys. 2000;38:61–116. [Google Scholar]
- 25.Orville R E, Huffines G, Nielsen-Gammon J, Zhang R, Ely B, Steiger S, Philips S, Allen S, Read W. Geophys Res Lett. 2001;28:2597–2600. [Google Scholar]


