Abstract
Despite the potentially profound impact of genetically modified crops on agriculture and the environment, we know little about their long-term effects. Transgenic crops that produce toxins from Bacillus thuringiensis (Bt) to control insects are grown widely, but rapid evolution of resistance by pests could nullify their benefits. Here, we present theoretical analyses showing that long-term suppression of pest populations is governed by interactions among reproductive rate, dispersal propensity, and regional abundance of a Bt crop. Supporting this theory, a 10-year study in 15 regions across Arizona shows that Bt cotton suppressed a major pest, pink bollworm (Pectinophora gossypiella), independent of demographic effects of weather and variation among regions. Pink bollworm population density declined only in regions where Bt cotton was abundant. Such long-term suppression has not been observed with insecticide sprays, showing that transgenic crops open new avenues for pest control. The debate about putative benefits of Bt crops has focused primarily on short-term decreases in insecticide use. The present findings suggest that long-term regional pest suppression after deployment of Bt crops may also contribute to reducing the need for insecticide sprays.
Genetically engineered crops have quickly become a significant component of agriculture, but little is known about their long-term consequences. Transgenic cultivars of cotton and maize that produce toxins from Bacillus thuringiensis (Bt) to control insect pests were grown on 12 million hectares worldwide during 2001 (1). A major concern is that rapid evolution of resistance by pests could nullify the benefits of Bt crops (2–6). It has also been proposed, however, that Bt crops imposing high mortality could cause regional suppression of target pests before resistance occurs (6–9). This would be most likely for target pests with a narrow host range, because their diet would be affected most by Bt crops. Here we report results of a large-scale 10-year study revealing that extensive use of Bt cotton in Arizona caused regional suppression of pink bollworm (Pectinophora gossypiella), an ecological specialist on cotton (10).
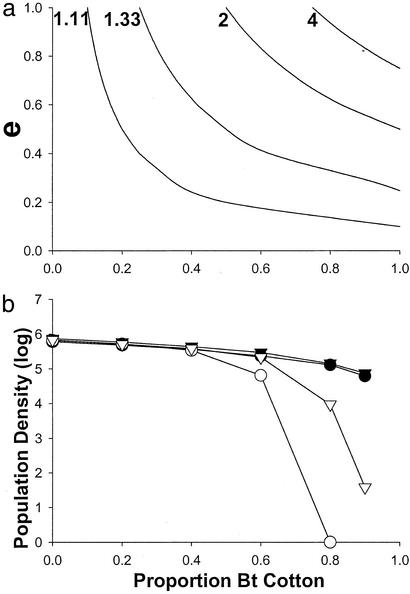
Pink bollworm moths emerge in the spring, and four to five generations are completed before winter diapause begins (10). Population growth is exponential in non-Bt cotton fields where the pink bollworm is virtually always present. Survival of pink bollworm larvae is <0.5% in Bt cotton fields (3). We hypothesized that regional declines in pink bollworm density would occur because deployment of Bt cotton reduces the number of source habitats (non-Bt cotton fields) and the net reproductive rate of migrants from source habitats. Accordingly, we expected a density decline in regions where a threshold use of Bt cotton was exceeded (Fig. 1). To test this hypothesis, we evaluated changes in pink bollworm population density related to abundance of Bt cotton in each of 15 cotton-growing regions in Arizona during the 5 years before and the 5 years after deployment of Bt cotton.
Figure 1.
Effect of Bt crop abundance on population density in a deterministic (a) and spatially explicit, stochastic (b) model. (a) Density decreases at values of emigration (e) and proportion of Bt cotton above and to the right of the curves associated with each value of Ro (net reproductive rate). Ro values are shown to the left of each curve. For example, with Ro = 1.11 and e = 0.2, density decreases if proportion of Bt cotton exceeds 0.5 (Eq. 5). (b) Density 3 years after deployment of Bt cotton. Declines in density were associated with reductions in insecticide sprays. F represents female daily fecundity and e represents adult emigration rate from natal fields. With e = 0.1, 10% of the moths emigrated mainly to contiguous fields. With e = 0.9, 90% of the moths dispersed up to four fields away. Symbols represent average population density for two simulations. Filled circles: F = 8, e = 0.1; open circles: F = 8, e = 0.9; filled triangles: F = 12, e = 0.1; open triangles: F = 12, e = 0.9.
Materials and Methods
Pheromone Trapping.
We used pheromone traps to monitor pink bollworm overwintering population density during spring from 1992 to 2001 across 15 cotton-growing regions (412–4,350 km2 per region) in Arizona. Pheromone trap catch in the spring reflects population density later in the season (10, 11). More than 1,100 pheromone traps were set near cotton fields each year across the 15 regions (12, 13). Trapping started after an accumulation of 500 heat units. Cumulative trap catch up to an accumulation of 1,900 heat units was used to estimate density of the first overwintering generation (13). For each region and year, traps that had more than three missing records were excluded. In a given year, only regions with records for more than nine traps were considered (range, 10–340). After applying these criteria, the mean number of traps included in the analyses per year was 855.
Weather Data.
Evapotranspiration measures the amount of rainfall returned to the atmosphere, which increases as temperature and precipitation increase (14). Evapotranspiration data were obtained from meteorological stations located in each of the regions (15). From 1991 to 2000, we calculated cumulative evapotranspiration occurring between November 1 and January 31 (winter) and between February 1 and March 31 (spring). These periods respectively correspond to larval diapause in the soil and onset of moth emergence (16, 17). Although some moths start to emerge from diapause in February–March, most moth emergence occurs in April–May in Arizona (16, 17).
Deployment of Bt Cotton.
The proportion of Bt cotton used between 1992 and 1995 was essentially 0 in all regions. Bt cotton was used on a large scale for the first time in Arizona in 1996. Geographic Information System (GIS) technology was used to measure the proportion of Bt cotton in the regions from 1998 to 2000 (12). The correlation between the proportion of Bt cotton used in the regions between 1998 and 1999 and 1999 and 2000 was very high (r = 0.99 and 0.92, respectively; P < 0.0001 in each case). Thus, among-region differences in use of Bt cotton were stable from year to year. No GIS maps were available to evaluate the proportion of Bt cotton used in 1996 and 1997. The average proportion of Bt cotton used in Arizona in 1996, 1997, and 1998 was 20, 50, and 56%, respectively (4, 18). We thus estimated the proportion of Bt cotton in each region in 1996 and 1997 by multiplying the 1998 proportions obtained from the GIS map by 0.35 (i.e., 0.20/0.56) and 0.89 (i.e., 0.50/0.56), respectively. This assumes that the among-region differences in use of Bt cotton remained stable between 1996 and 1998.
Multiple Regression Analysis.
Overwintering density was estimated by averaging the number of moths captured per week in pheromone traps in each region and year. Statistical independence among regions was assessed with the observed Pearson correlation coefficients between overwintering densities (log transformed) in all pairs of regions. Data for years preceding deployment of Bt cotton and regions with more than four density estimates were used to estimate the correlation coefficients. Six of 45 (i.e., 0.13) correlation coefficients had an associated P value of ≤0.10. This proportion is similar to the expected Type 1 error rate, suggesting that yearly changes in overwintering density occurred independently in the regions.
Multiple regression was used to analyze variation in overwintering density (log transformed): the explanatory variables were region, evapotranspiration in the winter and spring preceding moth emergence, and proportion of Bt cotton (arcsine square root transformed) in the year preceding emergence. Nonparametric run tests were used to assess the potential lack of independence that could result from serial correlation in the residuals within a region (19, 20). The nonparametric tests were performed only for regions with data for 8 or more consecutive years. No lack of independence was detected within any region (n = 9, all P > 0.17), and hence no adjustment for serial correlation was needed in the multiple regression analysis.
Population Dynamics Models.
Deployment of a Bt crop directly reduces the number of source habitats (non-Bt crop fields) for pest specialists. Moreover, many pests, including the pink bollworm, do not discriminate for oviposition between Bt and non-Bt cultivars (21). Thus, when transgenics are abundant, females emigrating from a source habitat have a higher probability of laying eggs in sink habitats (Bt crop fields). To understand how these two mechanisms reduce population density, we analyzed a simplified deterministic model and a spatially explicit, biologically rich, stochastic model.
Deterministic model.
Following basic metapopulation models, we assume that all fields are identical and equally connected to each other (22, 23). Transgenic systems are fine-grained: a refuge of a non-Bt crop is planted near every field of a Bt crop. Thus, we assume that increased habitat fragmentation due to deployment of a Bt crop does not affect extinction and colonization of non-Bt crop fields. Population growth is density independent, and generations are discrete and continuous (i.e., no diapause). Hence, the number of adult pests in a non-Bt crop field at time t + 1 (Nt+1) depends on population size at time t (Nt), the net reproductive rate (Ro) in a non-Bt crop field, the proportion of females emigrating from a non-Bt crop field before reproduction (or the proportion of eggs laid outside the non-Bt crop field) (e), the total number of fields in the region (NF), and the proportion of fields planted to the non-Bt crop (pnon):
 |
1 |
 |
Rearranging, we obtain
 |
2 |
Because 1 − pnon is the proportion of fields planted to a Bt crop (pBt), this simplifies to
 |
3 |
Thus, the proportion of females that move to Bt crop fields (Nt Ro e pBt) reduces population size in a non-Bt crop field at time t + 1 (Nt Ro). Substitution and rearrangement show that the change in population size from t to t + 1 is
 |
4 |
Given that Nt is >0, the direction of change in density depends on [Ro (1 – e pBt) – 1]. If this term is >0, population size increases; if it equals 0, the population is stable; and if it is <0, population size decreases. Rearranging, population size decreases if
 |
5 |
Thus, population size in a non-Bt crop field is more likely to decrease as abundance of a Bt crop and the emigration rate increase and as the net reproductive rate decreases. Specifically, population size decreases if pBt is greater than the threshold value indicated in Eq. 5.
This analysis extends to population size of an entire region by multiplying the change in Eq. 4 by the number of non-Bt crop fields in the region. Thus, the term in brackets [Ro (1 – e pBt) – 1] determines the direction of change in regional population size, whereas the rate of change also depends on the number of non-Bt crop fields and the population size in a non-Bt crop field at time t (F pnon Nt).
Stochastic model.
As in similar spatially explicit models (24, 25), the patchwork of Bt and non-Bt cotton fields are represented as a lattice of 100 fields on a 10 × 10 grid. Adult and larval survival are parameterized according to pink bollworm life history. Generations are continuous, time is incremented by day, and insect development and plant phenology are driven by accumulation of degree-days. Temperature on each day is based on daily averages recorded between 1961 and 2001 in Maricopa County, AZ (15). Adults move between fields once after emergence. Movement is described by a bivariate normal distribution with mean zero and a standard deviation proportional to dispersal potential. Females lay a specified number of eggs each day. Density-independent mortality of larvae takes place immediately after eggs are laid and density-dependent mortality occurs after the number of larvae exceeds an economic threshold. If a field exceeds the threshold, an insecticide targeting eggs and adults is sprayed. Overwintering mortality occurs at the end of the year after completion of five generations.
Simulations are initiated by letting the model run for 4 years with no Bt cotton to allow population dynamics to settle. At the start of year 5, a specified proportion of the fields are planted with Bt cotton. The number of overwintering individuals surviving in each field and the total number of insecticide sprays per non-Bt cotton field are recorded for the next 3 years.
Results and Discussion
Temperature and rainfall can affect pink bollworm overwintering survival (26). We therefore used multiple regression to assess the association between regional spring density and four explanatory variables: region, evapotranspiration in the winter preceding moth emergence, evapotranspiration in the spring preceding moth emergence, and regional abundance of Bt cotton in the year preceding moth emergence. Density of the first spring generation varied among regions during the 10 years (df = 14 and 109, F = 2.64, P = 0.0025), indicating that among-region differences other than variation in weather and use of Bt cotton affected pink bollworm density. Density was negatively associated with winter evapotranspiration (slope = −0.051, t = −2.12, P = 0.036) and positively associated with spring evapotranspiration (slope = 0.058, t = 2.47, P = 0.015). Thus, winters colder and drier or springs warmer and wetter than usual were associated with the largest overwintering populations. Independent of variation among regions and in weather, a negative association occurred between the regional proportion of Bt cotton and regional pink bollworm density in the next year (slope = −0.19, t = −3.40, P = 0.0009). This suggests that deployment of Bt cotton reduced pink bollworm density.
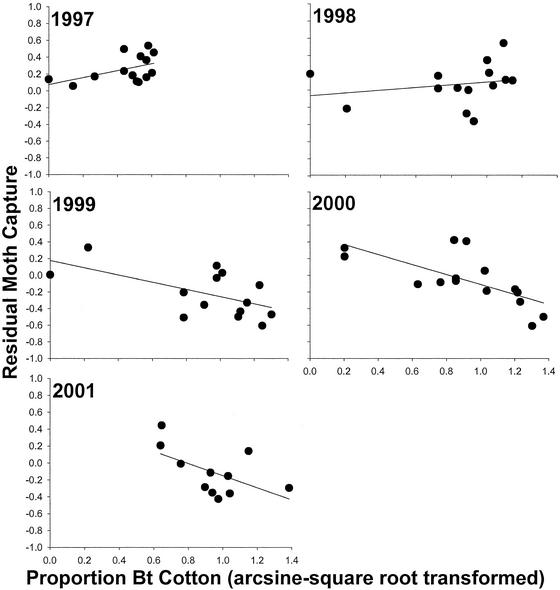
To further investigate this possibility, we fitted a new multiple regression model, this time including only region, winter evapotranspiration, and spring evapotranspiration as explanatory variables. Residuals from this model represent regional population density estimates from which the effects of region and weather have been removed. Bt cotton was relatively rare in 1996 (Fig. 2), the first year that transgenics were commercialized in Arizona. The association between regional use of Bt cotton in 1996 and residual density in 1997 was positive. Thus, Bt cotton used in 1996 did not have negative demographic effects in the next year. Rather, the positive residuals in all regions indicate that after accounting for weather and regional effects, pink bollworm was unusually common across Arizona in 1997. In the high-density regions, the proportion of Bt cotton roughly doubled from 1996 to 1997 and remained high thereafter (Fig. 2). The slope of the regression between use of Bt cotton in 1997 and density in 1998 was not different from zero, indicating that negative effects on population growth had started in regions where transgenics were most abundant (Fig. 2). Deployment of Bt cotton from 1998 to 2000 was negatively associated with residual density in the next year. Thus, extensive use of Bt cotton reduced pink bollworm population growth.
Figure 2.
Linear regression between regional proportion of Bt cotton (arcsine square root transformed) in a year and residual moth capture (see text) in the next year. Fewer than 15 regions were included in all years except 2000, because <10 pheromone traps had valid data in at least one of the regions. No data on cotton use in 2000 were available for the two regions with the lowest abundance of Bt cotton. Slopes and associated P values from 1997 to 2001 are, respectively: 0.41, P = 0.086; 0.16, P = 0.45; −0.43, P = 0.027; −0.60, P = 0.0037; and −0.71, P = 0.072.
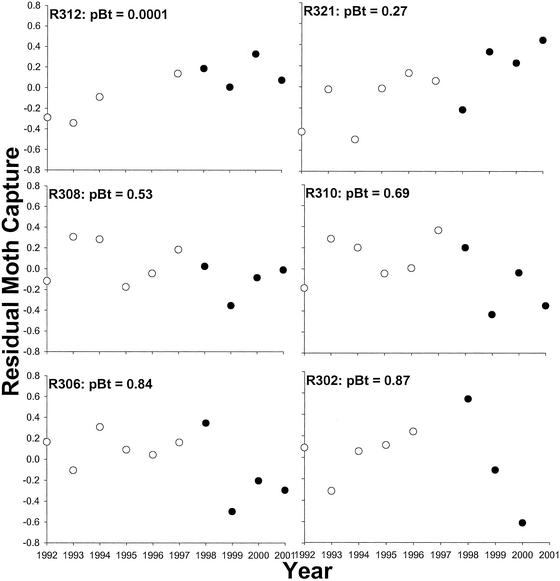
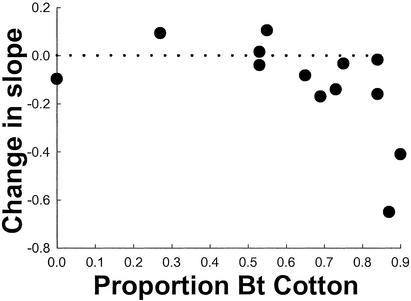
To evaluate the effect of Bt cotton on regional population trajectory, we compared least-squares estimates of the slope between residual density and year in each region (Fig. 3) for the period before (1992–1997) and after (1998–2001) initiation of the reductions in population growth (Fig. 2). The difference between the before and after slope in each region evaluates the extent of change in population growth resulting from deployment of Bt cotton. For example, in region 321, where Bt cotton was rare (Fig. 3), the slope was 0.096 before and 0.19 after. The increase in slope (0.094) indicates that use of Bt cotton did not reduce population growth in that region. In contrast, the slope decreased by 0.65 in region 302, where Bt cotton was abundant, indicating a large reduction in population growth there (Fig. 3). The association between the change in slope and regional use of Bt cotton is well described with a quadratic model (Fig. 4). Thus, consistent with predictions from models (Fig. 1), negative effects on population growth occurred only in regions where Bt cotton was used most.
Figure 3.
Association between residual moth capture (see text) and year for six representative regions. Average proportion of Bt cotton from 1997 to 2000 (pBt) is shown for each region. Open and filled symbols, respectively, represent years before and after initiation of reductions in population growth (see text).
Figure 4.
Association between regional proportion of Bt cotton (pBt as in Fig. 3) and change in population growth. The dotted line indicates no demographic effect of Bt cotton. A negative change in slope denotes a regional decline in population growth (see text). Two regions were excluded because they had fewer than three residuals in the period before or after initiation of reductions in population growth (Fig. 2). The significant quadratic term (coefficient of quadratic term = −0.00016, t = −2.67, P = 0.024; linear term = −0.0075, t = −3.51, P = 0.0057) shows that a reduction in population growth occurred only in regions where Bt cotton was abundant.
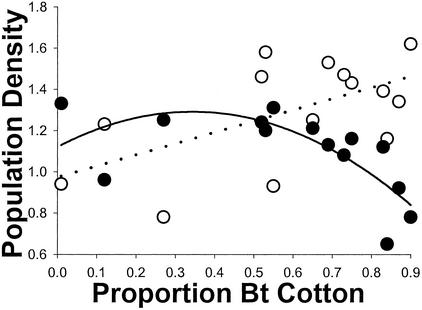
The association between regional use of Bt cotton and average regional spring density between 1992 and 1995 was positive (Fig. 5). Thus, producers used more Bt cotton in regions where pink bollworm infestations had been highest before commercialization of Bt cotton. On the other hand, the significant negative quadratic relationship between regional use of Bt cotton and average regional spring density between 1999 and 2001 shows that the populations declined only in regions where Bt cotton was used most (Fig. 5). Indeed, relative to mean pink bollworm population densities in Arizona, high use of Bt cotton transformed regional infestations from high to low (Fig. 5). The relationship in Figs. 4 and 5 suggests that the threshold value for Bt cotton use leading to regional population declines (Fig. 1) is ≈0.65.
Figure 5.
Association between regional proportion of Bt cotton (pBt as in Fig. 3) and average regional spring density before and after use of Bt cotton. One region was excluded because we had no estimate of its density before 1997. Average regional proportion of Bt cotton from 1997 to 2000 was positively associated with average regional spring density between 1992 and 1995 (log transformed, open circles, dotted line, slope = 0.0054, t = 2.53, P = 0.027) and negatively associated with average regional spring density between 1999 and 2001 (log transformed, filled circles, solid line, linear term = −0.0071, t = −3.40. P = 0.0059 and quadratic term = – 0.00014, t = −2.35, P = 0.038).
Unlike Bt cotton, insecticide sprays have not caused long-term suppression of pink bollworm in Arizona (10). Although sprayed insecticides degrade rapidly and do not kill larvae feeding inside cotton bolls, Bt cotton produces toxin all season and causes >99.5% larval mortality in bolls (3). Whereas some insecticide sprays worsen pest problems by killing predators and parasitoids, Bt cotton has little or no direct toxicity to most arthropod natural enemies (27). Nonetheless, evolution of resistance, which has limited suppression of pests by insecticides, would also eliminate the benefits of Bt cotton (28). In contrast to pink bollworm, which is an ecological specialist with relatively low net reproduction spread among many fields (10, 12), pests that are generalists (29–31), sedentary, or have high reproductive rates (Fig. 1) are less likely to suffer from long-term suppression caused by Bt.
Control of pink bollworm by Bt cotton has helped to substantially reduce insecticide use in Arizona (12). The long-term regional suppression of pink bollworm reported here may further reduce insecticide use and enhance implementation of the refuge strategy, which is mandated by the U.S. Environmental Protection Agency for delaying evolution of pest resistance to Bt cotton (2–8). This strategy requires that growers plant refuges of non-Bt cotton to promote survival of susceptible pests. By fostering long-term population declines, Bt cotton could reduce the need for pink bollworm control, thereby facilitating deployment of larger refuges and reducing the risk of resistance.
Acknowledgments
We thank Tom Henneberry [U.S. Department of Agriculture (USDA) Western Cotton Research Laboratory] and numerous individuals from the Arizona Cotton Research and Protection Council for their contributions. This research was supported by National Research Initiative–USDA Grant 2001-35302-09976 and the Cotton Producers of Arizona.
Abbreviation
- Bt
Bacillus thuringiensis
Footnotes
This paper was submitted directly (Track II) to the PNAS office.
References
- 1.James C. International Service for the Acquisition of Agri-biotech Applications (ISAAA) Brief No. 24. Ithaca, NY: ISAAA; 2002. [Google Scholar]
- 2.Roush R T. In: Biotechnology and Integrated Pest Management. Persley G J, editor. Oxon, U.K.: Cab International; 1996. pp. 242–263. [Google Scholar]
- 3.Tabashnik B E, Patin A L, Dennehy T J, Liu Y-B, Carrière Y, Sims M A, Antilla L. Proc Natl Acad Sci USA. 2000;97:12980–12984. doi: 10.1073/pnas.97.24.12980. [DOI] [PMC free article] [PubMed] [Google Scholar]
- 4.Carrière Y, Tabashnik B E. Proc R Soc London Ser B. 2001;268:1475–1480. doi: 10.1098/rspb.2001.1689. [DOI] [PMC free article] [PubMed] [Google Scholar]
- 5.Onstad D W, Guse C A, Spencer J L, Levine E, Gray M E. J Econ Entomol. 2001;94:529–540. doi: 10.1603/0022-0493-94.2.529. [DOI] [PubMed] [Google Scholar]
- 6.Gould F. Annu Rev Entomol. 1998;43:701–726. doi: 10.1146/annurev.ento.43.1.701. [DOI] [PubMed] [Google Scholar]
- 7.Alstad D N, Andow D A. Science. 1995;268:1894–1896. doi: 10.1126/science.268.5219.1894. [DOI] [PubMed] [Google Scholar]
- 8.Alstad D N, Andow D A. AgBiotech News Info. 1996;8:177N–181N. [Google Scholar]
- 9.Riggin-Bucci T M, Gould F. J Econ Entomol. 1997;90:241–251. [Google Scholar]
- 10.Henneberry T J, Naranjo S E. Integr Pest Manag Rev. 1998;3:31–52. [Google Scholar]
- 11.Chu C C, Henneberry T J. Southwest Entomol. 1990;15:273–280. [Google Scholar]
- 12.Carrière Y, Dennehy T J, Pedersen B, Haller S, Ellers-Kirk C, Antilla L, Liu Y-B, Willot E, Tabashnik B E. J Econ Entomol. 2001;94:315–325. doi: 10.1603/0022-0493-94.2.315. [DOI] [PubMed] [Google Scholar]
- 13.Carrière Y, Ellers-Kirk C, Pedersen B, Haller S, Antilla L. J Econ Entomol. 2001;94:1012–1021. doi: 10.1603/0022-0493-94.5.1012. [DOI] [PubMed] [Google Scholar]
- 14.Penman H L. Proc R Soc London Ser A. 1947;193:120–146. doi: 10.1098/rspa.1948.0037. [DOI] [PubMed] [Google Scholar]
- 15.Brown P W, Russell B. The Arizona Meteorological Network (AZMET) Computer Bulletin Board. Univ. of Arizona Cooperative Extension Service; 1995. http://ag.arizona.edu/AZMET/ , http://ag.arizona.edu/AZMET/. . [Google Scholar]
- 16.Henneberry T J, Bariola L A, Kittock D L. In: Pink Bollworm Control in the Western United States. Graham H M, editor. Agricultural Reviews and Manuals, ARM-W-16: U. S. Department of Agriculture; 1980. pp. 9–23. [Google Scholar]
- 17.Henneberry T J, Forlow Jech L. Southwest Entomol. 1999;24:281–300. [Google Scholar]
- 18.Sims M A, Dennehy T J, Patin A, Carrière Y, Liu Y-B, Tabashnik B E, Antilla L, Whitlow M. Proceedings of the Beltwide Cotton Conference. Memphis, TN: National Cotton Council; 2001. pp. 1175–1179. [Google Scholar]
- 19.Ramsey F L, Schafer D W. The Statistical Sleuth. Pacific Grove, CA: Duxbury; 2001. [Google Scholar]
- 20.Swed F S, Eisenhart C. Ann Math Stat. 1943;14:66–87. [Google Scholar]
- 21.Liu Y-B, Tabashnik B E, Dennehy T J, Carrière Y, Sims M A, Meyer S K. J Econ Entomol. 2002;95:143–148. doi: 10.1603/0022-0493-95.1.143. [DOI] [PubMed] [Google Scholar]
- 22.Levins R. Bull Entomol Soc Am. 1969;15:237–240. [Google Scholar]
- 23.Hanski I. Metapopulation Ecology. New York: Oxford Univ. Press; 1999. [Google Scholar]
- 24.Peck S F, Gould F, Ellner S. J Econ Entomol. 1999;92:1–16. [Google Scholar]
- 25.Caprio M A. J Econ Entomol. 2001;94:698–705. doi: 10.1603/0022-0493-94.3.698. [DOI] [PubMed] [Google Scholar]
- 26.Fife L C. J Econ Entomol. 1961;54:908–913. [Google Scholar]
- 27.Tabashnik B E, Dennehy T J, Carrière Y. BioScience. 2001;51:905–906. [Google Scholar]
- 28.Caprio M A. Biocontrol Sci Tech. 1994;4:487–497. [Google Scholar]
- 29.Whitham T G. Science. 1989;244:1490–1493. [Google Scholar]
- 30.Thomas J A, Bourn N A D, Clarke R T, Stewart K E, Simcox D J, Pearman G S, Curtis R, Goodger B. Proc R Soc London Ser B. 2001;268:1791–1796. doi: 10.1098/rspb.2001.1693. [DOI] [PMC free article] [PubMed] [Google Scholar]
- 31.Warren M S, Hill J K, Thomas J A, Asher J, Fox R, Huntley B, Roy D B, Tefler M G, Jeffcoate S, Harding P J, et al. Nature. 2001;414:65–68. doi: 10.1038/35102054. [DOI] [PubMed] [Google Scholar]


