Abstract
In photosynthesis, highly organized multiprotein assemblies convert sunlight into biochemical energy with high efficiency. A challenge in structural biology is to analyze such supramolecular complexes in native membranes. Atomic force microscopy (AFM) with high lateral resolution, high signal-to-noise ratio, and the possibility to nanodissect biological samples is a unique tool to investigate multiprotein complexes at molecular resolution in situ. Here we present high-resolution AFM of the photosynthetic core complex in native Rhodopseudomonas viridis membranes. Topographs at 10-Å lateral and ≈1-Å vertical resolution reveal a single reaction center (RC) surrounded by a closed ellipsoid of 16 light-harvesting (LH1) subunits. Nanodissection of the tetraheme cytochrome (4Hcyt) subunit from the RC allows demonstration that the L and M subunits exhibit an asymmetric topography intimately associated to the LH1 subunits located at the short ellipsis axis. This architecture implies a distance distribution between the antenna and the RC compared with a centered location of the RC within a circular LH1, which may influence the energy transfer within the core complex. The LH1 subunits rearrange into a circle after removal of the RC from the core complex.
Photosynthetic organisms fuel their metabolism with light energy and have developed for this purpose an efficient apparatus for harvesting and converting sunlight into biochemical energy. The initial steps of photosynthesis, universal in photosynthetic bacteria, algae, and higher plants, comprise light absorption by a set of light-harvesting (LH) pigment–protein complexes and subsequent transfer of the excitation energy to the reaction center (RC), where charge separation across the membrane takes place. In photosynthetic bacteria, the so-called core complex, constituted of a RC intimately associated with LH1, performs these initial steps of the photosynthesis: light trapping and charge separation. The efficiency of the process demands high structural organization of the components. The spatial organization between LH1 and RC is still a matter of debate (1–8), and no information on their assembly in a native system is available. Complementary to structure determination of individual components at near-atomic resolution (9–11), one of the main challenges today is to describe the supramolecular organization of the photosynthetic machinery in native membranes (12). From a more general standpoint, structural biology is in need of a technique with a lateral resolution and signal-to-noise ratio good enough to identify individual components of a multiprotein complex in situ (13).
The atomic force microscope (14) has developed into a powerful tool in structural biology (15, 16). It was demonstrated that topographs of two-dimensional crystals of membrane proteins can be acquired at subnanometer resolution (17). In addition, the high signal-to-noise ratio in raw data atomic force microscopy (AFM) topographs allows single-molecule imaging (16, 18, 19). Furthermore, by applying loading forces to the tip of the atomic force microscope, biological samples can be nanodissected to give insights into protein assembly (20, 21), and time-lapse AFM allows identification of structural changes of molecules as a function of time (22). Thus, AFM is a unique tool to acquire structural information of functional multiple-protein assemblies in native membranes under physiological conditions.
Methods
Sample Preparation.
The photosynthetic membranes of Rhodopseudomonas viridis were purified as described (23, 24). For AFM analysis, the membranes were fused by three freeze and thaw cycles.
AFM.
The atomic force microscope was operated as described (25, 26). Briefly, mica prepared as described (27) was freshly cleaved before each experiment and used as support. Membranes were adsorbed in 50 μl of 10 mM Tris⋅HCl, pH 7.5/150 mM KCl/25 mM MgCl2. Subsequently 5 μl of R. viridis thylakoid solution (≈0.5 mg/ml) were injected into the adsorption buffer drop. After 1 h the sample was rinsed with 10 volumes of high-resolution imaging buffer (10 mM Tris⋅HCl, pH 7.5/50 mM KCl). Imaging was performed with a commercial Nanoscope E contact mode atomic force microscope (Digital Instruments, Santa Barbara, CA) equipped with a 150-μm scanner (J scanner) with oxide-sharpened Si3N4 cantilevers with a length of 100 μm (k = 0.09 N/m; Olympus, Tokyo). The atomic force microscope was operated by applying forces of ≈100 pN. High-resolution images were recorded with optimized feedback parameters at scan frequencies of ≈5 Hz (1,000–2,000 nm/s).
Image Analysis.
AFM images were processed by using the XMIPP single-particle analysis program package (28).
LH1 Arrangement Analysis.
The lengths of the radii r were calculated by using
 |
where n values are subunits 1–16, xn and yn are the coordinates of their peak positions, and X and Y are the coordinates of the ring center calculated by
 |
for X and Y. The positions of the LH1 subunits were calculated into polar coordinates and fitted for a, b, and α with
 |
where r is the center distance of the subunits, α is the angle of the polar coordinates, and a and b are the axes of the ellipse, allowing also a circular fit, when a = b.
Results
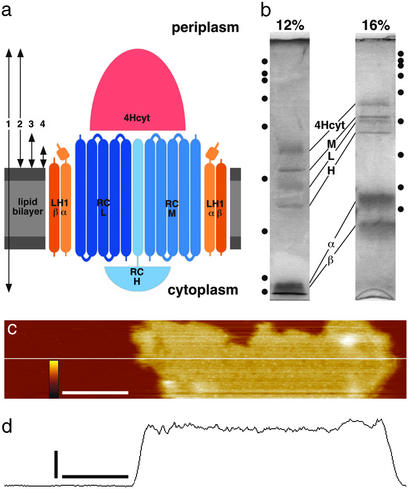
We used an atomic force microscope (14) to investigate the photosynthetic core complex in native membranes of R. viridis under physiological conditions (Fig. 1a). The membranes were purified by a French-Press passage followed by two centrifugation steps and a sucrose gradient (23, 24). The core complexes make >90% of the total protein content in these membranes (8, 23). In R. viridis the RC consists of the L, M, H, and tetraheme cytochrome (4Hcyt) subunits and LH1 of the α- and β-polypeptides (Fig. 1b). Section analysis of overview topographs (Fig. 1c) of firmly adsorbed native membranes of R. viridis result in a thickness of 124 ± 8 Å (n = 30; Fig. 1d), matching with the 130 Å measured from the cytoplasmic to the periplasmic surface of the RC (ref. 11; see also Fig. 1a, arrow 1).
Figure 1.
The native photosynthetic membranes and the core complex of R. viridis. (a) Schematic model of the photosynthetic core complex of R. viridis. Arrows 1–4 correspond to the height measurements of the atomic force microscope (see text). (b) Coomassie-stained 12% and 16% SDS/PAGE of the native R. viridis photosynthetic membranes. Six major bands are found: the 4Hcyt, the L, M, and H subunits of the RC, and the α and β subunits of the LH1 (markers: 200, 116, 98, 66, 45, 31, 21, and 14 kDa). (c) Overview AFM topograph of a native membrane tightly adsorbed to the mica support. (Scale bar, 200 nm; vertical false-color scale bar, 15 nm.) (d) Section analysis along the white line in a revealing the layer thickness of 124 Å. (Horizontal scale bar, 200 nm; vertical scale bar, 50 Å.)
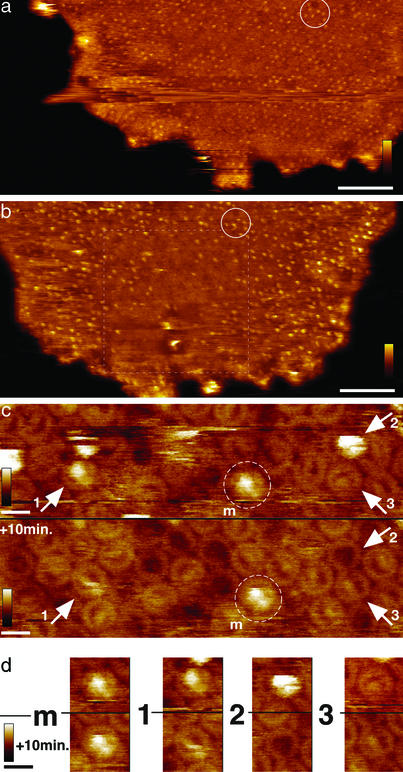
Medium-resolution images revealed particles that protruded strongly from the membrane plane (47.9 ± 2.7 Å, n = 35; Fig. 2a; see also Fig. 1a, arrow 2). According to x-ray crystallographic data of the RC (11), these strongly protruding globular structures were assigned to the nonmembranous 4Hcyt (general organization depicted in Fig. 1a), indicating uniform adsorption of the membranes, with their periplasmic surface exposed to the tip. The nanodissection (20, 21) of the core complex yields more insight into the spatial organization between LH1 and RC in the native membrane. The number of strongly protruding complexes decreased significantly with the number of scans during high-magnification imaging (Fig. 2 a and b). Comparison of subsequently acquired high-magnification images (22) reveals topographical changes of the complexes at molecular resolution (Fig. 2 c and d). The strongly protruding topographies correspond to the entire core complex (see Fig. 1a, 4Hcyt–RC–LH1). Removal of the 4Hcyt topping the RC leads to a drastic change of topography height, resulting in an RC–LH1 complex protruding 14.8 ± 1.3 Å (n = 34; Fig. 2 c and d, 1; see also Fig. 1a, arrow 3). Removal of the 4Hcyt–RC complex leads to an empty LH1 ring complex, which protrudes 6.7 ± 1.3 Å (n = 42; Fig. 2 c and d, 2), and the tip penetrated in the ring center to a deepness of 12.3 ± 2.1 Å (n = 42). Furthermore, one core complex revealed rotation of the RC within the LH1 in subsequently acquired images (Fig. 2 c and d, 3).
Figure 2.
Using the atomic force microscope tip as a nanodissector allows removal of subunits from the photosynthetic core complexes. (a) Medium-resolution topograph of a native photosynthetic membrane of R. viridis. (a and b) The circle outlines features that allow alignment of the two images. (Scale bar, 100 nm; vertical false-color scale bar, 15 nm.) (b) Medium-resolution topograph of the same membrane as shown in a after 60 high-magnification trace and retrace scans. The dashed square delineates the high-magnification scan area, where most of the strongly protruding 4Hcyts topping the RC were nanodissected. (Scale bar, 100 nm; vertical false-color scale bar, 15 nm.) (c) Two high-magnification topographs of the same membrane region. The lower topograph was acquired three scans (10 min) after the upper topograph. Marker (m) allows alignment of the topographs and shows an unchanging RC–LH1 complex. Arrows 1–3 indicate complexes that undergo structural changes after nanodissection. (Scale bar, 10 nm; vertical false-color scale bar, 5 nm.) (d) Analysis of complexes shown in the two topographs shown in c. Structural changes from 4Hcyt–RC–LH1 to RC–LH1 (1) and from 4Hcyt–RC–LH1 to LH1 (2), and rotation of the RC within an individual RC–LH1 complex (3) was observed. (Upper) Particles are from the first image (c Upper). (Lower) Particles are from the image acquired 10 min later (c Lower). (Scale bar, 10 nm; vertical false-color scale bar, 5 nm.)
Figure 3.
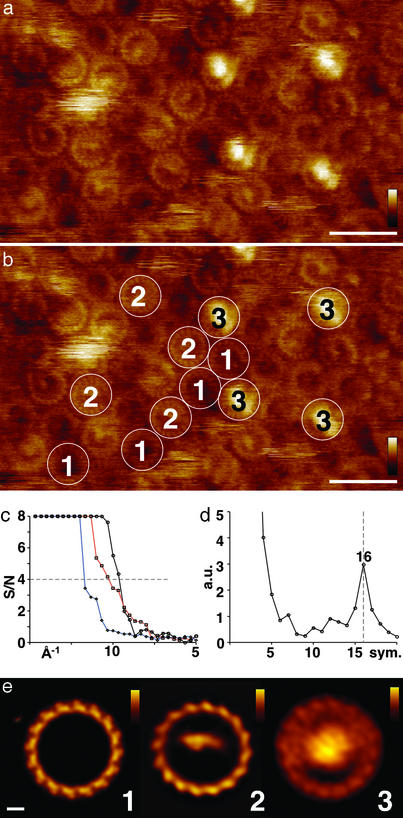
High-resolution AFM of the R. viridis core complex in native membranes. Three classes of complexes are imaged and averaged: 1, LH1; 2, RC–LH1; and 3, 4Hcyt–RC–LH1. (a) High-resolution AFM topograph. Some complexes reveal subunit structure of the LH1 in the raw data. (Scale bar, 20 nm; vertical false-color scale bar, 5 nm.) (b) Outline of four complexes each, classified to classes 1–3. (c) Calculation of the resolution limit of the topographs of the three classes as shown in a and b. Spectral signal-to-noise analysis plot from single-particle analysis (signal/noise = 4 was used as resolution cutoff): 1, black line connecting ○; 2, red line connecting □; and 3, blue line connecting ⋄. (d) Average rotational power spectrum over a radius ranging from 35 to 65 Å (top ring radius ≈50 Å) from 51 empty LH1 rings revealing 16-fold symmetry. (e) Average topographs of the three different complexes: 1 (16-fold symmetrized), 2, and 3. (Scale bar, 2 nm; vertical false-color scale bars: Left, 1 nm; Center, 1.5 nm; Right, 5 nm.)
High-resolution images (Fig. 3a) revealed a lateral resolution of 10 Å as judged from spectral signal-to-noise analysis gained through single-particle averaging (ref. 28; Fig. 3c) and a vertical resolution of ≈1 Å (26). From 2,365 highly resolved particles, three classes of protein complexes could be extracted and averaged (Fig. 3): 1, LH1; 2, RC–LH1; and 3, 4Hcyt–RC–LH1. LH1 rings, where the 4Hcyt–RC has been removed, form a closed circle with an ≈100-Å top diameter. The average rotational power spectra of the LH1 circles measured over a radius ranging from 35 to 65 Å (top ring radius ≈50 Å) shows a distinct single peak corresponding to 16-fold symmetry (Fig. 3c). The subunits show a left-handed twist to the circle outside, with lower peripheral than inner protrusions (Fig. 3e Left). This is in agreement with models built of the LH1 subunit based on the structures of LH2 (9, 10) and electron crystallographic projection maps (4, 29). The topography of the RC–LH1 complex reveals three important features. First, the RC shows a clearly noncentered location within the LH1. Second, the L and M subunits are strongly asymmetrically contoured. Third, the LH1 around the RC reveals ellipticity and protrudes stronger than empty LH1 rings (10.1 ± 1.4 Å, n = 32; Fig. 3e, Center; see also Fig. 1a, arrow 4). The one-sided location and asymmetric topography of the RC within LH1 is surprising, because the x-ray structure of the RC (11) shows a fairly flat surface with a quasi twofold symmetry of subunits L and M. The atomic force microscope's topography can be explained by a tilted noncentered localization of the RC within the LH1. The ellipticity and the protrusion height of the LH1 with an associated RC reflects a strong and specific interaction between the core-complex components. The complete core complex 4Hcyt–RC–LH1 (Fig. 3d Right) reveals the LH1 topography and dominantly the strongly protruding 4Hcyt topping the RC. This subunit is contoured as a globular structure with a height of 48 Å over the membrane and a diameter of ≈50 Å, which might appear enlarged because of tip convolution.
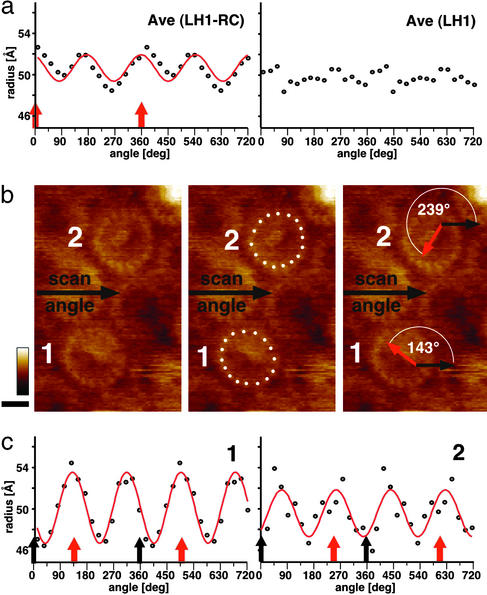
To analyze the LH1 subunit arrangement around the RC in detail, the center distances of the LH1 subunits and the orientation of the RC surface were analyzed (Fig. 4; see Methods). The LH1 subunits of the RC–LH1 average (Fig. 3e Center) are elliptically distributed around the RC (Fig. 4a Left; fitted with long and short axes of a = 52 Å and b = 49 Å). The orientation of the long axis of the LH1 ellipsis coincides with the long axis of the RC topography (Figs. 3e Center and 4a Left). The subunit distribution of the nonsymmetrized LH1 average does not reveal ellipticity (Fig. 4a Right). Individual RC–LH1 particles in one raw data image were analyzed equally (Fig. 4 b and c). The subunit distribution was found to be elliptical with length differences of the long and the short axis between 5% and 10%. As in the average, the orientation of the long axis of the LH1 ellipsis coincides with the long axis of the RC topography. In contrast, the ellipticity is not influenced by the scan angle of the atomic force microscope, confirming that the elliptical LH1 subunit architecture is related to specific interactions with the membrane-spanning RC subunits (Fig. 4c). The ellipticity of the LH1 in complex with the RC, compared with a circular LH1 after removal of the RC (Fig. 4a), reflects adaptation of a flexible LH1 assembly to the RC position. The dominant role of the RC for the LH1 architecture is corroborated by the finding of rotation of the RC within the complex, which is not destructive to the LH1 (Fig. 2e, 3). Such fluctuations of ellipticity of the LH1 might favor the quinone/quinol passage through a closed LH1 architecture.
Figure 4.
Ellipticity analysis of LH1 of the native R. viridis core complex. (a) Polar coordinates plots of the LH1 subunit distribution of the RC–LH1 average (Left) and the nonsymmetrized LH1 average (Right). The center distances of the subunits are plotted against the angle as described in Methods. The red line corresponds to the theoretical coordinates of an ellipsis (Left), and the flat distribution of values indicates a circular subunit arrangement (Right). The red arrows indicate the RC long-axis orientation (see also Fig. 3e Center). (b) LH1 subunit distribution and the RC orientation in two core complexes. (Left) Raw data image. (Center) LH1 subunit distribution. (Right) Relative orientation of the RC with respect to the scan angle. Black arrows, atomic force microscope scan angle; red arrows, RC long-axis orientation. (c) Polar coordinates plots of the two core complexes shown in b. Red lines, theoretical ellipsis fits; black arrows, atomic force microscope scan angle; red arrows, RC long-axis orientation.
Discussion
In this work, the molecular organization of the core complexes has been studied in native membranes without the need of solubilization, purification, and reconstitution steps before analysis. Furthermore, in the native membranes no restrictions of crystallinity are applied to the LH1 architecture and the RC within the ring. Our data clearly show that the LH1 subunits form a closed hexadecameric ellipsis assembly with a high degree of flexibility. In addition, the RC is asymmetrically contoured and closely associated to the LH1 subunits located at the short ellipsis axis. The presence of unequal bacteriochlorophyll molecules in the ellipsoid is likely to influence the electronic and functional properties of LH1 as compared with a circular antenna. This may explain the presence of spectrally different pigment pools in R. viridis core complexes (30) and should result in a distribution of excitation transfer kinetics from LH1 to RC due to the different distances between the antenna bacteriochlorophylls and the RC special pair.
Besides the information on the assembly of the photosynthetic core complex, our data demonstrate that AFM, featuring an exceptionally high signal-to-noise ratio at high lateral resolution combined with the possibility to nanodissect protein assemblies, will become a key technique for the investigation of integrated photosynthetic apparatus ranging from bacteria to plants and of protein assemblies in general in native membranes.
Acknowledgments
This study was supported by the Institut Curie, the Commissariat à l'Energie Atomique, and the Centre National de la Recherche Scientifique. S.S. was recipient of a fellowship from the French Research Ministry.
Abbreviations
- LH
light-harvesting
- RC
reaction center
- AFM
atomic force microscopy
- 4Hcyt
tetraheme cytochrome
References
- 1.Walz T, Ghosh R. J Mol Biol. 1997;265:107–111. doi: 10.1006/jmbi.1996.0714. [DOI] [PubMed] [Google Scholar]
- 2.Stahlberg H, Dubochet J, Vogel H, Ghosh R. J Mol Biol. 1998;282:819–831. doi: 10.1006/jmbi.1998.1975. [DOI] [PubMed] [Google Scholar]
- 3.Jungas C, Ranck J-L, Rigaud J-L, Joliot P, Vermeglio A. EMBO J. 1999;18:534–542. doi: 10.1093/emboj/18.3.534. [DOI] [PMC free article] [PubMed] [Google Scholar]
- 4.Jamieson S J, Wang P, Qian P, Kirkland J Y, Conroy M J, Hunter C N, Bullough P A. EMBO J. 2002;21:3927–3935. doi: 10.1093/emboj/cdf410. [DOI] [PMC free article] [PubMed] [Google Scholar]
- 5.Frese R N, Olsen J D, Branvall R, Westerhuis W H, Hunter C N, van Grondelle R. Proc Natl Acad Sci USA. 2000;97:5197–5202. doi: 10.1073/pnas.090083797. [DOI] [PMC free article] [PubMed] [Google Scholar]
- 6.Papiz M Z, Prince S M, Hawthornthwaite-Lawless A M, McDermott G, Freer A A, Isaacs N W, Cogdell R J. Trends Plant Sci. 1996;1:198–206. doi: 10.1016/s0969-2126(96)00050-0. [DOI] [PubMed] [Google Scholar]
- 7.Hu X, Ritz T, Damjanovic A, Autenrieth F, Schulten K. Q Rev Biophys. 2002;35:1–62. doi: 10.1017/s0033583501003754. [DOI] [PubMed] [Google Scholar]
- 8.Ikeda-Yamasaki I, Odahara T, Mitsuoka K, Fujiyoshi Y, Murata K. FEBS Lett. 1998;425:505–508. doi: 10.1016/s0014-5793(98)00300-7. [DOI] [PubMed] [Google Scholar]
- 9.McDermott G, Prince S M, Freer A A, Hawthornthwaite-Lawless A M, Papiz M Z, Cogdell R J, Isaacs N W. Nature. 1995;374:517–521. doi: 10.1016/s0969-2126(96)00050-0. [DOI] [PubMed] [Google Scholar]
- 10.Koepke J, Hu X, Muenke C, Schulten K, Michel H. Structure (London) 1996;4:581–597. doi: 10.1016/s0969-2126(96)00063-9. [DOI] [PubMed] [Google Scholar]
- 11.Deisenhofer J, Epp O, Miki K, Huber R, Michel H. Nature. 1985;318:618–624. doi: 10.1038/318618a0. [DOI] [PubMed] [Google Scholar]
- 12.Bibby T, Nield J, Barber J. Nature. 2001;412:743–745. doi: 10.1038/35089098. [DOI] [PubMed] [Google Scholar]
- 13.Simons K, Ikonen E. Nature. 1997;387:569–572. doi: 10.1038/42408. [DOI] [PubMed] [Google Scholar]
- 14.Binnig G, Quate C F, Gerber C. Phys Rev Lett. 1986;56:930–933. doi: 10.1103/PhysRevLett.56.930. [DOI] [PubMed] [Google Scholar]
- 15.Schabert F A, Henn C, Engel A. Science. 1995;268:92–94. doi: 10.1126/science.7701347. [DOI] [PubMed] [Google Scholar]
- 16.Engel A, Müller D J. Nat Struct Biol. 2000;7:715–718. doi: 10.1038/78929. [DOI] [PubMed] [Google Scholar]
- 17.Müller D J, Fotiadis D, Scheuring S, Müller S A, Engel A. Biophys J. 1999;76:1101–1111. doi: 10.1016/S0006-3495(99)77275-9. [DOI] [PMC free article] [PubMed] [Google Scholar]
- 18.Czajkowsky D M, Shao Z. FEBS Lett. 1998;430:51–54. doi: 10.1016/s0014-5793(98)00461-x. [DOI] [PubMed] [Google Scholar]
- 19.Scheuring S, Fotiadis D, Möller C, Müller S A, Engel A, Müller D J. Single Mol. 2001;2:59–67. [Google Scholar]
- 20.Fotiadis D, Scheuring S, Müller S A, Engel A, Müller D J. Micron. 2002;33:385–397. doi: 10.1016/s0968-4328(01)00026-9. [DOI] [PubMed] [Google Scholar]
- 21.Oesterhelt F, Oesterhelt D, Pfeiffer M, Engel A, Gaub H E, Müller D J. Science. 2000;288:143–146. doi: 10.1126/science.288.5463.143. [DOI] [PubMed] [Google Scholar]
- 22.Goldsbury C, Kistler J, Aebi U, Arvinte T, Cooper G J S. J Mol Biol. 1999;285:33–39. doi: 10.1006/jmbi.1998.2299. [DOI] [PubMed] [Google Scholar]
- 23.Jacob J S, Miller K R. Arch Biochem Biophys. 1983;223:282–290. doi: 10.1016/0003-9861(83)90593-3. [DOI] [PubMed] [Google Scholar]
- 24.Jay F, Lambillotte M, Stark W, Mühlethaler K. EMBO J. 1984;3:773–776. doi: 10.1002/j.1460-2075.1984.tb01883.x. [DOI] [PMC free article] [PubMed] [Google Scholar]
- 25.Scheuring S, Reiss-Husson F, Engel A, Rigaud J-L, Ranck J-L. EMBO J. 2001;20:3029–3035. doi: 10.1093/emboj/20.12.3029. [DOI] [PMC free article] [PubMed] [Google Scholar]
- 26.Scheuring S, Seguin J, Marco S, Levy D, Breyton C, Robert B, Rigaud J L. J Mol Biol. 2003;325:569–580. doi: 10.1016/s0022-2836(02)01241-x. [DOI] [PubMed] [Google Scholar]
- 27.Schabert F A, Engel A. Biophys J. 1994;67:2394–2403. doi: 10.1016/S0006-3495(94)80726-X. [DOI] [PMC free article] [PubMed] [Google Scholar]
- 28.Marabini R, Masegosa I M, San Martin C, Marco S, Fernandez J J, de la Fraga C G, Carazo J M. J Struct Biol. 1996;116:237–240. doi: 10.1006/jsbi.1996.0036. [DOI] [PubMed] [Google Scholar]
- 29.Karrasch S, Bullough P A, Ghosh R. EMBO J. 1995;14:631–638. doi: 10.1002/j.1460-2075.1995.tb07041.x. [DOI] [PMC free article] [PubMed] [Google Scholar]
- 30.Monshouwer R, Visschers R W, van Mourik F, Freiberg A, van Grondelle R. Biochim Biophys Acta. 1995;1229:373–380. doi: 10.1016/0005-2728(95)00046-l. [DOI] [PubMed] [Google Scholar]


