Abstract
There is a concern that increased paternal age may be associated with altered fertility and an increased incidence of birth defects in man. In previous studies of aged male rats, we have found abnormalities in the fertility and in the embryos sired by older males. Aging in mammals is associated with alterations in the content and patterns of DNA methylation in somatic cells; however, little is known in regard to germ cells. A systematic search for global and gene-specific alterations of DNA methylation in germ cells and liver of male rats was done. Restriction landmark genomic scanning, a method used to determine specific methylation patterns of CpG island sequences, has revealed a region of the ribosomal DNA locus that is preferentially hypermethylated with age in both spermatozoa and liver. In contrast, all single copy CpG island sequences in spermatozoa and in liver remain unaltered with age. We further demonstrate that a large proportion of rat ribosomal DNA is normally methylated and that regional and site-specific differences exist in the patterns of methylation between spermatozoa and liver. We conclude that patterns of ribosomal DNA methylation in spermatozoa are vulnerable to the same age-dependent alterations that we observe in normal aging liver. Failure to maintain normal DNA methylation patterns in male germ cells could be one of the mechanisms underlying age-related abnormalities in fertility and progeny outcome.
Advancing age in men and women has been associated with an increased incidence of parenting abnormal offspring (1). Because the father donates only chromatin to his offspring, the causal factor(s) for this effect must be of a genetic or epigenetic origin. A candidate epigenetic mechanism that may be involved in male germ cell aging is DNA methylation.
The presence of 5-methylcytosine (m5C) in the CpG dinucleotide sequence of somatic cell DNA is commonly correlated with decreased gene expression and is also implicated in the stability of chromosomes (2). Mounting evidence links the presence of m5C to the recruitment of proteins to DNA that maintain stably repressed chromatin (3). In this manner, patterns of DNA methylation partition the genome into transcriptionally active and inactive regions. In mammals, the majority of cytosine bases are methylated at CpG sites. Genomic DNA is relatively CpG-poor due to an accumulation of m5C → thymine transitions. “CpG islands” are regions that are predominantly unmethylated and thus retain their CpG content. CpG islands are commonly found associated with genes.
Age-dependent alterations of DNA methylation have been observed in mammalian somatic cells (4, 5) and occur in age-related disease (6). It is not known to what extent any of these changes may be present in germ cells. New generations of male germ cells are continually produced throughout adulthood. Age-dependent changes in DNA methylation may differ between the cells of old tissues and the cells of tissues that are renewed within an old individual. The Brown Norway (BN) rat is an inbred strain frequently used as a model of male reproductive aging because it has a long lifespan and a low incidence of age-related disease, yet loses male reproductive function when other systems seem to be unaffected (7–9). We have found abnormalities in the development of embryos sired by aged BN rats (10). Similar results have been obtained when embryos are sired by males treated with the DNA demethylating agent, 5-azacytidine (11). In this study we establish that a specific alteration of DNA methylation is present in both aged spermatozoa and liver. This may contribute to age-related abnormalities in fertility and progeny outcome.
Methods
Animals.
Adult male BN rats (young, 6 mo; old, 21–24 mo) were purchased from the National Institute of Aging (Bethesda, MD) and supplied by Harlan–Sprague–Dawley. Rats were housed at the McIntyre Animal Resources Center, McGill University, under controlled light (14 h light/10 h dark) and temperature and had free access to food and water. All animal studies were conducted in accordance with the principles and procedures outlined in the Guide to the Care and Use of Experimental Animals prepared by the Canadian Council on Animal Care.
Liver, Spermatozoa, and Testicular Germ Cell Isolation.
Rats were killed by decapitation. Liver was extracted, frozen in liquid nitrogen, and stored at −80°C until use. Spermatozoa from the caput and cauda epididymis were isolated and purified by using previously described procedures (12). Sperm pellets were stored at −80°C until use. Purified populations of pachytene spermatocytes and round spermatids were obtained from testes by cellular sedimentation at unit gravity on 2–4% BSA gradients as described (13, 14). Five cell separations were done per age group by pooling one to three animals per separation. The purities of pachytene spermatocytes and round spermatids were 83 ± 3.4% and 91 ± 2.5% (mean ± SD), respectively.
TLC.
Quantification of global genomic DNA methylation by TLC was done as described (12, 15). Results were quantified by phosphorimager. To ensure accuracy of results, compensation for nonspecific end-labeling arising from nonspecific DNA cleavage was done (16). DNA samples with corrections >5% were deemed too degraded for further use. Statistical analysis was done by using SIGMASTAT 2.03 (SPSS, Chicago) software by two-way ANOVA with the Bonferroni method for pairwise multiple comparisons. Values of P < 0.05 were considered significant.
Restriction Landmark Genomic Scanning (RLGS).
High-molecular weight liver genomic DNA was isolated as described (17). High-molecular weight genomic sperm DNA was isolated by resuspending the pellet in 1.0–2.0 ml of lysis buffer (10 mM Tris⋅HCl, pH 8/150 nM EDTA, pH 8/10 mM DTT) along with 10–20 μl of 10 mg/ml of proteinase K and 30–60 μl of 30% sarkosyl. Samples were incubated at 55°C for 20–40 min. RLGS was performed as described (17).
RLGS Gel Spot Extraction and PCR.
DNA from excised RLGS gel pieces was obtained as described (18). This DNA served as a template for PCR amplification in standard buffer conditions with the addition of 2.5% DMSO. Primers were designed from GenBank rat ribosomal DNA (rDNA) sequences and were used to amplify the 5′-external transcribed spacer (5′-ETS): 5′-AAAGTCGCTCGTCGACCTC and 5′-GGTCGGAGGACCGTGAAC (pair 1) and 5′-CGCGTCTCGCCTGGTCTCTTG and 5′-ACGCACGCCTTCCCAGAGG (pair 2). Primers used for amplification of the 28S region were 5′-AGGTGCAGATCTTGGTGGT and 5′-TCTCTCAGGACCGACTGACC (pair 3) and 5′-GTTTTCCTCCGGCCTCGT and 5′-CCAGTTCTAAGTCGGCTGCT (pair 4). PCR products were run in 1.0% agarose gels and stained with ethidium bromide.
Southern Blotting and Probes.
Southern blotting procedure was performed as described (19). Blots were visualized by phosphorimager. The 5′-ETS probe was generated by PCR amplification of RLGS excised DNA fragment A by using primer pair 2. The 28S probe was generated by PCR amplification of genomic DNA by using primers 5′-GAACTTTGAAGGCCGAAGTG and 5′-CGCGAGATTTACACCCTCTC. The identities of the probes were confirmed by restriction enzyme digest. Statistical analysis was done by using SIGMASTAT 2.03 software by the Mann–Whitney rank sum test (∗, P < 0.05). Both bands were required to be greater than two times background for analysis.
Results
Global Methylation Analysis of Germ Cells and Liver.
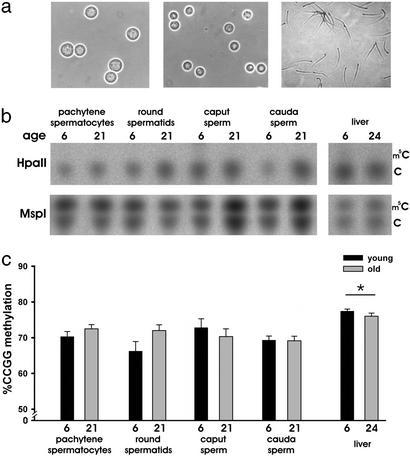
In our first study, we focused on whether age-dependent changes in global CpG methylation could be determined in cells obtained from various stages of germ cell development. Liver and purified populations of pachytene spermatocytes and round spermatids as well as caput and cauda spermatozoa were obtained from the testes and epididymidis of young and old male BN rats (Fig. 1). To determine the levels of global DNA methylation, one aliquot of genomic DNA was digested with the methylation-sensitive enzyme HpaII (which cleaves the sequence CCGG only if the internal cytosine residue is unmethylated) and another with MspI (which cleaves the same sequence regardless of methylation). TLC plates generated with HpaII-digested DNA served as a control, whereas the relative contributions of m5C to total cytosine (C) content in MspI-digested DNA was quantified and illustrated in Fig. 1c. There was no effect of age, however DNA methylation was significantly higher in liver when compared to that of each stage of germ cells.
Figure 1.
Global genomic DNA determination by TLC. (a) Phase-contrast photographs of purified pachytene spermatocytes (Left), round spermatids (Center), and cauda sperm (Right) (×400). (b) Representative TLC plates of HpaII- and MspI-digested genomic DNA in germ cells and liver of young and old animals. The MspI-digested DNA reveals the relative content of cytosine (C) to m5C. (c) Graphical representation of quantified TLC results of germ cells and liver of young (black bars) and old (gray bars) animals. *, P < 0.05. Error bars represent ± SEM. Two-way ANOVA (n = 4–6 per age per group) revealed no significant effect of age, but methylation was significantly higher in liver when compared to pachytene spermatocytes (P = 0.019), round spermatids (P < 0.001), caput sperm (P = 0.005), and cauda sperm (P < 0.001).
RLGS Analysis of Aging Spermatozoa and Liver.
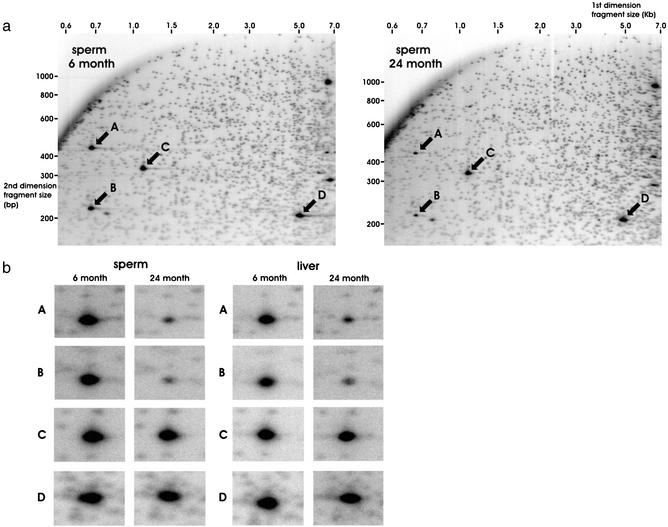
The bulk of CpG methylation in the mammalian genome resides in low CpG-density noncoding and/or repetitive heterochromatic sequences. The TLC assay, as well as the majority of previous methylation studies, rely on the use of the frequent-cutting enzymes HpaII and MspI that are not sensitive to CpG-island-containing sequences. To focus on CpG-island methylation, which is more relevant to the modulation of euchromatin, a technique termed RLGS was used. In RLGS, genomic DNA is digested with the methylation sensitive restriction enzyme NotI, which cleaves the sequence GCGGCCGC only if the internal cytosines are unmethylated and thus resolves mostly CpG island-containing sequences (20). The generated overhangs are radiolabeled to create NotI landmarks. The size of NotI-labeled DNA is reduced by EcoRV and electrophoresed in an agarose tube gel (first dimension separation). DNA fragments are further digested in situ with HinfI and the tube gel is connected to an acrylamide gel by using molten agarose and electrophoresed (second dimension separation) to produce 2D RLGS profiles (Fig. 2). Both single-copy (small spots) and repeat (large, dense spots) sequences are resolved. The analysis of RLGS profiles generated by using spermatozoa from young and old revealed no reproducible difference (n = 4 animals per age group) in the methylation status of 1,944 resolvable single-copy landmarks (Fig. 2a). Likewise, 1,802 single-copy landmarks revealed no reproducible difference (n = 4 animals per age group) in young vs. old profiles generated with liver (gels not shown). However, repeat copy fragments (marked A and B in Fig. 2) demonstrated reproducibly decreased spot intensity indicative of hypermethylation of the sequence. Two other fragments of similar intensity (C and D) appeared unaltered with age. This pattern was observed in all profiles.
Figure 2.
RLGS of cauda spermatozoa and liver of young and old animals. (a) Representative RLGS scans of young and old cauda spermatozoa. Numbers across the top of the scans represent first dimension fragment sizes (kb), and numbers down the left side of the scans represent second dimension fragment sizes (bp). Small spots represent single-copy genomic fragments, and large, dense spots represent repeat copy fragments. Arrows indicate fragments A–D. (b) Enlargements of fragments A–D in both cauda spermatozoa and liver of young and old animals.
Sequence Determination of RLGS Spots.
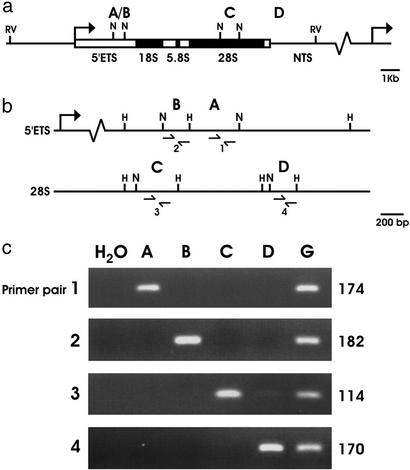
Because most repetitive elements in mammals are highly methylated heterochromatic sequences that possess insufficient CpG content to contain NotI sites, we hypothesized that the repeat copy fragments observed in rat RLGS profiles may belong to the euchromatic rDNA repeat. An assembly of rat GenBank rDNA sequences revealed four NotI sites: two in the 5′-ETS and two in the sequence coding for the 28S ribosomal RNA subunit (Fig. 3a). The first dimension sizes predicted in Fig. 3a for NotI–NotI fragments A/B (0.7 kb) and C (1.1 kb) and for NotI–EcoRV fragment D (5.0 kb) match the observed horizontal mobility of fragments labeled A–D on RLGS profiles. The second dimension sizes predicted in Fig. 3b for NotI–HinfI fragments A (439 bp), B (229 bp), C (353 bp), and D (221 bp) match the observed vertical mobility of fragments labeled A–D on RLGS profiles. To confirm the sequence prediction, DNA was extracted from excised RLGS spots A–D. Primer pairs 1–4 were designed from GenBank sequences to correspond to the sequences predicted in fragments A–D, respectively. A PCR reaction by using each primer pair was done on each fragment extracted (Fig. 3c). DNA was amplified only when the correct primer pair was matched to the corresponding fragment. All products were of predicted size. This confirms the location of RLGS fragments A and B to be within the 5′-ETS and RLGS fragments C and D to be within the 28S region of the rDNA locus.
Figure 3.
RLGS restriction sites within the rat rDNA locus and specific PCR amplification of RLGS fragments A–D. (a) Rat rDNA consists of tandem repeats containing the 45S preRNA-transcribed region (rectangle) and the nontranscribed spacer (NTS) region (line). The 5′-ETS region is indicated as well as regions coding for the 18S, 5.8S, and the 28S ribosomal RNAs. The recognition sites and the RLGS fragments (A/B, C, and D) generated by the restriction enzymes used in the first dimension RLGS separation, NotI (N) and EcoRV (RV), are indicated. (b) Enlargement of the NotI sites within the 5′-ETS and 28S regions. The positions of HinfI (H) recognition sites adjacent to NotI sites are illustrated. The NotI–HinfI fragments that generate second dimension RLGS fragments A–D are indicated. The positions of PCR primer pairs 1–4 are indicated. (c) PCR primer pairs 1–4 are used to specifically amplify DNA from excised RLGS fragments A–D by using H2O and genomic DNA (G) as a negative and positive amplification control, respectively. The PCR product sizes are listed.
Southern Blotting of the rDNA Locus.
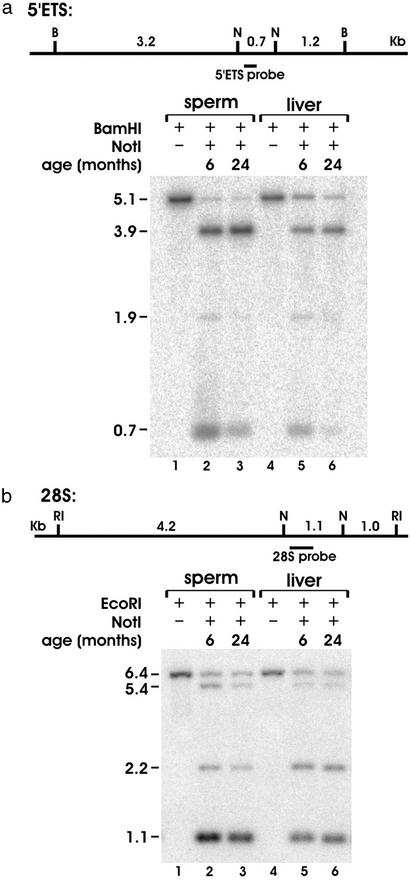
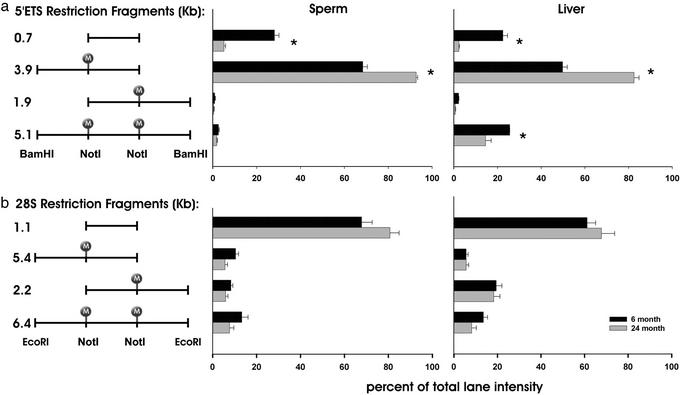
The assembly of rat GenBank sequences allowed for the design of restriction digests and probes to investigate specific regions of the rDNA locus by using Southern blots. Nonmethylation sensitive enzymes BamHI and EcoRI were chosen because they flank the NotI sites present in the 5′-ETS and 28S regions, respectively, in a manner that would generate identifiable fragments of manageable size. The disappearance of RLGS fragments A and B could result from methylation of either the 5′- or the 3′-NotI site in the 5′-ETS. The NotI sites present in the 5′-ETS were investigated by digesting spermatozoa and liver genomic DNA from young and old animals with BamHI and NotI (Fig. 4a). Membranes were hybridized with a probe specific for the 5′-ETS region. The appearance of the 5.1-kb band indicates that both NotI sites are methylated, the 0.7-kb band indicates that both sites are unmethylated, and the 3.9- and 1.9-kb bands illustrate that only the 5′- or the 3′-NotI site is methylated, respectively (Figs. 4 and 5a Left). Densitometric analysis comparing the relative contribution of each band to the total lane intensity demonstrates the presence of methylated sites (5.1-, 3.9-, and 1.9-kb bands) in both tissues and both ages tested. A significant 82% decrease in the relative intensity of the 0.7-kb fragment is found in the DNA from spermatozoa from old animals (Fig. 4a, lanes 2 and 3, and Fig. 5a Center). A subsequent increase in the intensity of the 3.9-kb fragment is observed. The age-dependent pattern of 5′-ETS methylation is similar in liver DNA with a 90% decrease in the intensity of the 0.7-kb fragment and increased intensity of the 3.9-kb fragment (Fig. 4a, lanes 5 and 6, and Fig. 5a Right). Thus, the 5′-NotI site in the 5′-ETS region is preferentially acquiring methylation with age in both spermatozoa and liver. In contrast, we fail to detect an age-dependent difference in the methylation status of either NotI site in the 28S region in either tissue (Figs. 4b and 5b). In young animals, methylation-free 28S fragments (1.0-kb bands) are ≈25% more abundant compared to 5′-ETS fragments (0.7 kb) in both spermatozoa and liver. This demonstrates that the 5′-ETS of young animals is normally hypermethylated compared to the 28S region. This regional difference is exacerbated by age. Southern blot analysis further shows that the methylation pattern of spermatozoa differs from that of liver. Both ages of liver rDNA possess a higher abundance of the 5.1-kb fragment in the 5′-ETS, thus indicating a higher frequency of methylation occurring at both NotI sites simultaneously than in spermatozoa (Figs. 4a and 5a). Furthermore, the 3′-NotI site of these fragments exhibits age-dependent demethylation. These results are consistent with what can be observed in the RLGS experiments.
Figure 4.
Southern blot analysis of NotI-containing regions of the 5′-ETS and 28S. (a) Fragment sizes generated by digestion of genomic DNA with BamHI (B) and NotI (N) in the 5′-ETS region are illustrated above. Genomic DNA from spermatozoa and liver was digested with BamHI only in lanes 1 and 4, respectively. Both BamHI and NotI were used to digest spermatozoa DNA from young and old animals in lanes 2 and 3, respectively, and liver DNA from young and old animals in lanes 5 and 6, respectively. (b) Fragment sizes generated by digestion of genomic DNA with EcoRI (RI) and NotI (N) in the 28S region are illustrated. The identical arrangement of enzyme digestions, tissues, and ages used in a were applied to the 28S region except for the replacement of BamHI with EcoRI.
Figure 5.
Graphical representation of the densitiometric analysis of Southern blots. The four possible methylation states of the two NotI sites present in the 5′-ETS region (a) and the 28S region (b) are illustrated as restriction fragments with the corresponding fragment sizes (Left). The relative contribution of each band to the total lane intensity in spermatozoa (Center) and liver (Right) of young (black bars) and old (gray bars) animals is illustrated (n = 4 per age per group). Statistical analysis was performed by the Mann–Whitney rank sum test (*, P < 0.05). Error bars represent ± SEM.
Discussion
This study demonstrates an age-dependent epigenetic defect in male germ cells. Germ cells are some of the most highly differentiated and specialized cell types in the body. Although germ cells are in a constant state of renewal, this study clearly shows that spermatozoa are susceptible to age-dependent alterations of DNA methylation. Further studies are required to determine whether the observed defect in mature sperm is present within the spermatogonial stem cell population or whether a modification of the testicular environment is responsible for the observed age-dependent alterations. Nevertheless, the discovery of altered DNA methylation in male germ cells during aging provides a new avenue of research in the fields of aging, fertility, and male-mediated progeny health.
Previous studies have shown that global DNA methylation levels are lower in sperm than in somatic tissues (21). In our TLC study, in addition to sperm, all earlier germ cell types, including premeiotic and postmeiotic cells, contained significantly lower levels of global CpG methylation when compared to liver. These findings further underline a fundamental epigenetic difference between germ cells and somatic tissue.
In this study, we fail to detect age-dependent hypomethylation of germ cells or liver. Previous studies have shown hypomethylation of various somatic tissues of mice and humans, including liver (4). This difference is likely to be explained by the fact that the TLC assay detects CpG methylation and HPLC-based assays used previously determined total m5C content of DNA.
Analysis of global DNA methylation does not allow for the identification of individual sequences that may exhibit altered DNA methylation or specifically target sequences of biological significance. The advantage of applying RLGS technology to the question of aging allows not only for the determination of affected sequences, but places the alterations in the perspective of a large population of identifiable CpG island-containing sequences. Interestingly, no obvious age-dependent alterations in the DNA methylation status of single copy genes were found by using RLGS in liver or male germ cells. In support of our findings, a recent study by using RLGS detected only one single gene change in the aging mouse (22). The disparity between previous studies (4) demonstrating hypomethylation of genomic DNA and our RLGS results showing no effect in single copy genes implies that the majority of age-dependent hypomethylation may be occurring in low-CpG density heterochromatic sequences or at non-CpG m5C sites. However, because RLGS resolves almost exclusively CpG island-containing genes, it is also possible that age-dependent alterations may occur in genes lacking CpG islands. Based on these data, previous findings demonstrating age-dependent alterations of global DNA methylation may not relate to the modulation of euchromatic sequences.
The genes encoding the rat rRNAs are present in ≈200 copies per haploid genome and are arranged into cistrons containing tandemly arrayed repeats on three chromosomes (23). Ribosomal RNA is initially transcribed as the 45S preRNA containing the 5′-ETS, and is processed to produce the 18S, 5.8S, and 28S rRNAs. Previous studies have demonstrated detectable levels of methylation in rat rDNA (24, 25). Forty percent of the rDNA found in mouse is methylated in the 5′ region of the repeats (26). In our study, ≈75% and 50% of the rDNA repeats found in the 5′-ETS and the 28S region, respectively, were methylated in both spermatozoa and liver from young animals. This indicates that regional differences of rDNA methylation may be found within the rDNA repeat. Previous studies by using the common enzyme combination of HpaII/MspI may not have detected partially methylated sequences because of the very high recognition site frequency of these enzymes in rDNA. We find that partially methylated fragments are more common in the 5′-ETS of both spermatozoa and liver than are fully methylated or fully unmethylated fragments. These data argue that a heterogeneous state of DNA methylation can be found between and within regions of the rDNA repeat.
Alterations in the biology of the ribosome and the nucleolus have been proposed in aging processes (27, 28). Dysfunctional regulation of ribosome biogenesis would presumably have an impact on protein synthesis and thus have broad implications in cellular aging. Alterations in the patterns of rDNA methylation may signify impaired function of rDNA. Rodent studies demonstrate that methylation in the rDNA promoter region is correlated with unexpressed rRNA (26, 29). A previous study revealed that in various somatic tissues of mice, age-dependent methylation occurs specifically in the 5′ region of rDNA and this resulted in a loss of rDNA function (30). Studies by using human tissues also show a loss of rDNA function with age (31). In older studies, a decrease was shown in detectable rDNA content in various aged tissues and interpreted as a loss of rDNA repeats (32). This finding has been controversial (33) and is an unlikely explanation of our data because of the fact that the observed decreases in spot intensity correspond to some regions of the repeat and not to others. Our studies show that the methylation-free proportion in the 5′-ETS drops significantly with age to only 5.0% in spermatozoa and 2.3% in liver of total rDNA sequences. This is consistent with the results of Swisshelm et al. (30), in which age-dependent hypermethylation events are specific to the 5′ region of the repeats.
A mechanism of age-dependent rDNA hypermethylation may involve 5′→3′ spreading of methylation that has been described for other genes in age-related disease, such as cancer (34). The nontranscribed spacers found upstream of rDNA repeats are heavily methylated (35), and may facilitate this process. How de novo methylation is targeted is one of the most fundamental unanswered questions in the study of the biology of DNA methylation. Much evidence supports the notion that repetitive sequences attract de novo methylation. This is observed in imprinted domains (36), transgenes (37), and retroviral sequences (38). It is possible that during aging the repetitive nature of rDNA cistrons makes them a target for de novo methylation over nonrepetitive single copy genes.
The bulk of genomic DNA methylation is reprogrammed during preimplantation development (39, 40). However, the methylation patterns of imprinted genes and some repetitive DNA sequences endure embryonic reprogramming (41–43). Whether or not aberrant hypermethylation of rDNA sequences from aged sperm persist into the adult offspring remains to be tested; aberrant methylation of rDNA could be partly responsible for the abnormalities observed in embryos sired by old animals.
Acknowledgments
We thank Tonia Doerksen, Valerie Serre, and Yue-Zhong Wu for helpful discussions and for technical support. C.O. is a recipient of the Maria Riche Montreal Children's Hospital Scholarship. J.M.T. is a Canadian Institutes of Health Research (CIHR) Investigator and a Scholar of the Fonds de Recherches en Santé du Québec (FRSQ). These studies were supported by grants from the National Institute on Aging (NIA 08321), CIHR, Fonds pour la Formation de Chercheurs et l'Aide à la Recherche, and FRSQ.
Abbreviations
- RLGS
restriction landmark genomic scanning
- BN
Brown Norway
- ETS
external transcribed spacer
- m5C
5-methylcytosine
- rDNA
ribosomal DNA
References
- 1.Crow J F. Nat Rev Genet. 2000;1:40–47. doi: 10.1038/35049558. [DOI] [PubMed] [Google Scholar]
- 2.Bird A. Genes Dev. 2002;16:6–21. doi: 10.1101/gad.947102. [DOI] [PubMed] [Google Scholar]
- 3.Bird A P, Wolffe A P. Cell. 1999;99:451–454. doi: 10.1016/s0092-8674(00)81532-9. [DOI] [PubMed] [Google Scholar]
- 4.Wilson V L, Smith R A, Ma S, Cutler R G. J Biol Chem. 1987;262:9948–9951. [PubMed] [Google Scholar]
- 5.Ono T, Takahashi N, Okada S. Mutat Res. 1989;219:39–50. doi: 10.1016/0921-8734(89)90039-8. [DOI] [PubMed] [Google Scholar]
- 6.Issa J P. Curr Top Microbiol Immunol. 2000;249:101–118. doi: 10.1007/978-3-642-59696-4_7. [DOI] [PubMed] [Google Scholar]
- 7.Gruenewald D A, Naai M A, Hess D L, Matsumoto A M. J Gerontol. 1994;49:B42–B50. doi: 10.1093/geronj/49.2.b42. [DOI] [PubMed] [Google Scholar]
- 8.Syntin P, Robaire B. J Androl. 2001;22:235–244. [PubMed] [Google Scholar]
- 9.Zirkin B R, Santulli R, Strandberg J D, Wright W W, Ewing L L. J Androl. 1993;14:118–123. [PubMed] [Google Scholar]
- 10.Serre V, Robaire B. Fertil Steril. 1998;70:625–631. doi: 10.1016/s0015-0282(98)00259-3. [DOI] [PubMed] [Google Scholar]
- 11.Doerksen T, Trasler J M. Biol Reprod. 1996;55:1155–1162. doi: 10.1095/biolreprod55.5.1155. [DOI] [PubMed] [Google Scholar]
- 12.Doerksen T, Benoit G, Trasler J M. Endocrinology. 2000;141:3235–3244. doi: 10.1210/endo.141.9.7661. [DOI] [PubMed] [Google Scholar]
- 13.Bellve A R. Methods Enzymol. 1993;225:84–113. doi: 10.1016/0076-6879(93)25009-q. [DOI] [PubMed] [Google Scholar]
- 14.Jue K, Bestor T H, Trasler J M. Biol Reprod. 1995;53:561–569. doi: 10.1095/biolreprod53.3.561. [DOI] [PubMed] [Google Scholar]
- 15.Bestor T H, Hellewell S B, Ingram V M. Mol Cell Biol. 1984;4:1800–1806. doi: 10.1128/mcb.4.9.1800. [DOI] [PMC free article] [PubMed] [Google Scholar]
- 16.Christman J K. Anal Biochem. 1982;119:38–48. doi: 10.1016/0003-2697(82)90662-5. [DOI] [PubMed] [Google Scholar]
- 17.Okazaki Y, Okuizumi H, Sasaki N, Ohsumi T, Kuromitsu J, Hirota N, Muramatsu M, Hayashizaki Y. Electrophoresis. 1995;16:197–202. doi: 10.1002/elps.1150160134. [DOI] [PubMed] [Google Scholar]
- 18.Zardo G, Tiirikainen M I, Hong C, Misra A, Feuerstein B G, Volik S, Collins C C, Lamborn K R, Bollen A, Pinkel D, et al. Nat Genet. 2002;32:453–458. doi: 10.1038/ng1007. [DOI] [PubMed] [Google Scholar]
- 19.Trasler J M, Hake L E, Johnson P A, Alcivar A A, Millette C F, Hecht N B. Mol Cell Biol. 1990;10:1828–1834. doi: 10.1128/mcb.10.4.1828. [DOI] [PMC free article] [PubMed] [Google Scholar]
- 20.Lindsay S, Bird A P. Nature. 1987;327:336–338. doi: 10.1038/327336a0. [DOI] [PubMed] [Google Scholar]
- 21.Monk M, Boubelik M, Lehnert S. Development (Cambridge, UK) 1987;99:371–382. doi: 10.1242/dev.99.3.371. [DOI] [PubMed] [Google Scholar]
- 22.Tra J, Kondo T, Lu Q, Kuick R, Hanash S, Richardson B. Mech Ageing Dev. 2002;123:1487–1503. doi: 10.1016/s0047-6374(02)00080-5. [DOI] [PubMed] [Google Scholar]
- 23.Chikaraishi D M, Buchanan L, Danna K J, Harrington C A. Nucleic Acids Res. 1983;11:6437–6452. doi: 10.1093/nar/11.18.6437. [DOI] [PMC free article] [PubMed] [Google Scholar]
- 24.Bird A P, Taggart M H. Nucleic Acids Res. 1980;8:1485–1497. doi: 10.1093/nar/8.7.1485. [DOI] [PMC free article] [PubMed] [Google Scholar]
- 25.Kunnath L, Locker J. Biochim Biophys Acta. 1982;699:264–271. doi: 10.1016/0167-4781(82)90116-6. [DOI] [PubMed] [Google Scholar]
- 26.Santoro R, Grummt I. Mol Cell. 2001;8:719–725. doi: 10.1016/s1097-2765(01)00317-3. [DOI] [PubMed] [Google Scholar]
- 27.Rattan S I. Exp Gerontol. 1996;31:33–47. doi: 10.1016/0531-5565(95)02022-5. [DOI] [PubMed] [Google Scholar]
- 28.Comai L. Braz J Med Biol Res. 1999;32:1473–1478. doi: 10.1590/s0100-879x1999001200004. [DOI] [PubMed] [Google Scholar]
- 29.Stancheva I, Lucchini R, Koller T, Sogo J M. Nucleic Acids Res. 1997;25:1727–1735. doi: 10.1093/nar/25.9.1727. [DOI] [PMC free article] [PubMed] [Google Scholar]
- 30.Swisshelm K, Disteche C M, Thorvaldsen J, Nelson A, Salk D. Mutat Res. 1990;237:131–146. doi: 10.1016/0921-8734(90)90019-n. [DOI] [PubMed] [Google Scholar]
- 31.Thomas S, Mukherjee A B. Mech Ageing Dev. 1996;92:101–109. doi: 10.1016/s0047-6374(96)01805-2. [DOI] [PubMed] [Google Scholar]
- 32.Johnson R, Strehler B L. Nature. 1972;240:412–414. doi: 10.1038/240412a0. [DOI] [PubMed] [Google Scholar]
- 33.Peterson C R, Cryar J R, Gaubatz J W. Arch Gerontol Geriatr. 1984;3:115–125. doi: 10.1016/0167-4943(84)90004-9. [DOI] [PubMed] [Google Scholar]
- 34.Turker M S. Oncogene. 2002;21:5388–5393. doi: 10.1038/sj.onc.1205599. [DOI] [PubMed] [Google Scholar]
- 35.Brock G J, Bird A. Hum Mol Genet. 1997;6:451–456. doi: 10.1093/hmg/6.3.451. [DOI] [PubMed] [Google Scholar]
- 36.Reinhart B, Eljanne M, Chaillet J R. Mol Cell Biol. 2002;22:2089–2098. doi: 10.1128/MCB.22.7.2089-2098.2002. [DOI] [PMC free article] [PubMed] [Google Scholar]
- 37.McBurney M W, Lau S, Jardine K, Yang X, Davies B. Genes Chromosomes Cancer. 2001;32:311–323. doi: 10.1002/gcc.1196. [DOI] [PubMed] [Google Scholar]
- 38.Arnaud P, Goubely C, Pelissier T, Deragon J M. Mol Cell Biol. 2000;20:3434–3441. doi: 10.1128/mcb.20.10.3434-3441.2000. [DOI] [PMC free article] [PubMed] [Google Scholar]
- 39.Kafri T, Ariel M, Brandeis M, Shemer R, Urven L, McCarrey J, Cedar H, Razin A. Genes Dev. 1992;6:705–714. doi: 10.1101/gad.6.5.705. [DOI] [PubMed] [Google Scholar]
- 40.Santos F, Hendrich B, Reik W, Dean W. Dev Biol. 2002;241:172–182. doi: 10.1006/dbio.2001.0501. [DOI] [PubMed] [Google Scholar]
- 41.Olek A, Walter J. Nat Genet. 1997;17:275–276. doi: 10.1038/ng1197-275. [DOI] [PubMed] [Google Scholar]
- 42.Morgan H D, Sutherland H G, Martin D I, Whitelaw E. Nat Genet. 1999;23:314–318. doi: 10.1038/15490. [DOI] [PubMed] [Google Scholar]
- 43.Hajkova P, Erhardt S, Lane N, Haaf T, El Maarri O, Reik W, Walter J, Surani M. Mech Dev. 2002;117:15. doi: 10.1016/s0925-4773(02)00181-8. [DOI] [PubMed] [Google Scholar]


