Abstract
Frame-shift mutations at microsatellites occur as a time-dependent function of polymerase errors followed by failure of postreplicational mismatch repair. A cell-culture system was developed that allows identification of intermediate mutant cells that carry the mutation on a single DNA strand after the initial DNA polymerase errors. A plasmid was constructed that contained 13 repeats of a poly(dC-dA)⋅poly(dG-dT) oligonucleotide immediately after the translation initiation codon of the enhanced GFP (EGFP) gene, shifting the EGFP gene out of its proper reading frame. The plasmid was introduced into human mismatch repair-deficient (HCT116, hMLH1-mutated) and mismatch repair-proficient (HCT116+chr3, hMLH1 wild type) colorectal cancer cells. After frame-shift mutations occurred that restored the EGFP reading frame, EGFP-expressing cells were detected, and two distinct fluorescent populations, M1 (dim cells) and M2 (bright cells), were identified. M1 cell numbers were stable, whereas M2 cells accumulated over time. In HCT116, single M2 cells gave rise to fluorescent colonies that carried a 2-bp deletion at the (CA)13 microsatellite. Twenty-eight percent of single M1 cells, however, gave rise to colonies with a mixed fluorescence pattern that carried both (CA)13 and (CA)12 microsatellites. It is likely that M1 cells represent intermediate mutants that carry (CA)13⋅(GT)12 heteroduplexes. Although the mutation rate in HCT116 cell clones (6.2 × 10⁻⁴) was 30 times higher than in HCT116+chr3 (1.9 × 10⁻⁵), the proportion of M1 cells in culture did not significantly differ between HCT116 (5.87 × 10⁻³) and HCT116+chr3 (4.13 × 10⁻³), indicating that the generation of intermediate mutants is not affected by mismatch-repair proficiency.
Keywords: mismatch repair‖frame-shift mutation‖microsatellite instability‖ mutation rate
Accurate duplication of cellular DNA is a critical step during cell growth, and it is crucial that the genetic material is reproduced with high fidelity. Eukaryotic DNA polymerase has been found to introduce an incorrect nucleotide approximately once in every 10,000 nucleotides incorporated into DNA (1). If these mismatches are not repaired, mutations will accumulate. The mismatch-repair system ensures postreplicational repair of single base–base mismatches or insertion/deletion mispairs, thus reducing the mutation rate (2).
Most of our understanding about mismatch repair has been derived from the DNA adenine methylase (Dam)-instructed MutHLS pathway in Escherichia coli (3). Proteins of the MutS family are remarkable sensors of DNA-replication errors. The MutS protein complex binds to DNA mispairs and interacts with the MutL protein complex (hMLH1 with PMS2), which signals downstream processes of mismatch repair (4).
The biological importance of the mismatch-repair system in humans is best reflected by the occurrence of cancer after deregulation of appropriate mismatch-repair activity in vivo. Germ-line mutations and somatic losses in genes involved in mismatch repair or epigenetic silencing of such genes through promoter hypermethylation increases the mutation rate of affected cells due to the inability to correct errors generated during DNA replication. The most harmful errors during DNA replication are insertions or deletions that occur within the coding region, because these typically generate frame-shift mutations, which usually abrogate protein function. Insertion or deletion errors during DNA replication occur most frequently at repetitive sequences called microsatellites.
The mutation rate at microsatellites is a function of two factors: the generation of polymerase errors and their removal by DNA mismatch repair. This mutation rate varies with length and nucleotide sequence of microsatellites. It has not been shown yet whether this variation is caused by a different probability of polymerase errors versus different repair efficiencies. We have developed a cell-culture system that allows the simultaneous measurement of polymerase errors and mismatch-repair efficiency in mammalian cells.
Materials and Methods
Cloning of pIREShyg2-Enhanced GFP (EGFP) Constructs.
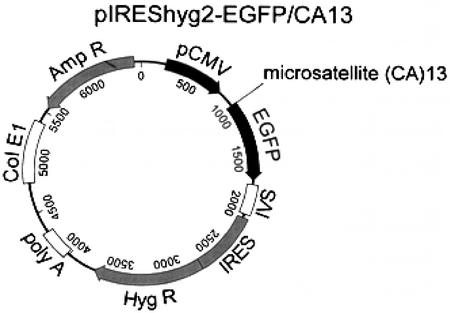
The EGFP gene was obtained by the digestion of pEGFP-N3 (CLONTECH) with BamHI and XbAI (New England Biolabs). A new PmeI–AscI site was created after the EGFP starting codon by PCR mutagenesis (primers: 5′-CGGGATCCGCCACCATGTTTAAACGGCGCGCCGTGAGCAAGGGCGAGG-3′ and 5′-ATCTTACTTGTACAGCTCGTCC-3′). The PCR product was digested with BamHI and EcoRV (New England Biolabs) and then used to replace the BamHI–EcoRV fragment in the plasmid pIREShyg2 (CLONTECH), which created the plasmid pIREShyg2-EGFP. The construct was transformed into DH5α. Clones were screened, and the sequence of the BamHI–EcoRV insert was checked by four overlapping cycle-sequencing reactions on an ABI Prism 310 sequencer (Perkin–Elmer Biosystems). A run of 13 dC-dA dinucleotide repeats (5′-CACACACACACACACACACACACACA-3′) was annealed to its complementary 13 dG-dT oligonucleotide (5′-CGCGTGTGTGTGTGTGTGTGTGTGTGTGTG-3′) and directionally cloned into the PmeI–AscI site of pIREShyg2-EGFP to generate the plasmid pIREShyg2-EGFP/CA13 (Fig. 1). The ligation product was transformed into Stbl2 (Life Technologies, Rockville, MD), and the cells were grown at 30°C. Positive colonies were selected by PCR, and the correct sequence of the microsatellite insert was confirmed.
Figure 1.
pIREShyg2-EGFP/CA13 plasmid. The microsatellite (CA)13 was inserted immediately after the EGFP start codon, thereby shifting the downstream portion of the gene out of its reading frame. Deletion of 2 bp or insertion of 4 bp restores the proper reading frame.
Transfection and Selection.
HCT116 colorectal cancer cells (ATCC no. CCL-247), which are mismatch repair-deficient by homozygous mutation of the hMLH1 gene, and HCT116+chr3 cells, which were mismatch repair-proficient through transfer of chromosome 3 (5), were grown in Iscove's modified Dulbeco's medium (Life Technologies) containing 2 nM glutamine and 10% FBS (Life Technologies). The medium for HCT116+chr3 also contained 400 μg/ml G418 (Life Technologies). Cells were plated at 2 × 10⁵ cells per well in 12-well plates. Cells were transfected with various pIREShyg2-EGFP/CA13 by using Effectene, a nonliposomal lipid (Qiagen, Germantown, MD). Selection with 150 μg/ml hygromycin B (Life Technologies) was started 24 h later. Single cell colonies were prepared by limiting dilution.
Southern Blot.
The copy number of plasmids integrated into the genome was identified by Southern blotting. Total cellular DNA from stably transfected HCT116 and HCT116+chr3 cells that had been grown from PCR-positive single cell colonies was isolated. Ten micrograms of total DNA were digested with BamHI, EcoRV, or both (New England Biolabs), resolved on a 1.2% agarose gel, and transferred to a nylon membrane (Hybond N+, Amersham Pharmacia). EGFP cDNA labeling, hybridization, and washing conditions have been described (6).
Microsatellite PCR.
Total cellular DNA from stably transfected HCT116 and HCT116+chr3 single cell colonies were PCR-amplified by using the primers 5′CA-EGFP and 3′CA-EGFP. Primers had been radiolabeled with 0.1 μCi (1 Ci = 37 GBq) of [γ-32P]dATP (DuPont/NEN). PCRs were carried out in a total volume of 3 μl containing 100 ng of DNA, 1.5 mM MgCl2, 25 pmol of each primer, 0.2 mM of dNTPs, 1× PCR buffer, and 1.25 units of Taq (Life Technologies). Amplification was performed for 38 cycles. PCR products were separated on 8% polyacrylamide gels containing 7.5 M urea followed by autoradiography. Microsatellite instability was determined by a change in the electrophoretic mobility of the PCR products.
Analysis of Mutant Cells by Flow Cytometry.
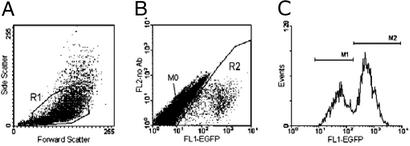
One thousand nonfluorescent cells were sorted into 24-well plates on a FACSVantage SE by using CloneCyt Plus sorting technology (Becton Dickinson Immunocytometry Systems, San Jose, CA). During a 5- to 13-day growth period, cultures were expanded as required to keep cells in exponential growth. Cells were trypsinized, washed in PBS containing 2% FBS, and resuspended in a total volume of 100 μl of PBS/2% FBS. Fifty microliters of cell suspension were analyzed on a FACSCalibur with CELLQUEST acquisition and analysis software (Becton Dickinson), and the cell counts were doubled to quantitate the total number of cells per well. To identify EGFP-positive cells, region 1 (R1) was set in the forward/side scatter and region 2 (R2) in the fluorescence 1 (FL1, green)/fluorescence 2 (FL2, red) scatter. Cells of R1 and R2 were plotted further on a fluorescence intensity histogram, and three populations were separated. The population displaying no fluorescence was called M0, populations with low fluorescence intensity M1, and those with high fluorescence intensity M2. The counts of M1 and M2 cells were expressed as percentage of R1 (total cell number).
Longitudinal experiments with HCT116+chr3 were carried up to 32 days. Cultures were expanded as needed to keep cells in exponential cell growth. When a T75 flask size was reached, cultures were split 1:10 to avoid larger culture volumes. For flow cytometry, cells were resuspended at a concentration of 2–4 × 10⁶ cells per ml. For quantitation of rare events (M2 cells), up to 3.6 × 10⁶ cells were analyzed over a 17-min period.
Fluorescence Microscopy.
Single cells from the M0–M2 populations were sorted into 96-well plates on a FACSVantage SE by using CloneCyt Plus. Index data from cell sorting [plate location, forward scatter, side scatter, FL1 (green), and FL2 (red)] were exported to Microsoft EXCEL worksheets by using FCSPRESS 1.1 (www.fcspress.com). Cells were grown to small colonies for 7 days and analyzed under an inverted fluorescence microscope (Nikon TE-200). Colonies with >50 cells were scored according to their fluorescence pattern as positive, negative, or mixed, and the results were linked to the index data of the deposited cell. DNA was extracted from colonies, a 227-bp product of plasmid DNA harboring the microsatellite sequence was amplified by using the primers 5′CA-EGFP and 3′CA-EGFP, and mutations were determined by sequencing.
Statistical Analysis and Estimation of Mutation Rate.
Characteristics of cell populations were compared by the Wilcoxon rank sum test or the χ2 test. The mutation rate is defined as the probability of a cell undergoing a mutation in its lifetime and expressed per microsatellite per cell per generation. We used two different approaches for estimating the mutation rate: (i) a method of the mean developed by Luria and Delbruck (7) and (ii) a maximum-likelihood method (8, 9). The method of the mean is moment-based, whereby the mutation rate is estimated as a function of the sample mean of the number of mutants. The formula used in the computation is r̂ = μN ln(μNC), where r̂ is the mean number of mutants in a culture, C is the number of parallel cultures, μ is the mutation rate, and N is the number of cells at risk of undergoing a mutation, which Luria–Delbruck assumed to be equal to the final number of cells in a culture. Four parallel cultures were used, and r̂ was estimated as the mean of the number of mutants across the four cultures. The total number of cells N was based on averaging across cultures. The formula listed above was used to estimate the mutation rate μ. To corroborate these estimates further, we used another approach based on the maximum-likelihood approach described by Lea and Coulson (8). The probability distribution of the number of mutants is nonstandard. The maximum-likelihood approach utilizes a recursive algorithm to compute this probability distribution and construct it as a function of the unknown mutation rate (9). The mutation rate was estimated from this function. A complete and accessible account of how to implement these two methods has been published recently (10). The mutation rate for each clone at each time point was estimated on the basis of these two methods. A single mutation rate then was computed by combining the clone and time-specific rates.
Results
Cloning of pIREShyg2-EGFP/CA13.
The plasmid pIREShyg2-EGFP allowed the expression of EGFP under the control of a constitutive cytomegalovirus promoter, which is active throughout the cell cycle. A (CA)13⋅(GT)13 oligonucleotide was inserted after the translation initiation codon of the EGFP gene, resulting in the plasmid pIREShyg2-EGFP/CA13 (Fig. 1). In this construct, the downstream portion of the EGFP gene had been shifted out of its reading frame, resulting in expression of a truncated missense peptide without fluorescence. Deletion of 2 bp or insertion of 4 bp within this dinucleotide repeat would shift the EGFP gene into the proper reading frame and cause expression of EGFP. The spontaneous mutation rates of mismatch repair-proficient HCT116+chr3 cells and mismatch repair-defective HCT116 human colorectal cancer cells were determined by quantitation of fluorescent cells in culture.
Characterization of Transfected Cell Clones.
After stable transfection, single cell clones were selected by using hygromycin B. After 12 days of expansion, most of the HCT116 clones displayed some fluorescent cells that were locally arranged as a subpopulation within or at the border of the growing colony. Fluorescent cells displayed a sector-shaped pattern, expanding from the center of the clone to the outer limits, such as clonal expansion after mutation in a single cell. This pattern indicated that after a frame-shift mutation, it was transferred to the cells of the next generation. None of the HCT116-chr3 transfectants displayed fluorescence-positive subpopulations.
Colonies were expanded further, and those carrying the construct were selected by PCR. After a 4-week period, the proportion of fluorescent cells within each clone was measured by flow cytometry. Between 0.43% and 1.88% (median 1.56%) of cells from HCT116 clones were fluorescent. In most HCT116+chr3 single-cell clones, no fluorescent cells were present (between 0.0% and 0.07%, median 0.0%), which is consistent with the mismatch-repair proficiency in this cell line.
Southern blots of DNA from PCR-positive colonies were performed to identify the number of plasmid copies integrated into genomic DNA. In HCT116, 5/5 clones analyzed exhibited single integration sites of pIREShyg2-EGFP/CA13 (clones A1.1–A1.3, A2.1, and A2.3). A single EGFP cDNA hybridization band was detected in one HCT116+chr3 clone (A3.1), and two integrations sites were detected in three (A3.3, A3.6, and A3.7) clones. We further tested whether frame-shift mutations could be detected by microsatellite PCR. A 227-bp sequence surrounding the (CA)13 microsatellite was amplified. In 5/5 HCT116 clones, all of which carried over 1% fluorescence-positive cells, a second band, 2 bp shorter, was observed (Fig. 2). PCR from the DNA of HCT116+chr3 cells produced a single band. These findings corresponded with our hypothesis that fluorescent HCT116 clones have undergone a deletion of 2 bp at the (CA)13 microsatellite.
Figure 2.
Microsatellite PCR of HCT116 and HCT116+chr3 single-cell clones. A 227-bp product including the (CA)13 microsatellite of the transfected plasmid was amplified with radiolabeled primers and separated by PAGE. In all HCT116 clones, a second band, 2 bp shorter, was observed. In HCT116+chr3 clones, a single 227-bp band was found. HCT116 cell clones display microsatellite instability by giving rise to a mutated subpopulation (which is likely to express EGFP). HCT116+chr3 clones are microsatellite-stable.
Mutations at the (CA)13 Microsatellite in HCT116.
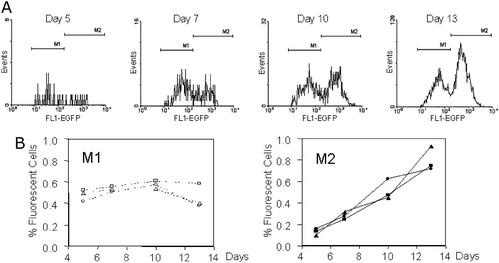
For the following experiments, three HCT116 clones (A1.3, A2.1, and A2.3) were selected. One thousand nonfluorescent cells were sorted into each well of a 24-well plate, and cells were exponentially grown for 5–13 days. At specified time points, four wells were analyzed in parallel by using flow cytometry. Three different populations were identified according to their fluorescence intensity (Fig. 3). The population displaying no fluorescence was designated M0, the population with low fluorescence M1, and the population with high fluorescence intensity M2. The M2 population accumulated over time, whereas M1 showed little change, indicating that M1 and M2 are distinct populations (Fig. 4).
Figure 3.
Analysis of mutation rate by flow cytometry. One thousand nonfluorescent HCT116 cells had been sorted into a 24-well plate, and cells were cultured for 13 days, harvested, and analyzed by flow cytometry. Regions R1 and R2 were set according to cell size (A) and fluorescence (B). When cells of R1 and R2 were analyzed on an EGFP histogram (C), two distinct populations were retrieved. The population displaying no fluorescence was designated M0, the population with low EGFP intensity was designated M1, and the population with high EGFP intensity was designated M2.
Figure 4.
M1 and M2 are distinct populations. Sorted HCT116 cells were analyzed after 5, 7, 10, and 13 days of culture, and EGFP histograms (A) were generated as described (Fig. 3). At days 5 and 7, the M1 population was larger than M2. At day 10, both populations were approximately equal in size, and at day 13 the M1 population was smaller than M2 (note the different scale of the y axis). M1 and M2 data were expressed further as percentage of R1 and plotted for each time point (B) and for each of three different HCT116 cell clones (A1.3, circles; A2.1, squares; A2.3, triangles). The M1 population showed little change (average proportion of fluorescent cells: 0.51%; 95% confidence interval 0.47–0.55%), and the M2 population accumulated over time. Each data point represents the mean of quadruplicate wells.
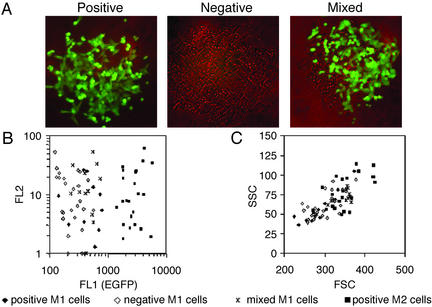
To further characterize these EGFP-expressing cells, single cells from the M1 and M2 populations were sorted into 96-well plates, grown for 7 days, and analyzed by using an inverted fluorescence microscope. The mean cloning efficiency from four independent experiments was 4.9% (3.4–6.4%) in the M1 population and 7.8% (5.8–9.8%) in the M2 population (P = 0.03). Of 85 total colonies, M1 cells gave rise to 14 fluorescence-positive (16%), 47 negative (55%), and 24 mixed colonies (28%), which contained about half positive and half negative cells (Fig. 5A). Of 105 colonies derived from the M2 population, 103 were fluorescence-positive (98%), and two (2%) had a mixed pattern. Sequence analysis of DNA from 61 of 61 positive colonies revealed a 2-bp deletion at the (CA)13 microsatellite, thereby shifting the EGFP gene into the reading frame. In 13 of 13 negative colonies grown from M1 cells, the presence of the wild-type (CA)13 sequence was confirmed by sequencing. Of 24 microsatellite sequences that were analyzed from mixed colonies of the M1 population, 24 displayed an overlap of (CA)12 and (CA)13 sequences. Two of two mixed colonies derived from M2 cells showed an overlap of (CA)12 and (CA)11 sequences. When M0 cells were sorted as negative control, 73 negative but no mixed or positive colonies were grown. DNA from 17 randomly selected colonies was subjected to sequencing, and the presence of a wild-type (CA)13 sequence was confirmed in all. These findings indicate that positive colonies are derived from definitive mutant cells that contain the mutant (CA)12⋅(GT)12 microsatellite. Negative colonies are grown from wild-type cells that contain a wild-type (CA)13⋅(GT)13 microsatellite. In contrast, mixed M1 colonies are partially derived from cells that contain a (CA)13⋅(GT)12 heteroduplex, termed an “intermediate mutant.”
Figure 5.
Index sorting of M1 and M2 populations. Single cells in the M1 (dim fluorescence, gated FL1 intensity 126–813) or M2 (strong fluorescence, gated FL1 intensity 1,263–9,910) population were sorted into 96-well plates and cultured for 7 days. (A) The colony phenotype (positive, negative, or mixed colonies, final magnification ×100) was determined by fluorescence microscopy. Index data [plate location, forward scatter (FSC), side scatter (SSC), FL1 (green), and FL2 (red)] that had been collected at the time of cell sorting were linked later to the colony phenotype. M1 cells that gave rise to positive colonies were labeled “positive M1 cells” (n = 10), and M1 cells that gave rise to negative or mixed colonies were labeled “negative M1 cells” (n = 26) or “mixed M1 cells” (n = 12), respectively. M2 cells gave rise only to positive colonies and were designated “positive M2 cells” (n = 23). (B) At the time of cell sorting, negative M1 cells expressed significantly less EGFP than positive M1 cells or mixed M1 cells (see text). (C) When comparing cell size and granularity (FSC/SSC), the mixed M1 cells colocalized within the other populations, indicating that they are single cells.
To further rule out the possibility that mixed colonies were derived from sorting a wild-type and a mutant cell attached to each other into a single well, index data that had been collected at the initial cell sorting were linked to colony phenotype (Fig. 5B). M1 cells that gave rise to positive colonies were designated “positive M1 cells”; M1 cells that gave rise to negative or mixed colonies were designated “negative M1 cells” or “mixed M1 cells,” respectively. M2 cells gave rise to positive colonies only and were called “positive M2 cells.” When M1 index data were compared, the mean FL1 intensity of negative M1 cells (FL1 intensity 262, 95% confidence interval 218–306) was lower than that of positive M1 cells (FL1 intensity 494, 95% confidence interval 358–629; P = 0.0025 by Wilcoxon rank sum test) or mixed M1 cells (FL1 intensity 469, 95% confidence interval 380–558; P = 0.0005). In comparison, the FL1 intensity of positive M2 cells was 2,907 (95% confidence interval 2,424–3,389). No difference was seen for the FL2 intensity (nonspecific red fluorescence) in the different populations. When comparing data from the forward/side scatter (representing cell size and cell granularity), mixed M1 cells colocalized within the other populations (Fig. 5C). It therefore is unlikely that mixed colonies were derived from sorting two attached cells into a single well. This finding strongly supports our previous consideration that mixed colonies are derived from an intermediate mutant cell that carries a (CA)13⋅(GT)12 or a (CA)12⋅(GT)13 heteroduplex.
Mutation Rate at the (CA)13 Microsatellite in HCT116 and HCT116+chr3.
Data from M2 cells from each of the time points were used to calculate the mutation rate by the method of the mean and the maximum-likelihood approaches. A single mutation rate was calculated by taking a weighted average of the mutation rates at the different time points, the weights of which were chosen to minimize the variance of the estimate. Both methods were repeated for the three different clones and revealed very similar mutation rates, giving credibility to the experimental and computational methods (Table 1). The combined mutation rate at the microsatellite sequence across HCT116 cell clones was 6.17 × 10⁻⁴ ± 6.91 × 10⁻⁵.
Table 1.
Mutation rates at a (CA)13 microsatellite for HCT116 and HCT116+chr3 single-cell clones by two different computational methods
| Method of the mean | Maximum likelihood | |
|---|---|---|
| HCT116 | ||
| A1.3 | 5.9 × 10⁻⁴ ± 1.7 × 10⁻⁴ | 5.9 × 10⁻⁴ ± 1.10 × 10⁻⁴ |
| A2.1 | 6.2 × 10⁻⁴ ± 1.97 × 10⁻⁴ | 6.0 × 10⁻⁴ ± 1.3 × 10⁻⁴ |
| A2.3 | 6.4 × 10⁻⁴ ± 1.9 × 10⁻⁴ | 6.7 × 10⁻⁴ ± 1.2 × 10⁻⁴ |
| HCT116+chr3 | ||
| A3.1 | 2.1 × 10⁻⁵ ± 6.5 × 10⁻⁶ | 1.8 × 10⁻⁵ ± 1.1 × 10⁻⁵ |
| A3.2 | 2.4 × 10⁻⁵ ± 5.4 × 10⁻⁶ | 1.9 × 10⁻⁵ ± 6.7 × 10⁻⁶ |
| A3.3 | 2.0 × 10⁻⁵ ± 4.4 × 10⁻⁶ | 2.0 × 10⁻⁵ ± 6.7 × 10⁻⁶ |
Rates are expressed as mutations in the (CA)13 sequence per cell per generation.
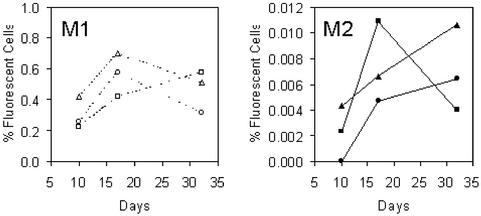
Two of the HCT116+chr3 cell clones contained two copies each of the microsatellite-EGFP construct. Because EGFP expression is dominant, a mutation in only one copy of the microsatellites is necessary to produce a fluorescent cell. The mutation rates from these clones were divided by 2 to obtain mutation rates per microsatellite sequence. In HCT116+chr3, the absolute numbers of mutant M2 cells at day 10 were 100 times lower than in HCT116. The cells were cultured for longer periods, and up to 3.6 × 10⁶ of total cells were analyzed by flow cytometry for detection of rare M2 events. All clones showed an increase in the M2 population between days 10 and 17 (Fig. 6) and in two of three clones between days 17 and 32. When mutation rates were estimated, the different clones showed similar results (Table 1). The combined mutation rate across HCT116+chr3 cell clones was 1.92 × 10⁻⁵ ± 4.37 × 10⁻⁶. Therefore, mutations at a defined (CA)13 microsatellite are 30 times less frequent in HCT116+chr3 than in hMLH1-deficient HCT116 (P < 0.0001 by χ2 test).
Figure 6.
M1 and M2 populations in HCT116+chr3 cells. Sorted HCT116+chr3 cells (containing a wild-type copy of hMLH1) were analyzed after 10, 17, and 32 days of culture, and the M1 and M2 populations (percent cells of R1) were plotted for each time point and for each of three different clones (A3.1, circles; A3.3, squares; A3.7, triangles). The M1 population showed little change over time and was similar in size as seen in HCT116 cell clones (average size 0.45%; 95% confidence interval 0.34–0.55%). Although M2 cells were rare events (note different scales on the y axes), they also showed an increase over time. The M2 population of the A3.3 clone, however, had dropped at day 32, possibly due to dilution errors during serial passage of the cells.
Proportion of Intermediate Mutant Cells in HCT116 and HCT116+chr3.
We concluded that approximately one fourth of the M1 cell population in HCT116 (i.e., the 28% that grow out mixed colonies) included early events after polymerase error, which were intermediate mutant cells carrying DNA heteroduplexes at the poly(dC-dA)⋅poly(dG-dT) sequence. The proportion of M1 cells was estimated further as the ratio of the number of M1 cells from each of the time points divided by the number of negative M0 cells. Between days 5 and 13, the average ratio of the M1 population was 5.53 × 10⁻³ ± 2.35 × 10⁻⁴ (clone A1.3), 6.34 × 10⁻³ ± 3.61 × 10⁻⁴ (clone A2.1), and 5.74 × 10⁻³ ± 3.22 × 10⁻⁴ (clone A2.3). When the HCT116+chr3 cultures were maintained for 1 month, the population changed little over time (Fig. 6). The M1 populations in HCT116+chr3 cells were 3.89 × 10⁻³ ± 8.82 × 10⁻⁴ (clone A3.1), 3.35 × 10⁻³ ± 6.83 × 10⁻⁴ (clone A3.3), 5.04 × 10⁻³ ± 6.83 × 10⁻⁴ (clone A3.7). The combined proportion of M1 cells in HCT116 (5.87 × 10⁻³ ± 1.83 × 10⁻⁴) was therefore similar to HCT116+chr3 cells (4.13 × 10⁻³ ± 4.44 × 10⁻⁴; P = 0.8 by χ2 test), indicating that mismatch-repair proficiency per se has no or little influence on the proportion of M1 cells. It therefore is likely that the proportion of M1 cells in a culture correlates with the generation of polymerase errors rather than DNA mismatch-repair proficiency.
Discussion
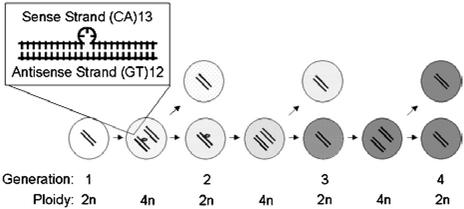
In this work we developed an experimental model that reflects both steps in the evolution of microsatellite mutations that permits an estimate of polymerase errors independently from mismatch-repair proficiency. A (CA)13 microsatellite located within the EGFP gene was introduced as a mutational target in two near-isogenic cell lines, HCT116 and HCT116+chr3. After the initial polymerase error, one of the two newly synthesized DNA strands acquires a deletion of 2 bp. If not repaired, cells that carry this mutation follow a certain pathway (Fig. 7). If a single intermediate mutant cell that contains a (CA)13⋅(GT)12 heteroduplex is cloned, it gives rise to a mixed-colony phenotype. Likewise, the detection of mixed colonies that have been grown out of single M1 cells provides strong evidence for the existence of intermediate mutant cells within the M1 cell population. Sequencing of DNA confirmed the coexistence of mutated and wild-type microsatellites in mixed colonies. In the theoretical model, the composition of mixed colonies that have grown from intermediate mutants of generation one (as outlined in Fig. 7) would be 25% positive (mutant) and 75% negative (wild-type) cells, and from intermediate mutants of generation two, 50% positive and 50% negative cells. Currently, we cannot determine whether the intermediate mutants of M1 are derived from the first or second generation after the initial polymerase error.
Figure 7.
Pathway of postreplicational frame-shift mutations. After the initial polymerase error, one of the two newly synthesized DNA strands loses 2 bp, (CA)13 to (CA)12 or (GT)13 to (GT)12. If this event occurs on the antisense strand [(GT)13 to (GT)12], the intermediate mutant of generation one starts to express EGFP and the cell becomes dimly fluorescent. If the mutation is not repaired, the cell divides into a wild-type cell and an intermediate mutant cell of generation two. The wild-type cell loses and the intermediate mutant cell gains fluorescence. If the mutation is not repaired, the intermediate mutant cell of generation two gives rise to another wild-type cell, and a mutant cell now carriers two mutant strands at the microsatellite sequence [(CA)12⋅(GT)12].
Several control experiments were performed to exclude other possible explanations for the presence of (CA)12/(CA)13 sequence overlaps in DNA from mixed colonies of M1 cells. First, the Southern blots showed that only one copy of the plasmid was integrated in HCT116 cell clones. If two copies of the plasmid had been present, sequencing of fluorescent colonies would have displayed the second wild-type [(CA)13] copy of the plasmid. Second, the index-sorting experiment excludes two attached cells. The accuracy of single cell sorting was also demonstrated for HCT116 M0 and HCT116 M2 cells. M1 cells derived from HCT116+chr3 clones did not produce any mixed colonies either. Furthermore, the frequency of M1 cells was stable in both HCT116 and HCT116+chr3 clones, whereas M2 cells accumulated over time. If the M1 cells had been derived from falsely sorted M2 cells, M1 cells would have increased over time as did M2. Third, if the mutation occurred after cell sorting during colony growth, the expected frequency of mixed colonies would have been 1 in 1,621 events and would have been seen in M0 cells. The observed frequency, however, was 24 in 85 M1 colonies and 0 in 73 M0 colonies.
Our interpretation is that the fluorescence intensity of a mutated cell relates to the period during which EGFP had been expressed. Cells that have just started to produce EGFP will continuously increase in fluorescence intensity until they reach the EGFP-production/degradation equilibrium. It therefore is not surprising that intermediate mutant cells were found in the M1 population with dim fluorescence and that definitive mutant cells expressed a strong fluorescence phenotype.
Because the sense strand of DNA is transcriptionally inactive, the M1 population can only reflect frame-shift mutations of the antisense strand [(GT)12]. Those occurring on the sense strand would be undetectable until late S phase of intermediate mutants of generation two (Fig. 7). In HCT116+chr3, we could expect that all cells are repaired in generation one, and none of the intermediate mutant cells would be passed onto generation two. This means that in mismatch repair-proficient cells, polymerase errors are measured only on the antisense strand. Theoretically, in mismatch repair-deficient HCT116 cells, the M1 population is composed of intermediate antisense mutants of generation one as well as intermediate antisense mutants of generation two and intermediate sense mutants of the late generation two. The fluorescence intensity of mixed M1 cells was the same as that of positive M1 cells but of course was significantly higher in positive M2 cells. We were unable to characterize the composition of the M1 population in HCT116+chr3 cells further, because cloning of single M1 cells from HCT116+chr3 produced only fluorescence-negative colonies with (CA)13 wild-type microsatellites, as predicted (data not shown).
Might the rather large proportion of nonfluorescent wild-type colonies in the M1 population of HCT116 clones be due to the lack of perfect cell sorting? Autofluorescence was minimized by using FL1–FL2 scatter. In HCT116+chr3, only 2 of 3.7 × 10⁶ counted events were picked up in the M1 gate by using nontransfected control cells compared with 4,927 of 1.1 × 10⁶ counts in the transfected clones. Although wild-type daughter cells of intermediate mutants are unable to express EGFP, they could have been detected in the M1 gate if they had inherited fluorescent protein from their parental generation. It is also possible that some of the dim fluorescence in wild-type M1 cells is derived from errors of the transcription/translation machinery rather than errors of DNA replication. We currently have no data to test this hypothesis, but it could explain how a negative colony grows from an M1 cell. Residual repair activity or selective apoptosis of intermediate mutant cells may also explain this rather large proportion of wild-type M1 cells. Indirect evidence of apoptosis is demonstrated by the lower cloning efficiency of M1 cells compared with M2 cells. Because HCT116 expresses a truncated form of the hMLH1 gene, these findings would either point to an hMLH1-independent mechanism or a mechanism that relies on the N-terminal 252 aa of the hMLH1 protein (11).
Mutation-rate analysis with this culture system has some advantages over the bacterial antibiotic-resistance gene method (12). It excludes the growth of preexisting mutants by the sorting of fluorescence-negative cells and has an objective reporter measurement, whereas antibiotic resistance varies with the antibiotic concentration used. Furthermore, the value of our model lies in its ability to determine the relative influence of polymerase errors and mismatch repair on the ultimate rate of frame-shift mutations. It allows the enrichment for any of these populations and can be applied for measuring spontaneous or chemically induced frame-shift mutations on different genetic backgrounds.
Acknowledgments
We are grateful to James R. Feramisco and Stephen McMullen for assistance in fluorescence microscopy and digital imaging and to Richard D. Kolodner for critical discussion. This work was supported by National Institutes of Health Grant ROI-CA72851 (to C.R.B.), the Research Service of the Department of Veterans Affairs, and Austrian Science Fund Grant J1702-MED (to C.G.).
Abbreviations
- EGFP
enhanced GFP
- R1 and R2
regions 1 and 2, respectively
- FL1 and FL2
fluorescence 1 and 2, respectively
References
- 1.Loeb L A, Kunkel T A. Annu Rev Biochem. 1982;51:429–457. doi: 10.1146/annurev.bi.51.070182.002241. [DOI] [PubMed] [Google Scholar]
- 2.Kolodner R D, Marsischky G T. Curr Opin Genet Dev. 1999;9:89–96. doi: 10.1016/s0959-437x(99)80013-6. [DOI] [PubMed] [Google Scholar]
- 3.Fishel R, Kolodner R D. Curr Opin Genet Dev. 1995;5:382–395. doi: 10.1016/0959-437x(95)80055-7. [DOI] [PubMed] [Google Scholar]
- 4.Fishel R. Nat Med. 1999;5:1239–1241. doi: 10.1038/15191. [DOI] [PubMed] [Google Scholar]
- 5.Koi M, Umar A, Chauhan D P, Cherian S P, Carethers J M, Kunkel T A, Boland C R. Cancer Res. 1994;54:4308–4312. [PubMed] [Google Scholar]
- 6.Gasche C, Chang C L, Rhees J, Goel A, Boland C R. Cancer Res. 2001;61:7444–7448. [PubMed] [Google Scholar]
- 7.Luria S E, Delbruck M. Genetics. 1943;28:491–511. doi: 10.1093/genetics/28.6.491. [DOI] [PMC free article] [PubMed] [Google Scholar]
- 8.Lea D E, Coulson C A. J Genet. 1949;49:264–285. doi: 10.1007/BF02986080. [DOI] [PubMed] [Google Scholar]
- 9.Sarkar S, Ma W T, Sandri G H. Genetica. 1992;85:173–179. doi: 10.1007/BF00120324. [DOI] [PubMed] [Google Scholar]
- 10.Rosche W A, Foster P L. Methods. 2000;20:4–17. doi: 10.1006/meth.1999.0901. [DOI] [PMC free article] [PubMed] [Google Scholar]
- 11.Papadopoulos N, Nicolaides N C, Wei Y F, Ruben S M, Carter K C, Rosen C A, Haseltine W A, Fleischmann R D, Fraser C M, Adams M D. Science. 1994;263:1625–1629. doi: 10.1126/science.8128251. [DOI] [PubMed] [Google Scholar]
- 12.Twerdi C D, Boyer J C, Farber R A. Proc Natl Acad Sci USA. 1999;96:2875–2879. doi: 10.1073/pnas.96.6.2875. [DOI] [PMC free article] [PubMed] [Google Scholar]


