

Abstract
Acetylcholinesterase (AChE) terminates nerve-impulse transmission at cholinergic synapses by rapid hydrolysis of the neurotransmitter, acetylcholine. Substrate traffic in AChE involves at least two binding sites, the catalytic and peripheral anionic sites, which have been suggested to be allosterically related and involved in substrate inhibition. Here, we present the crystal structures of Torpedo californica AChE complexed with the substrate acetylthiocholine, the product thiocholine and a nonhydrolysable substrate analogue. These structures provide a series of static snapshots of the substrate en route to the active site and identify, for the first time, binding of substrate and product at both the peripheral and active sites. Furthermore, they provide structural insight into substrate inhibition in AChE at two different substrate concentrations. Our structural data indicate that substrate inhibition at moderate substrate concentration is due to choline exit being hindered by a substrate molecule bound at the peripheral site. At the higher concentration, substrate inhibition arises from prevention of exit of acetate due to binding of two substrate molecules within the active-site gorge.
Keywords: acetylcholinesterase, enzyme catalysis, kinetic crystallography, substrate inhibition, substrate traffic
Introduction
The principal role of acetylcholinesterase (AChE, EC 3.1.1.7) is termination of impulse transmission at cholinergic synapses by rapid hydrolysis of the neurotransmitter acetylcholine (ACh; Rosenberry, 1975). In a first step, the enzyme is acetylated and the choline product expelled. A water molecule then regenerates the free enzyme with concomitant release of acetic acid. As required by its biological function, AChE is a very efficient enzyme, with a turnover of 103–104 s−1, operating at a speed near the diffusion limit (reviewed by Quinn, 1987; Silman and Sussman, 2005). AChE is the target of nerve agents (Millard et al, 1999), anti-Alzheimer drugs (reviewed by Greenblatt et al, 2003), and insecticides (Smissaert, 1964), and indeed has been incorporated into biosensors for both insecticides and nerve agents (Marty et al, 1992). An understanding of its mode of action thus goes beyond academic interest.
Solution of the crystal structure of Torpedo californica (Tc) AChE (Sussman et al, 1991) revealed, unexpectedly, that its active site is buried at the bottom of a narrow gorge, about 20 Å deep, lined with conserved aromatic residues (Figure 1). This raised cogent questions as to how traffic of substrates and products, to and from the active site, can occur so rapidly. The active-site gorge is only ∼5 Å wide at a bottleneck formed by the van der Waals surfaces of Tyr121 and Phe330 (residue numbers refer to the TcAChE sequence throughout the manuscript unless stated otherwise). As the diameter of the quaternary moiety of choline is 6.4 Å, substantial breathing motions of gorge residues are required for traffic of substrates and products to occur.
Figure 1.
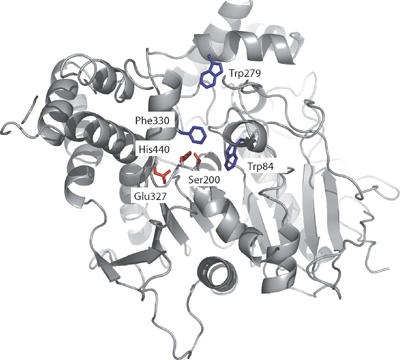
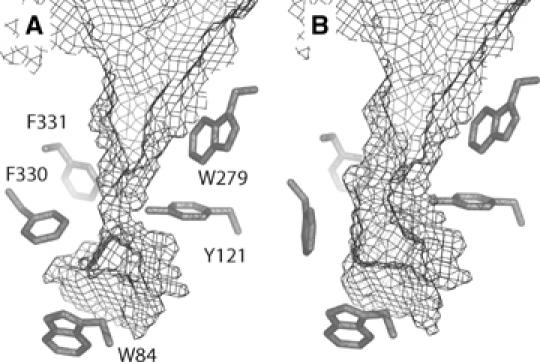
3D structure of native TcAChE (pdb access code 1EA5), highlighting the catalytic triad in red, Trp84 in the CAS, Trp279 at the PAS, and the bottleneck residue Phe330 in blue.
Rather than displaying Michaelis–Menten kinetics, AChE is inhibited at high substrate concentrations (Alles and Hawes, 1940; Marcel et al, 1998; Johnson et al, 2003). Like butyrylcholinesterase (BChE) (Eriksson and Augustinsson, 1979; Masson et al, 1996), a structurally homologous enzyme (Nicolet et al, 2003), certain AChE species can be activated at low substrate concentrations (Marcel et al, 1998; Brochier et al, 2001). All current kinetic models for AChE propose the existence of at least two substrate-binding sites, the active site, near the bottom of the active-site gorge, and the peripheral anionic site (PAS), near its entrance. Binding of ligands at the PAS affects catalytic activity (Bergmann et al, 1950; Changeux, 1966; Belleau et al, 1970; Roufogalis and Quist, 1972; Taylor and Lappi, 1975).
The active site is composed of two subsites. In the catalytic anionic subsite (CAS), it has been proposed that the choline moiety of ACh is stabilized principally via a cation-π interaction with Trp84, and also interacts with Glu199 and Phe330 (Sussman et al, 1991). A similar cation-π interaction occurs in human BChE (HuBChE), where Trp82 interacts with the product choline and the substrate butyrylthiocholine (Nicolet et al, 2003). The esteratic subsite in TcAChE contains a typical serine-hydrolase catalytic triad, Ser200-His440-Glu327. A substantial contribution to ACh binding within the active site also arises from stabilization of the carbonyl oxygen within the oxyanion hole, Gly118, Gly119 and Ala201, and of the acetyl group in the ‘acyl-pocket', Trp233, Phe288, Phe290 and Phe331 (Harel et al, 1996).
The PAS contains three principal amino acids, Trp279, Tyr70 and Asp72. This was established by site-directed mutagenesis and by binding of inhibitors such as propidium, BW284C51, d-tubocurarine and the mamba venom toxin, fasciculin (Radic et al, 1991, 1994; Barak et al, 1994; Eichler et al, 1994), as well as by solution of the 3D structures of complexes with decamethonium (Harel et al, 1993), fasciculin (Bourne et al, 1995; Harel et al, 1995), BW284C51 (Felder et al, 2002) and, most recently, of complexes of three low-molecular-weight PAS inhibitors with mouse AChE (Bourne et al, 2003). The fact that, at high concentrations, ACh affects the binding of PAS inhibitors suggests that the site at which they bind is equivalent to, or overlaps with, the PAS for ACh (Radic et al, 1991, 1997; Barak et al, 1994; Eichler et al, 1994; Eastman et al, 1995; Rosenberry et al, 1999). It has also been proposed that the PAS plays a role in substrate inhibition (Radic et al, 1991; Shafferman et al, 1992; Eichler et al, 1994; Rosenberry et al, 1999; Johnson et al, 2003), by a mechanism in which binding of ACh at the PAS hampers choline exit from the active site (Shafferman et al, 1992; Rosenberry et al, 1999; Johnson et al, 2003, Stojan et al, 2004).
It was suggested earlier that substrate inhibition involves retardation of deacetylation owing to binding of ACh to the acetylated enzyme (Krupka and Laidler, 1961). A combination of these models led to the proposal of a more sophisticated mechanism for substrate inhibition, which involves binding of two ACh molecules in the gorge of the acetylated enzyme, thereby obstructing access of water, and thus hindering deacetylation (Stojan et al, 2004). The molecular basis for substrate inhibition of AChE, however, remains controversial.
Despite the extensive kinetic and structural studies outlined above, no direct structural evidence has been presented for the mode of binding of a substrate to AChE. In the following, we describe the crystal structures of four catalytically relevant complexes of TcAChE: one with a nonhydrolysable substrate analogue, 4-oxo-N,N,N-trimethylpentanaminium (OTMA), two with the enzymatic substrate acetylthiocholine (ATCh) soaked into the crystal at two different concentrations and one with the product thiocholine (TCh), solved at 2.6, 2.3, 2.15 and 1.95 Å resolution, respectively. Our results provide direct structural insight into the TcAChE catalytic pathway, through a series of ‘snapshots' of this enzyme in action. Furthermore, they present a structural view of the mechanism(s) resulting in substrate inhibition.
Results
Kinetics of ATCh hydrolysis by TcAChE
The rate of hydrolysis of ATCh by TcAChE was measured as a function of ATCh concentration (Figure 2). Enzymatic activity follows an apparent Michaelian behaviour up to 0.5 mM ATCh, above which concentration substrate inhibition is observed, and the specific activity gradually decreases to zero. The data were fitted by multiple nonlinear regressions using a model that assumes two substrate-inhibition mechanisms (for details, see Stojan et al, 2004). The transition between the two mechanisms was calculated to be at 100 mM, where both substrate-inhibited species are populated to a similar extent (see Supplementary data for more details). Substrate concentrations below (20 mM) and above (500 mM) this transition were chosen for the crystal soaks, in order to preferentially accumulate either one or the other of the two substrate-inhibited species. In order to address the influence of changes in ionic strength, we repeated the activity measurements in the presence of 270 mM and 1 M NaCl (i.e. at ionic strengths that exceed the maximum ionic strength in Figure 2; data not shown). The activity curves with NaCl are shifted to higher substrate concentrations, yet the shape of the activity curves, with and without NaCl, is virtually identical, with a deviation from a single substrate inhibition mechanism being visible in all cases.
Figure 2.
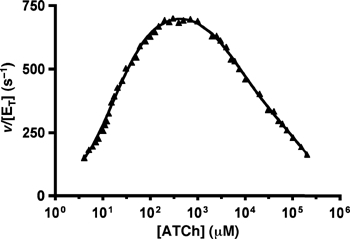
pS curve for ATCh hydrolysis by TcAChE. The rate of hydrolysis (triangles) is shown as a function of ATCh concentration. The data were fitted (plain line; global correlation coefficient of 0.9984) by using an equation based on a model accounting for two different substrate inhibition phenomena (Stojan et al, 2004). The following set of kinetic parameters describes the data: acetylation rate: k2=65300 s−1; deacetylation rate: k3=872 s−1; substrate affinity for the PAS: KP=136 μM; ratio of substrate molecules at the PAS sliding to the CAS of the free enzyme: 1/KL=0.089; ratio of substrate molecules at the PAS sliding to the CAS of the acetylenzyme: 1/KLL=0.0016; coefficient for activation of deacetylation due to the PAS being occupied by a substrate molecule: a=1; coefficient for inhibition of choline exit due to the PAS being occupied by a substrate molecule: b=0.008. The transition between the two-substrate inhibition mechanisms was calculated to occur at around 100 mM (see Supplementary data for details).
Structure of the OTMA/TcAChE complex (2.6 Å)
OTMA differs from ACh only in the replacement of the ester oxygen by a carbon (Figure 3). In the OTMA/TcAChE complex, two OTMA molecules are seen, one within the active site and one at the PAS (Figure 4A). Binding of OTMA in the active site produces minor shifts (<0.5 Å) in Ser200 and His440, hydrogen bonding within the catalytic triad being conserved. OTMA is positioned between Ser200 and Trp84 (Figure 4A and B). Its quaternary group makes cation-π interactions with Trp84 and Phe330, with distances between the two closest carbon atoms of 3.6 and 5.5 Å, respectively. Further stabilization of the quaternary moiety can be ascribed to electrostatic interaction with the acidic side chain of Glu199 (distance between Glu199Oɛ2 and the quaternary nitrogen: 4.2 Å). The carbonyl oxygen hydrogen bonds to Gly118N, Gly119N and Ala201N in the oxyanion hole (distances: 2.9, 2.5 and 2.7 Å, respectively). The position of the carbonyl carbon of the substrate analogue relative to Ser200Oγ is modelled at a covalent-bonding distance of 1.4 Å (Figure 4B). An attempt to model a nonbonded interaction (2.6 Å) produced a strong discrepancy with the experimental electron density (cf. Materials and methods).
Figure 3.
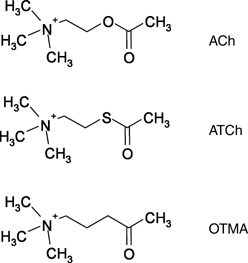
Structures of ACh, ATCh and 4-oxo-N,N,N-trimethylpentanaminium (OTMA) iodide.
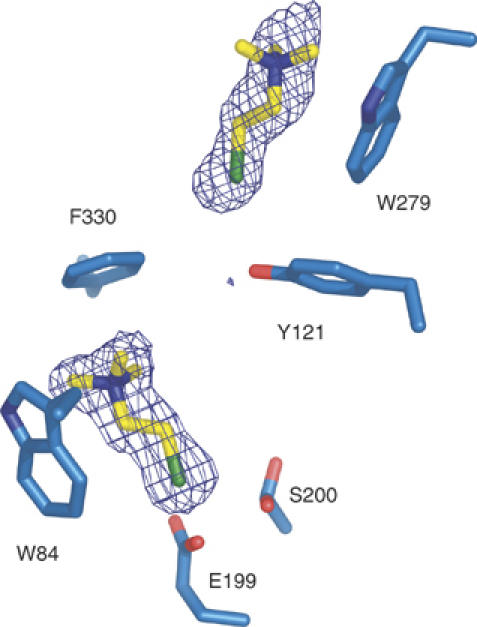
Figure 4.
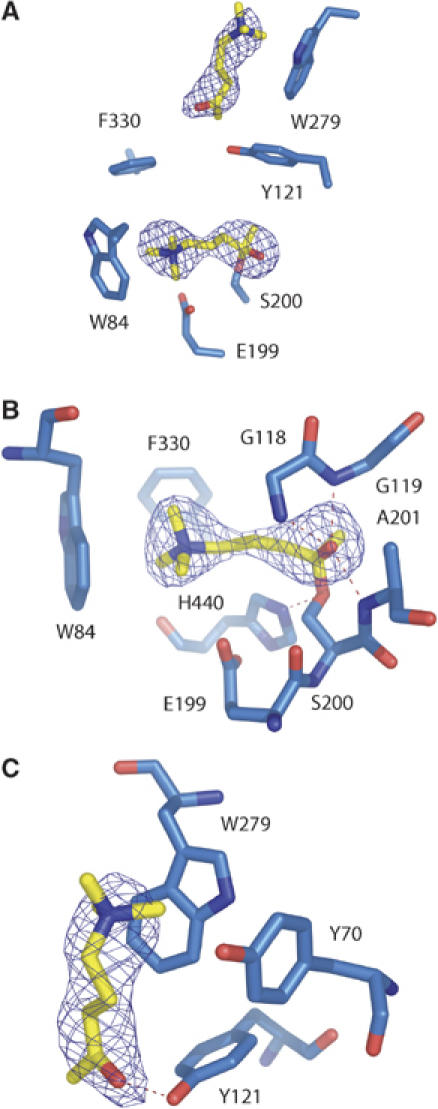
Binding of substrate analogue molecules in the OTMA/TcAChE complex. (A) Overview of the binding sites; (B) binding of OTMA in the CAS; (C) binding of OTMA at the PAS. The CAS residues (Trp84, Glu199 and Phe330), the oxyanion-hole residues (Gly118, Gly119, Ala201) and the catalytic serine (Ser200) and histidine (His440) are shown in (B). The PAS residues (Tyr70, Tyr121 and Trp279) are shown in (C). The Fo–Fc electron density map (contour level 4σ), computed without the atomic coordinates of OTMA, is superimposed on the model.
At the PAS, a second OTMA molecule is seen, with its CH3CO moiety pointing towards the active site (Figure 4C). Its quaternary group makes cation-π interactions with the aromatic rings of Trp279 and Tyr70 (distances between the closest carbon atoms of 3.1 and 3.4 Å, respectively), and its carbonyl oxygen is weakly H-bonded to Tyr121Oζ (3.3 Å).
The most prominent conformational change observed in the enzyme molecule is a movement of the aromatic rings of Phe330 and Phe331 towards the active site (Figure 5A). As a consequence, the bottleneck in the gorge becomes even narrower than in the native structure (Figure 5B), the distance between the van der Waals surfaces of Phe330 and Tyr121 decreasing from ∼5 to ∼3 Å (Figure 5). The conformational change results in a cation-π interaction between Phe330 and the TMA group, which enhances stabilization of the OTMA molecule bound at the active site.
Figure 5.
Rotation of Phe330 and active-site gorge accessibility in (A) OTMA/TcAChE; (B) native TcAChE. The water-accessible surfaces were calculated using VOIDOO (Kleywegt, 1994), employing a 1.4 Å probe radius, and taking only protein atoms into account.
Structure of the TCh/TcAChE complex (1.95 Å)
Two TCh molecules are seen in the active-site gorge (Figure 6). The catalytic serine is not acetylated but displays two alternate conformations. At the CAS, the quaternary moiety of the TCh molecule points towards the entrance of the gorge, making strong cation-π interactions with both Trp84 and Phe330 (distances between the two closest carbon atoms: 3.3 and 3.8 Å, respectively). The same rotation of the Phe330 side chain towards the active site described above for the OTMA/TcAChE complex is observed for the TCh/TcAChE complex, and again results in a strong cation-π interaction with the TMA moiety of the bound ligand. The thiol group is stabilized by a weak hydrogen bond (3.2 Å) with Glu199Oɛ1. At the PAS, the TCh molecule is stabilized principally by a cation-π interaction between its TMA moiety and Trp279 (distance between the two closest carbon atoms: 3.2 Å). The thiol group points towards the active site, but no clear interaction with any active-site gorge residue is seen. The same structural result, that is, binding of TCh molecules at both the PAS and the CAS, is obtained when crystals are soaked in 2 mM ATCh (data not shown), owing to the rapid hydrolysis of ATCh to TCh at this concentration.
Figure 6.
Binding of TCh molecules in the TCh/TcAChE complex. The Fo–Fc electron density map (contour level 4σ), computed without the atomic coordinates of the TCh molecules, is superimposed on the model. The catalytic serine (Ser200) displays two alternate conformations.
Structure of the ATCh/TcAChE complex obtained at 20 mM ATCh (2.3 Å)
In this complex, the catalytic serine is acetylated, an ATCh molecule can be assigned at the PAS, and a TCh molecule at the CAS (Figure 7A). An electron density peak in the initial Fo–Fc map, 1.4 Å from Ser200Oγ, is attributed to a covalently bound acetyl group with an occupancy of 0.7 (Figure 7B). Its carbonyl oxygen points towards the center of the active site, and is hydrogen-bonded to two out of the three constituents of the oxyanion hole (distances of 3.0 and 2.9 Å from Gly118N and Gly119N, respectively). Its methyl group is oriented towards the acyl pocket. Native TcAChE crystals obtained from the same enzyme batch did not display any electron density adjacent to Ser200 (not shown). Consequently, and as enzymatic activity within the crystal has been demonstrated (Nicolas et al, 2001), we conclude that Ser200 had been acetylated by the ATCh in the soaking solution.
Figure 7.
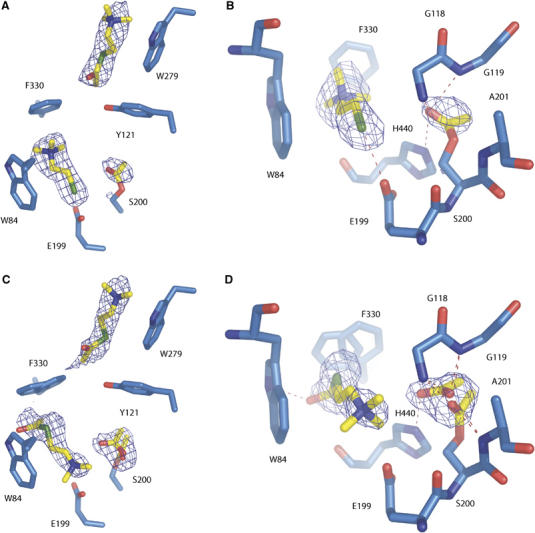
Substrate and product binding sites in substrate-inhibited TcAChE at 20 mM ATCh (A, B) and at 500 mM ATCh (C, D). (A) Overview of the binding sites; (B) acetylation of the catalytic serine and binding of TCh in the active site. The CAS residues (Trp84, Glu199 and Phe330), the oxyanion hole residues (Gly118, Gly119 and Ala201) and the catalytic serine (Ser200) and histidine (His440), are shown. The Fo–Fc electron density map (contour level 4σ), computed without the atomic coordinates of the ATCh and TCh molecules and of the acetyl group linked to Ser200, is superimposed on the model. (C) Overview of the binding sites; (D) acetylation of the catalytic serine and binding of ATCh in the active site. The CAS residues (Trp84, Glu199 and Phe330), the oxyanion hole residues (Gly118, Gly119 and Ala201) and the catalytic serine (Ser200) and histidine (His440) are shown. The Fo–Fc electron density map (contour level 4σ), computed without the atomic coordinates of the ATCh molecules and of the acetyl and acetate groups, is superimposed on the model.
The electron density peak within the CAS can be modelled as a TCh molecule (Figure 7A and B) that binds in the same position and orientation as TCh in the TCh/TcAChE complex (Figure 6). Its TMA group makes a cation-π interaction with the aromatic rings of Trp84 and Phe330 (distances between the two closest carbon atoms of 3.6 and 3.7 Å, respectively). The thiol group is 3.3 Å from Glu199Oɛ1. The same rotation of the Phe330 side chain described for the OTMA/TcAChE and TCh/TcAChE complexes is seen, again resulting in a strong cation-π interaction between its phenyl ring and the TMA moiety of the TCh molecule. Thus, in this complex, as in those described above, the gorge is in a closed configuration.
At the PAS, the observed electron density is attributed to an ATCh molecule (Figure 7A) that binds in the same orientation (acetyl group pointing down the gorge towards the active site), and at a similar position, as the substrate analogue in the OTMA/TcAChE complex (Figure 4A and C). Its carbonyl oxygen is hydrogen-bonded to Tyr121Oζ (distance 3.0 Å). The TMA moiety of ATCh makes cation-π interactions with the aromatic rings of Trp279 and Tyr70 (distances between the closest carbon atoms of 3.2 and 3.6 Å, respectively).
Structure of the ATCh/TcAChE complex obtained at 500 mM ATCh (2.15 Å)
In this structure, Ser200 is acetylated, and an intact ATCh molecule is assigned at both the active site and the PAS (Figure 7C). The positive-density peak near Ser200 in the initial Fo–Fc map could not be modelled as a single, covalently linked acetyl group as in the ATCh/TcAChE crystal structure obtained at 20 mM ATCh. Instead, two alternate conformations were modelled, one for an acetyl group covalently linked to Ser200, and one for a free acetate group (50% occupancy for each; Figure 7D). In both conformations, the methyl group points towards the acyl pocket, and the carbonyl oxygen towards the oxyanion hole (distances: 3.1 and 2.8, 3.1 and 2.5, and 2.8 and 3.2 Å from Gly118N, Gly119N and Ala201N, respectively, for the acetyl and the acetate moieties). The other oxygen of the acetate is hydrogen-bonded to His440Nɛ2 (distance: 2.8 Å).
The most prominent positive-density peak in the initial Fo–Fc map, at the bottom of the active-site gorge, between Trp84, Glu199 and Phe330, could not be modelled by a TCh molecule as in the ATCh/TcAChE complex obtained at 20 mM ATCh. The density is best modelled by an ATCh molecule (Figure 7D). Its TMA moiety points towards the bottom of the gorge, electrostatically stabilized by the Glu199 side chain (distance between Glu199Oɛ1 and the quaternary nitrogen: 3.3 Å), and is in cation-π interaction with Trp84 (distance between the two closest carbon atoms: 3.1 Å). One of the three methyl groups is 2.8 Å from Glu199Oɛ1. Such a relatively short distance is also sometimes observed in crystals of small organic molecules. Thus, a 2.5–2.9 Å distance between a carbonyl oxygen and a methyl group was detected in 82 entries (with an R factor <5%) in the Cambridge Small Molecule Data Base. The CH3CO group also makes a carbonyl–carbonyl interaction (Allen et al, 1998; Deane et al, 1999) with the main-chain carbonyl of His440. A sulphur-π interaction (Bourne et al, 1995; Harel et al, 1995) with the Phe330 side chain in one of the two alternate conformations (distance between the two closest non-hydrogen atoms: 3.7 Å) might also contribute to stabilization.
At the PAS, the density can be attributed to an ATCh molecule (Figure 7C) that binds in the same orientation (CH3CO group pointing towards the active site), and at a similar position, as the substrate analogue in the OTMA/TcAChE complex (Figure 4C) and as the ATCh molecule in the ATCh/TcAChE complex obtained at 20 mM ATCh (Figure 7A).
The side chain of Phe330 appears to adopt two alternate conformations that both result in a closed configuration of the gorge. Each of them is stabilized by a hydrophobic interaction with the methyl moiety of the CH3CO group of the ATCh molecule either at the CAS or at the PAS (distances between the two closest non-hydrogen atoms of 3.2 and 2.8 Å, respectively).
Discussion
The focus of this study was on identification of substrate and product-binding sites in TcAChE that may shed light on intramolecular substrate, product and solvent traffic during catalysis. Owing to the high turnover number of AChE (Rosenberry, 1975; Quinn, 1987), it has not been possible to obtain a crystal structure for the functional enzyme–substrate complex, viz that which forms at low substrate concentrations. We overcame this problem by adopting two approaches. One was to solve the structure of a complex with TcAChE of a nonhydrolysable substrate analogue, OTMA. The other was to solve the structure of ATCh/TcAChE complexes for which the substrate had been soaked into the crystal at such high concentrations that the enzyme was inhibited by excess of its own substrate. The latter structures provide a molecular description of substrate inhibition in AChE. The structure of a TCh/TcAChE complex revealed binding sites for the enzymatic product, choline. Taken together, these structures permit a detailed structural description of substrate traffic during TcAChE catalysis (Figure 8), which can be correlated with kinetic data for TcAChE and for other AChEs.
Figure 8.
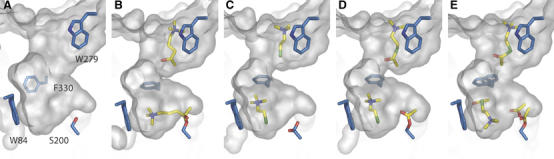
Molecular surfaces of the active-site gorge in native TcAChE (A), and in the OTMA/TcAChE (B), 20 mM TCh/TcAChE (C), 20 mM ATCh/TcAChE (D) and 500 mM ATCh/TcAChE (E) complexes. OTMA, ATCh and TCh are shown as yellow sticks, as is the acetyl group on Ser200 in (D, E).
Nonhydrolysable substrate-analogue binding and structural changes
The substrate-analogue OTMA (Thanei-Wyss and Waser, 1989) mimics the natural substrate, ACh, except that the ester oxygen is replaced by a carbon (Figure 3). Consequently, OTMA cannot be hydrolysed by AChE, and acts as a competitive inhibitor with a similar affinity as the substrate (Stojan et al, 2004). The structure of the OTMA/TcAChE complex reveals two binding sites, at the active site and at the PAS (Figure 8B). The position of OTMA in the active site is very similar to that suggested for ACh by molecular modelling (Sussman et al, 1991), and from inspection of the structure of a complex of TcAChE with the potent transition-state analogue, m-(N,N,N-trimethylammonio)-2,2,2-trifluoroacetophenone (TMTFA, Harel et al, 1996). The quaternary nitrogen atom of OTMA makes a cation-π interaction with Trp84, and the CH3CO moiety is covalently linked to Ser200Oγ. Thus, the OTMA molecule binds in the active site just as a substrate molecule would be expected to bind before catalysis. This structure represents the hemiketal equivalent of the tetrahedral intermediate that forms subsequent to productive substrate binding (Michaelis–Menten complex).
At the PAS, an OTMA molecule is seen, with its CH3CO moiety oriented towards the active site, and its quaternary nitrogen in cation-π interaction with Trp279. Its detection is in agreement with the predictions of kinetic and structural studies suggesting that the peripheral site serves as a functional substrate-binding site (Radic et al, 1991; Barak et al, 1994; Eichler et al, 1994; Bourne et al, 1995, 2003; Harel et al, 1995).
In the OTMA/TcAChE complex, the side chain of Phe330 rotates towards the active site. Consequently, the OTMA molecule in the CAS is further stabilized by cation-π interaction with the phenyl ring of Phe330. This residue, together with Tyr121, forms a bottleneck in the gorge of native TcAChE, restricting substrate access to the active site. The observed rotation further decreases access to the active site, and obviously reduces the catalytic volume (Figures 5 and 8B). The increased confinement may contribute to the high catalytic efficiency for two reasons. First, the probability of substrate hydrolysis is increased with reduction of the reaction volume; secondly, the activation barrier for the formation and decay of the tetrahedral intermediate may be decreased owing to substrate desolvation (Bohme and Mackay, 1981; Madura and Jorgensen, 1986; Harel et al, 1996). The TCh/TcAChE structure (Figure 8C), together with the 20 mM ATCh/TcAChE structure (Figure 8D), demonstrate that the closing of the gorge, mediated by Phe330 side chain rotation towards the active site, is related to the binding of a TMA moiety in the CAS, rather than to the binding of a substrate molecule at the PAS. Indeed, whatever moiety is present at the PAS, a closed conformation of the gorge is always observed when an ATCh or a TCh molecule is present at the active site. An identical rotation of Phe330 is observed in the complex structure of TcAChE with TMTFA (Harel et al, 1996). If expulsion of the choline product by the enzyme occurs along the gorge axis, it will require expenditure of energy, as Phe330 will have to rotate back to its original position for the gorge to assume its open state.
Substrate inhibition in AChE
TcAChE, like other AChEs, is inhibited by high concentrations both of its natural substrate, ACh, and of its close analogue, ATCh (Ellman et al, 1961). It was, therefore, anticipated that soaking the substrate into TcAChE crystals at a high concentration might both yield the structure of the substrate-inhibited enzyme, and allow identification of binding sites relevant to substrate traffic and inhibition. ATCh was preferred over ACh, because the higher scattering power of its sulphur atom, compared to the corresponding oxygen in ACh, facilitated identification of substrate molecules and assignment of their orientations. Moreover, this substrate displays kinetic properties virtually identical to those of ACh, and is employed in nearly all kinetic studies on AChE.
The substrate-inhibited structures obtained at the high and moderate substrate concentrations differed significantly. In the complex obtained at 20 mM ATCh, the catalytic serine (Ser200) is acetylated, a TCh molecule is seen at the CAS and an ATCh molecule at the PAS (Figure 8D). At 500 mM, Ser200 is acetylated with partial occupancy (∼50%), a free acetate group (∼50% occupancy) is found nearby and two ATCh molecules are seen, one at the active site and the other at the PAS (Figure 8E).
In order to facilitate correlation of the observed species with the kinetic data, it is useful to summarize the possible steps involved in substrate catalysis in the absence of inhibition:
The substrate enters the active site and binds to form a covalent complex with Ser200 (tetrahedral intermediate).
Collapse of tetrahedral intermediate, with choline as the leaving group. Ser200 is now acetylated and choline is still bound to the CAS.
Choline leaves the active site, and exits the enzyme via the gorge.
A water molecule attacks the carbon atom of the acyl group, and a new tetrahedral intermediate is formed.
The tetrahedral intermediate collapses, with Ser200 as the leaving group; acetate remains bound in the active site.
Acetate leaves the active site and exits the enzyme via the gorge.
The different structures seen at 20 and 500 mM ATCh are consistent with kinetic data that propose two concentration-dependent modes of substrate inhibition (Stojan et al, 2004). At moderate degrees of substrate inhibition, as steps 1 and 2 above are ongoing, a substrate molecule can bind at the PAS at the top of the gorge. This prevents step 3, choline exit, from proceeding rapidly, and causes a buildup of the species seen in the crystal structure (Figure 8D): Ser200 is acetylated, TCh is bound at the CAS, and a substrate molecule occupies the PAS. As binding of substrate at the PAS is reversible, windows of opportunity exist for TCh to escape from the gorge. Once TCh has left the CAS, water can attack the acetylated enzyme, and acetate can escape before a new substrate molecule enters the gorge. This model allows both for slow turnover and for increased occupancy of the CAS by TCh, as predicted by several kinetic models (Shafferman et al, 1992; Szegletes et al, 1998; Rosenberry et al, 1999; Johnson et al, 2003; Stojan et al, 2004). Inhibition in this case is caused by retardation of TCh clearance from both the active site and the gorge.
At high substrate concentration, TCh can still escape in the now rare eventuality that the PAS is free, and water can gain access to Ser200. In this case, however, the gorge is rapidly saturated by substrate molecules before acetate can even leave the acyl-binding pocket. Although a substrate molecule can bind at the CAS, its CH3CO group cannot enter the acyl-binding pocket because the acetate has never cleared the active site. Instead, the CH3CO group is forced to bind in a groove close to Phe330 and His440, which explains the different orientations of ATCh and TCh in the active site. The acetyl group at Ser200 remains in equilibrium between the acyl form and the free acetate molecule (see Wilson, 1951), as observed in the crystal structure (Figure 8E). Inhibition, in this case, is caused by prevention of acetate escape from the active site as a result of binding of two substrate molecules (Krupka and Laidler, 1961; Stojan et al, 2004).
The interaction with Glu199 of ATCh at 500 mM (electrostatic interaction with the TMA group; Figure 7D) provides an explanation for abolition of substrate inhibition in the TcAChE Glu199Asp (Gibney et al, 1990; Radic et al, 1992) and the corresponding HuAChE Glu202Asp mutants (Shafferman et al, 1992). Indeed, the substrate may be drawn deeper into the mutant active site, thus permitting deacetylation of Ser200 and acetate clearance to occur despite the presence of a substrate molecule. Likewise, the interactions with Phe330 of the TCh molecule in the active site at 20 mM (a cation-π interaction involving the TMA group) and of the ATCh in the active site at 500 mM (a sulphur-π interaction) rationalize the displacement of the substrate inhibition curve reported when this residue is replaced by a nonaromatic one (Shafferman et al, 1992; Barak et al, 1994; Stojan et al, 2004).
It may be asked if the substrate concentrations used in this study are close to physiologically relevant values at the synapse. A recent study estimates the ACh content of the synaptic vesicle to be ∼ 500 mM (Van der Kloot et al, 2002). It is thus plausible that passive diffusion, coupled with rapid pore opening (Stiles et al, 1996) would result in local ACh concentrations in the cleft far in excess of the concentration of ∼10 mM at which significant substrate inhibition is observed (Figure 2). A delicate balance between substrate inhibition and the high catalytic efficiency of AChE might be crucial to ensuring, in situ, that a sufficient amount of ACh reaches the postsynaptic membrane before being hydrolysed.
Structural comparison and relevance for traffic of substrates and products
All but one of the ATCh and OTMA molecules identified in this study have a common orientation; their CH3CO group points towards the active site (Figure 8). This is surprising in view of the strong electrostatic field that is aligned with the gorge axis (Ripoll et al, 1993; Felder et al, 1997), the orientation of which should favour the quaternary group of the choline moiety entering first. However, the energy gained by formation of the H-bond between Tyr121 and the CH3CO group, as well as by the hydrophobic stabilization of the aliphatic part of the substrate within the aromatic gorge, may compensate for the unfavourable orientation with respect to the electrostatic field. In any case, as the CH3CO group needs to approach the catalytic serine, the observed orientation allows the substrate to slide straight through the gorge without the necessity of reorienting before productive interaction at the active site. The strong electrostatic field may attract an ACh molecule towards the enzyme surface, whereas binding at the PAS may serve as a filter that orients the ACh molecule with its CH3CO group towards the active site.
The only ligand in this study not oriented with its CH3CO group pointing towards the active site is the ATCh molecule in the CAS at 500 mM substrate concentration (Figures 7C, D and 8E). It is of interest that this orientation is very similar to the one observed in the 3D structure of the complex of butyrylthiocholine with the ‘aged' soman conjugate of HuBChE (PDB accession code 1P0P, Nicolet et al, 2003). Phosphonylation of the catalytic serine in HuBChE and its acetylation in TcAChE both prevent productive substrate binding. Concerning the product, TCh, the same binding mode in the active site of TcAChE is observed whether it is generated enzymatically, in situ (Figures 7A, B and 8D), or soaked into the crystal (Figures 6 and 8C). In the case of HuBChE, a choline molecule binds in the active site (PDB accession code 1P0I, Nicolet et al, 2003) in the same position as TCh in TcAChE, yet rotated by 180 degrees, that is, with its OH group pointing towards the gorge entrance. This is most probably due to the absence of an aromatic residue at position 330. Indeed, Phe330 orients TCh in the active site of TcAChE by cation-π interaction with the quaternary nitrogen group. It should also be noted that substrate and product bind at the peripheral site in TcAChE, whereas no such binding is observed in HuBChE, probably due to the absence of an aromatic residue at position 279.
The synergy of the structures presented provides a series of snapshots of substrate entry into and product exit from the active site in TcAChE (Figure 8). The substrate enters the gorge with its CH3CO group pointing inwards, and binds at the PAS, being stabilized mainly by cation-π interactions with Trp279 and Tyr70, and by a hydrogen bond with Tyr121 (Figures 4C and 8B). Subsequently, it passes the Tyr121/Phe330 bottleneck. If Ser200 is free (i.e. not acetylated), the substrate can form first a Michaelis–Menten complex, and then the tetrahedral intermediate. The latter is seen in the OTMA/TcAChE complex (Figures 4B and 8B). The substrate probably maintains a cation-π interaction with Phe330 throughout its approach to Ser200, which may be responsible for the conformational change in Phe330 (Figure 5) that results in the increased confinement of the active site during the hydrolytic step of catalysis, as discussed above. After hydrolysis, the choline product is expelled, with Ser200 remaining acetylated. We have identified two TCh-binding sites within the gorge that may be on its exit trajectory, one at the CAS, and the other at the PAS (Figures 6 and 8C).
This study provides, for the first time, insight into substrate and product binding sites in an AChE molecule. Extensive structural data on AChEs from various species, including, in addition to Torpedo electric organ, mammalian (Kryger et al, 2000; Bourne et al, 2003) and invertebrate (Harel et al, 2000) sources, have shown that their overall fold and active site architecture are highly conserved. Furthermore, all AChEs examined have been shown to display substrate inhibition (Alles and Hawes, 1940; Rosenberry, 1975; Radic et al, 1991; Shafferman et al, 1992; Eichler et al, 1994; Marcel et al, 1998; Szegletes et al, 1998; Rosenberry et al, 1999; Johnson et al, 2003; Stojan et al, 2004). For these reasons, it is reasonable to suggest that the insight into substrate and product traffic presented here can be generalized to AChEs from other species.
Materials and methods
Materials
ATCh was purchased from Sigma (St Louis, MO) and TCh was obtained by its hydrolysis at pH 12. The nonhydrolysable substrate analogue, 4-oxo-N,N,N-trimethylpentanaminium (OTMA) iodide, was synthesized according to Thanei-Wyss and Waser (1989). The inhibition constants of choline and OTMA for TcAChE were determined to be 950 and 68 μM, respectively (data not shown). The pS curves corresponding to TcAChE hydrolysis of ATCh in the presence of choline or OTMA were fitted according to the model described by Stojan et al (2004); hence, the inhibition constants correspond to the affinity constants for the PAS.
Kinetics of ATCh hydrolysis
Hydrolysis of ATCh iodide was measured spectrophotometrically at 412 nm by the Ellman method (Ellman et al, 1961), at 25°C, in 25 mM phosphate buffer, pH 7. Substrate concentrations were 4 μM–200 mM, with a minimum of 10 repetitions per concentration value. Activity was followed for 1 min after addition of the enzyme to the mixture, and spontaneous hydrolysis of substrate was subtracted. The data were analysed by multiple nonlinear regressions, using the model and equation of Stojan et al (2004), and the program GOSA (www.bio-log.biz).
Crystallization of TcAChE and soaking procedure
TcAChE was purified as described (Sussman et al, 1988, Raves, 1998). Trigonal crystals (space group P3121) of native TcAChE were obtained at 4°C by the hanging-drop vapour diffusion method, employing polyethyleneglycol 200 (PEG200) as precipitant. The mother liquor was 32% PEG200/0.15 M morpholinoethylsulphonic acid (MES), pH 5.8–6.2, and a protein concentration of 11.5 mg/ml was used. TcAChE crystals were soaked at 4°C in mother liquor at pH 6.0, containing either 0.5 mM OTMA (24 h in 5 μl soaking solution), 20 mM TCh (12 h in 5 μl soaking solution), 500 mM ATCh (40 min in 1.5 ml soaking solution) or 20 mM ATCh (12 h in 200 μl soaking solution). When 20 mM ATCh was employed, crystals were transferred every hour into a fresh 20 mM ATCh solution, the last transfer being 10 min prior to flash-cooling of the crystal.
Data collection
Owing to the cryoprotective capacity of PEG200, all crystals were directly mounted in a cryo-loop and flash-cooled in a nitrogen stream at 100 K. X-ray diffraction data were collected at the European Synchrotron Radiation Facility (ESRF) on beamlines BM30A (CRG FIP), ID14-EH2 or ID29. Data sets were indexed, merged and scaled using XDS/XSCALE, and amplitude factors generated using XDSCONV (Kabsch, 1993). For details, see Table I.
Table 1.
Data collection and refinement statistics
| TcAChE in complex with OTMA | TcAChE in complex with TCh | TcAChE in complex with ATCh at 20 mM | TcAChE in complex with ATCh at 500 mM | |
|---|---|---|---|---|
| PDB accession code | 2C5F | 2C5G | 2C58 | 2C4H |
| ESRF beamline | BM30A | ID14-EH2 | ID14-EH2 | ID29 |
| Temperature (K) | 100 | 100 | 100 | 100 |
| Oscillation step (deg) | 1 | 1 | 1 | 1 |
| Number of frames | 120 | 120 | 120 | 120 |
| Exposure time (s/frame) | 30 (unatt. beam) | 2 (unatt. beam) | 3 (unatt. beam) | 2 (20 × attenuation) |
| Wavelength (Å) | 0.980 | 0.933 | 0.933 | 0.976 |
| Unit cell parameters (Å) | ||||
| a=b | 112.26 | 112.52 | 113.35 | 111.99 |
| c | 137.00 | 137.37 | 138.03 | 137.12 |
| Resolution range (Å) | 20.00–2.60 (2.70–2.60)a | 20.00–1.95 (2.00–1.95) | 20.00–2.30 (2.35–2.30) | 20.00–2.15 (2.20–2.15) |
| Completeness (%) | 97.8 (97.0) | 99.0 (95.6) | 100.0 (99.7) | 99.6 (98.9) |
| Rmerge (%)b | 8.1 (29.4) | 6.4 (49.2) | 5.3 (46.9) | 5.8 (43.9) |
| I/σI | 16.12 (5.92) | 19.74 (5.30) | 22.63 (4.43) | 22.14 (4.24) |
| Unique reflections | 30 545 | 72 944 | 45 972 | 54 312 |
| Redundancy | 5.99 | 7.39 | 7.14 | 7.34 |
| Observations/parameters ratio | 1.45 | 3.14 | 2.15 | 2.45 |
| Rcryst. (%) | 16.26 | 16.03 | 17.14 | 16.70 |
| Rfree (%) | 21.95 | 18.60 | 21.01 | 20.90 |
| R.m.s.d. bond length (Å) | 0.007 | 0.006 | 0.006 | 0.006 |
| R.m.s.d. bond angles (deg) | 1.335 | 1.395 | 1.335 | 1.344 |
| R.m.s.d with respect to native structure (Å) (PDB accession code 1EA5) | 0.1840 | 0.1339 | 0.2123 | 0.2388 |
| Number of atoms | 5249 | 6003 | 5341 | 5543 |
| Protein | 4342 | 4526 | 4424 | 4501 |
| Carbohydrate | 28 | 28 | 28 | 28 |
| Water | 829 | 1408 | 822 | 949 |
| Ligands and ions | 50 | 41 | 67 | 65 |
| Wilson B factor (Å2) | 42.6 | 20.7 | 38.2 | 27.9 |
| Average B factor (Å2) | 49.3 | 38.5 | 53.0 | 41.2 |
| Protein | 46.1 | 28.5 | 48.9 | 36.3 |
| Carbohydrate | 77.0 | 52.5 | 74.5 | 64.0 |
| Water | 63.5 | 61.1 | 72.0 | 62.4 |
| Ligands and ions | 78.3 | 64.7 | 82.8 | 62.4 |
| ATCh, acetylthiocholine; ESRF, European Synchrotron Radiation Facility; OTMA, 4-oxo-N,N,N-trimethylpentanaminium iodide. | ||||
| aValues in brackets are for the highest resolution shells. | ||||
| bRmerge=∑hkl∑i∣Ii(hkl)−〈I(HKL)〉/∑hkl∑iIi(hkl). | ||||
Structure determination and refinement
The native structure of TcAChE (PDB entry code 1EA5), without water and sugar molecules, was used as the starting model for rigid body refinement of all four data sets in the resolution range of 20–4 Å. Subsequently, all data sets underwent simulated annealing to 7500 K, with cooling steps of 10 K, followed by 250 steps of conjugate-gradient minimization. Diffraction data from 20 Å to the highest resolution limits were used for refinement, and maps were calculated using all data between 15 Å and the highest resolution limits. Graphic operations, modelling and model building were performed either with TURBO-FRODO (Roussel and Cambillau, 1989) or COOT (Emsley and Cowtan, 2004). Energy minimization and individual B-factor refinement followed each stage of manual rebuilding. Refinement and map calculation were performed using either CNS version 1.1 (Brünger et al, 1998) or the REFMAC (Murshudov et al, 1997) and FFT modules of the CCP4 suite (CCP4, 1994). In order to compute the Fo–Fc omit maps (Figures 4, 6 and 7), 10 cycles of energy minimization and individual B-factor refinement were performed after omitting the ligands from the model. Structure refinement was evaluated using PROCHECK (Laskowski et al, 1993). All structures displayed better values than projected for their resolution limit with respect to all PROCHECK criteria. Figures 4, 5, 6, 7 and 8 were produced using PyMOL (DeLano, 2002). Solvent-accessible surfaces in Figure 5 were calculated using VOIDOO (Kleywegt, 1994). Parameters and topologies of TCh, ATCh, OTMA and PEG200 were generated using the PRODRG server of Dundee University (Schuettelkopf and van Aalten, 2004). Refinement statistics are shown in Table I.
In the OTMA/TcAChE complex, two OTMA molecules could be fitted to the experimental electron density, as evidenced by peaks above 5σ at both the active site and the PAS in the initial Fo–Fc map. That at the active site had its quaternary group adjacent to Trp84 and its methylcarbonyl moiety positioned near Ser200. An attempt was made to covalently link the OTMA molecule to the catalytic serine (distance of 1.4 Å), as would be the case if a hemiketal had formed (i.e. the tetrahedral intermediate that would form upon binding of OTMA to the catalytic serine) (Harel et al, 1996). Subsequent refinement resulted in appearance of a very small negative density peak in the Fo–Fc map between OTMA and Ser200Oγ. If, instead, a nonbonded interaction was modelled in which the carbonyl carbon of OTMA was moved 2.6 Å away from the Ser200Oγ, a strong positive peak was observed between the two atoms. Hence, the substrate analogue was modelled as covalently linked to the catalytic serine. Even though a symmetry-related TcAChE molecule covers the gorge entrance in the trigonal crystal form, electron density was observed at the PAS, into which another OTMA molecule was modelled. Its quaternary group is adjacent to Trp279, with the 4-oxo-pentyl chain pointing down the gorge.
In order to localize ATCh and TCh in their respective complexes, the level of the initial Fo–Fc map was raised above 5σ to identify and position the strongly diffracting sulphur atom. Only in the case of the TCh molecule in the CAS of the TCh/TcAChE complex was the electron density of the TMA moiety at a higher sigma level than that of the sulphur atom. No clear peaks were visible in an anomalous difference map that could have reinforced the identification of the sulphur atoms. To unequivocally assign substrate and/or product molecules in the substrate/enzyme complexes, a TCh molecule was first fitted into the difference density displayed at 3σ, and then added to the model. The TCh molecule was retained if no major residual peaks were detected in the difference map after a round of refinement. In the 500 mM ATCh/TcAChE complex, however, the initial Fo–Fc positive density in the active site was not straightforwardly interpretable, given its shape and extent. When a TCh molecule was fitted into the density and included in the model, a very strong positive peak appeared in the subsequent Fo–Fc map, indicating that a molecule larger than TCh is present at that site. When the electron density was displayed at 6σ, only two peaks of density remained. An ATCh molecule was modelled to span them, with its sulphur atom fitted into the strongest and most elongated peak, just below Phe330, and the tetramethylammonium (TMA) moiety into the other one, near Glu199. Models with two molecules in alternate conformations (either two ATCh or two TCh molecules) did not explain the observed electron density convincingly.
Structural data
The coordinates and structure factor amplitudes of the complex structures of TcAChE with the substrate analogue OTMA, the product thiocholine, and the substrate acetylthiocholine at 20 and 500 mM, have been deposited in the Protein Data Bank under accession codes 2c5f, 2c5 g, 2c58 and 2c4 h, respectively.
Supplementary Material
Supplementary data
Acknowledgments
We thank Patricia Amara, Yacov Ashani, Dominique Bourgeois, Otto Dideberg, Adriana Irimia and Antoine Royant for extensive and productive discussions. We are grateful to Joanne McCarthy, Xavier Vernède, and the staff at the ESRF and the French CRG beam-line FIP for help related to data collection. We thank Fred Vellieux for valuable discussions and critical reading of the manuscript. We are grateful to Lilly Toker for purification of TcAChE, to Maurice Goeldner and Alexandre Specht for a long-term collaboration and to Juan Fontecilla-Camps for regular access to the X-ray source in his laboratory. MW thanks the MINERVA foundation for a short-term research grant. JPC is supported by a CEA PhD grant. This study benefited from the US Army Medical and Materiel Command under Contract No. DAMD17-97-2-7022, the EC Vth Framework Contracts QLK3-2000-00650 and QLG2-CT-2002-00988 (SPINE), the Kimmelman Center for Biomolecular Structure and Assembly (Rehovot, Israel), the Benoziyo Center for Neurosciences and the Kalman and Ida Wolens Foundation. JLS is the Pickman Professor of Structural Biology.
References
- Allen FH, Baalham CA, Lommerse JPM, Raithby PR (1998) Carbonyl–carbonyl interactions can be competitive with hydrogen bonds. Acta Crystallogr B 54: 320–329 [Google Scholar]
- Alles GA, Hawes RC (1940) Cholinesterases in the blood of man. J Biol Chem 133: 375–390 [Google Scholar]
- Barak D, Kronman C, Ordentlich A, Ariel N, Bromberg A, Marcus D, Lazar A, Velan B, Shafferman A (1994) Acetylcholinesterase peripheral anionic site degeneracy conferred by amino acid arrays sharing a common core. J Biol Chem 269: 6296–6305 [PubMed] [Google Scholar]
- Belleau B, DiTullio V, Tsai YH (1970) Kinetic effects of leptocurares and pachycurares on the methanesulfonylation of acetylcholinesterase. A correlation with pharmacodynamic properties. Mol Pharmacol 6: 41–45 [PubMed] [Google Scholar]
- Bergmann F, Wilson IB, Nachmansohn D (1950) The inhibitory effect of stilbamidine, curare and related compounds and its relationship to the active groups of acetylcholine esterase; action of stilbamidine upon nerve impulse conduction. Biochim Biophys Acta 6: 217–224 [DOI] [PubMed] [Google Scholar]
- Bohme DK, Mackay GI (1981) Bridging the gap between the gas phase and solution: transition in the kinetics of nucleophilic displacement reactions. J Am Chem Soc 103: 978–979 [Google Scholar]
- Bourne Y, Taylor P, Marchot P (1995) Acetylcholinesterase inhibition by fasciculin: crystal structure of the complex. Cell 83: 503–512 [DOI] [PubMed] [Google Scholar]
- Bourne Y, Taylor P, Radic Z, Marchot P (2003) Structural insights into ligand interactions at the acetylcholinesterase peripheral anionic site. EMBO J 22: 1–12 [DOI] [PMC free article] [PubMed] [Google Scholar]
- Brochier L, Pontie Y, Willson M, Estrada-Mondaca S, Czaplicki J, Klaebe A, Fournier D (2001) Involvement of deacylation in activation of substrate hydrolysis by Drosophila acetylcholinesterase. J Biol Chem 276: 18296–18302 [DOI] [PubMed] [Google Scholar]
- Brünger AT, Adams PD, Clore GM, DeLano WL, Gros P, Grosse-Kunstleve RW, Jiang JS, Kuszewski J, Nilges M, Pannu NS, Read RJ, Rice LM, Simonson T, Warren GL (1998) Crystallography & NMR system: a new software suite for macromolecular structure determination. Acta Crystallogr D 54: 905–921 [DOI] [PubMed] [Google Scholar]
- Changeux JP (1966) Responses of acetylcholinesterase from Torpedo marmorata to salts and curarizing drugs. Mol Pharmacol 2: 369–392 [PubMed] [Google Scholar]
- Collaborative Computational Project, Number 4 (1994) The CCP4 Suite: programs for protein crystallography. Acta Crystallogr D 50: 760–763 [DOI] [PubMed] [Google Scholar]
- Deane CM, Allen FH, Taylor R, Blundell TL (1999) Carbonyl–carbonyl interactions stabilize the partially allowed Ramachandran conformations of asparagines and aspartic acid. Protein Eng 12: 1025–1028 [DOI] [PubMed] [Google Scholar]
- DeLano WL (2002) The PyMOL Molecular Graphics System. San Carlos, CA, USA: DeLano Scientific [Google Scholar]
- Eastman J, Wilson EJ, Cervenansky C, Rosenberry TL (1995) Fasciculin 2 binds to the peripheral site on acetylcholinesterase and inhibits substrate hydrolysis by slowing a step involving proton transfer during enzyme acylation. J Biol Chem 270: 19694–19701 [DOI] [PubMed] [Google Scholar]
- Eichler J, Anselmet A, Sussman JL, Massoulie J, Silman I (1994) Differential effects of ‘peripheral' site ligands on Torpedo and chicken acetylcholinesterase. Mol Pharmacol 45: 335–340 [PubMed] [Google Scholar]
- Ellman GL, Courtney D, Andres V, Featherstone RM (1961) A new and rapid colorimetric determination of acetylcholinesterase activity. Biochem Pharmacol 7: 88–95 [DOI] [PubMed] [Google Scholar]
- Emsley P, Cowtan K (2004) Coot: Model-building tools for molecular graphics. Acta Crystallogr D 60: 2126–2132 [DOI] [PubMed] [Google Scholar]
- Eriksson H, Augustinsson KB (1979) A mechanistic model for butyrylcholinesterase. Biochim Biophys Acta 567: 161–173 [DOI] [PubMed] [Google Scholar]
- Felder CE, Botti SA, Lifson S, Silman I, Sussman JL (1997) External and internal electrostatic potentials of cholinesterase models. J Mol Graph Model 15: 318–327 [DOI] [PubMed] [Google Scholar]
- Felder CE, Harel M, Silman I, Sussman JL (2002) Structure of a complex of the potent and specific inhibitor BW284C51 with Torpedo californica acetylcholinesterase. Acta Crystallogr D 58: 1765–1771 [DOI] [PubMed] [Google Scholar]
- Gibney G, Camp S, Dionne M, MacPhee-Quigley K, Taylor P (1990) Mutagenesis of essential functional residues in acetylcholinesterase. Proc Natl Acad Sci USA 87: 7546–7550 [DOI] [PMC free article] [PubMed] [Google Scholar]
- Greenblatt HM, Dvir H, Silman I, Sussman JL (2003) Acetylcholinesterase: a multifaceted target for structure-based drug design of anticholinesterase agents for the treatment of Alzheimer's disease. J Mol Neurosci 20: 369–383 [DOI] [PubMed] [Google Scholar]
- Harel M, Kleywegt GJ, Ravelli RB, Silman I, Sussman JL (1995) Crystal structure of an acetylcholinesterase–fasciculin complex: interaction of a three-fingered toxin from snake venom with its target. Structure 3: 1355–1366 [DOI] [PubMed] [Google Scholar]
- Harel M, Kryger G, Rosenberry TL, Mallender WD, Lewis T, Fletcher RJ, Guss JM, Silman I, Sussman JL (2000) Three-dimensional structures of Drosophila melanogaster acetylcholinesterase and of its complexes with two potent inhibitors. Protein Sci 9: 1063–1072 [DOI] [PMC free article] [PubMed] [Google Scholar]
- Harel M, Quinn DM, Nair HK, Silman I, Sussman JL (1996) The X-ray structure of a transition state analog complex reveals the molecular origins of the catalytic power and substrate specificity of acetylcholinesterase. J Am Chem Soc 118: 2340–2346 [Google Scholar]
- Harel M, Schalk I, Ehret-Sabatier L, Bouet F, Goeldner M, Hirth C, Axelsen PH, Silman I, Sussman JL (1993) Quaternary ligand binding to aromatic residues in the active-site gorge of acetylcholinesterase. Proc Natl Acad Sci USA 90: 9031–9035 [DOI] [PMC free article] [PubMed] [Google Scholar]
- Johnson JL, Cusack B, Davies MP, Fauq A, Rosenberry TL (2003) Unmasking tandem site interaction in human acetylcholinesterase. Substrate activation with a cationic acetanilide substrate. Biochemistry 42: 5438–5452 [DOI] [PubMed] [Google Scholar]
- Kabsch W (1993) Automatic processing of rotation diffraction data from crystals of initially unknown symmetry and cell constants. J Appl Cryst 26: 795–800 [Google Scholar]
- Kleywegt GJ (1994) Detection, delineation, measurement and display of cavities in macromolecular structures. Acta Crystallogr D 50: 178–185 [DOI] [PubMed] [Google Scholar]
- Krupka RM, Laidler KJ (1961) Molecular mechanisms for hydrolytic enzyme action. Apparent non-competitive inhibition with special reference to acetylcholinesterase. J Am Chem Soc 83: 1448–1454 [Google Scholar]
- Kryger G, Harel M, Giles K, Toker L, Velan B, Lazar A, Kronman C, Barak D, Ariel N, Shafferman A, Silman I, Sussman JL (2000) Structures of recombinant native and E202Q mutant human acetylcholinesterase complexed with the snake-venom toxin fasciculin-II. Acta Crystallogr D 56: 1385–1394 [DOI] [PubMed] [Google Scholar]
- Laskowski RA, McArthur MW, Moss DS, Thornton JM (1993) PROCHECK: a program to check the stereochemical quality of protein structures. J Appl Cryst 26: 283–291 [Google Scholar]
- Madura JD, Jorgensen WL (1986) Ab initio and Monte Carlo calculations for a nucleophilic addition reaction in the gas phase and in aqueous solution. J Am Chem Soc 108: 2517–2527 [Google Scholar]
- Marcel V, Palacios LG, Pertuy C, Masson P, Fournier D (1998) Two invertebrate acetylcholinesterases show activation followed by inhibition with substrate concentration. Biochem J 329: 329–334 [DOI] [PMC free article] [PubMed] [Google Scholar]
- Marty JL, Sode K, Karube I (1992) Biosensor for detection of organophosphate and carbamate insecticides. Electroanalysis 4: 249–252 [Google Scholar]
- Masson P, Froment MT, Bartels CF, Lockridge O (1996) Asp70 in the peripheral anionic site of human butyrylcholinesterase. Eur J Biochem 235: 36–48 [DOI] [PubMed] [Google Scholar]
- Millard CB, Kryger G, Ordentlich A, Greenblatt HM, Harel M, Raves ML, Segall Y, Barak D, Shafferman A, Silman I, Sussman JL (1999) Crystal structures of aged phosphonylated acetylcholinesterase: nerve agent reaction products at the atomic level. Biochemistry 38: 7032–7039 [DOI] [PubMed] [Google Scholar]
- Murshudov GN, Vagin AA, Dodson EJ (1997) Refinement of macromolecular structures by the maximum likelihood method. Acta Crystallogr D 53: 240–255 [DOI] [PubMed] [Google Scholar]
- Nicolas A, Ferron F, Toker L, Sussman JL, Silman I (2001) Histochemical method for characterization of enzyme crystals: application to crystals of Torpedo californica acetylcholinesterase. Acta Crystallogr D 57: 1348–1350 [DOI] [PubMed] [Google Scholar]
- Nicolet Y, Lockridge O, Masson P, Fontecilla-Camps JC, Nachon F (2003) Crystal structure of human butyrylcholinesterase and of its complexes with substrate and products. J Biol Chem 278: 41141–41147 [DOI] [PubMed] [Google Scholar]
- Quinn DM (1987) Acetylcholinesterase: enzyme structure, reaction dynamics, and virtual transition-states. Chem Rev 87: 955–979 [Google Scholar]
- Radic Z, Duran R, Vellom DC, Li Y, Cervenansky C, Taylor P (1994) Site of fasciculin interaction with acetylcholinesterase. J Biol Chem 269: 11233–11239 [PubMed] [Google Scholar]
- Radic Z, Gibney G, Kawamoto S, MacPhee-Quigley K, Bongiorno C, Taylor P (1992) Expression of recombinant acetylcholinesterase in a baculovirus system: kinetic properties of glutamate 199 mutants. Biochemistry 31: 9760–9767 [DOI] [PubMed] [Google Scholar]
- Radic Z, Kirchhoff PD, Quinn DM, McCammon JA, Taylor P (1997) Electrostatic influence on the kinetics of ligand binding to acetylcholinesterase. Distinctions between active center ligands and fasciculin. J Biol Chem 272: 23265–23277 [DOI] [PubMed] [Google Scholar]
- Radic Z, Reiner E, Taylor P (1991) Role of the peripheral anionic site on acetylcholinesterase: inhibition by substrates and coumarin derivatives. Mol Pharmacol 39: 98–104 [PubMed] [Google Scholar]
- Raves ML (1998) Structure–function studies on acetylcholinesterase in space and time. PhD Thesis, Weizmann Institute of Science, Rehovot, Israel
- Ripoll DR, Faerman CH, Axelsen PH, Silman I, Sussman JL (1993) An electrostatic mechanism for substrate guidance down the aromatic gorge of acetylcholinesterase. Proc Natl Acad Sci USA 90: 5128–5132 [DOI] [PMC free article] [PubMed] [Google Scholar]
- Rosenberry TL (1975) Acetylcholinesterase. Adv Enzymol Relat Areas Mol Biol 43: 103–218 [DOI] [PubMed] [Google Scholar]
- Rosenberry TL, Mallender WD, Thomas PJ, Szegletes T (1999) A steric blockade model for inhibition of acetylcholinesterase by peripheral site ligands and substrate. Chem Biol Interact 119–120: 85–97 [DOI] [PubMed] [Google Scholar]
- Roufogalis BD, Quist EE (1972) Relative binding sites of pharmacologically active ligands on bovine erythrocyte acetylcholinesterase. Mol Pharmacol 8: 41–49 [PubMed] [Google Scholar]
- Roussel A, Cambillau C (1989) TURBO-FRODO. Silicon Graphics Geometry Partners Directory. Mountain View, CA: Silicon Graphics [Google Scholar]
- Schuettelkopf W, van Aalten DMF (2004) PRODRG – a tool for high-throughput crystallography of protein–ligand complexes. Acta Crystallogr D 60: 1355–1363 [DOI] [PubMed] [Google Scholar]
- Shafferman A, Velan B, Ordentlich A, Kronman C, Grosfeld H, Leitner M, Flashner Y, Cohen S, Barak D, Ariel N (1992) Substrate inhibition of acetylcholinesterase: residues affecting signal transduction from the surface to the catalytic center. EMBO J 11: 3561–3568 [DOI] [PMC free article] [PubMed] [Google Scholar]
- Silman I, Sussman JL (2005) Acetylcholinesterase: ‘classical' and ‘non-classical' functions and pharmacology. Curr Opin Pharmacol 5: 293–302 [DOI] [PubMed] [Google Scholar]
- Smissaert HR (1964) Cholinesterase inhibition in spider mites susceptible and resistant to organophosphate. Science 143: 129–131 [DOI] [PubMed] [Google Scholar]
- Stiles JR, Van Helden D, Bartol TM Jr, Salpeter EE, Salpeter MM (1996) Miniature endplate current rise times less than 100 microseconds from improved dual recordings can be modeled with passive acetylcholine diffusion from a synaptic vesicle. Proc Natl Acad Sci USA 93: 5747–5752 [DOI] [PMC free article] [PubMed] [Google Scholar]
- Stojan J, Brochier L, Alies C, Colletier JP, Fournier D (2004) Inhibition of Drosophila melanogaster acetylcholinesterase by high concentrations of substrate. Eur J Biochem 271: 1364–1371 [DOI] [PubMed] [Google Scholar]
- Sussman JL, Harel M, Frolow F, Oefner C, Goldman A, Toker L, Silman I (1991) Atomic structure of acetylcholinesterase from Torpedo californica: a prototypic acetylcholine-binding protein. Science 253: 872–879 [DOI] [PubMed] [Google Scholar]
- Sussman JL, Harel M, Frolow F, Varon L, Toker L, Futerman AH, Silman I (1988) Purification and crystallization of a dimeric form of acetylcholinesterase from Torpedo californica subsequent to solubilization with phosphatidylinositol-specific phospholipase C. J Mol Biol 203: 821–823 [DOI] [PubMed] [Google Scholar]
- Szegletes T, Mallender WD, Rosenberry TL (1998) Nonequilibrium analysis alters the mechanistic interpretation of inhibition of acetylcholinesterase by peripheral site ligands. Biochemistry 37: 4206–4216 [DOI] [PubMed] [Google Scholar]
- Taylor P, Lappi S (1975) Interaction of fluorescence probes with acetylcholinesterase. The site and specificity of propidium binding. Biochemistry 14: 1989–1997 [DOI] [PubMed] [Google Scholar]
- Thanei-Wyss P, Waser PG (1989) Interaction of quaternary ammonium compounds with acetylcholinesterase: characterization of the active site. Eur J Pharmacol 172: 165–173 [DOI] [PubMed] [Google Scholar]
- Van der Kloot W, Molgo J, Cameron R, Colasante C (2002) Vesicle size and transmitter release at the frog neuromuscular junction when quantal acetylcholine content is increased or decreased. J Physiol 541: 385–393 [DOI] [PMC free article] [PubMed] [Google Scholar]
- Wilson IB (1951) Mechanism of hydrolysis. II. New evidence for an acylated enzyme as intermediate. Biochim Biophys Acta 7: 520–525 [DOI] [PubMed] [Google Scholar]
Associated Data
This section collects any data citations, data availability statements, or supplementary materials included in this article.
Supplementary Materials
Supplementary data