

Abstract
OBJECTIVE
Although cost-effectiveness analyses (CEAs) have been advocated as a tool to critically appraise the value of health expenditures, it has been widely hoped that they might also help contain health care costs. To determine how often they discourage additional expenditures, we reviewed the conclusions of recently published CEAs.
DATA SOURCES
A search of the Abridged Index Medicus (a subset of MEDLINE designed to afford rapid access to the literature of “immediate interest” to the practicing physician) between 1990 and 1996.
STUDY SELECTION
We only included articles that reported an explicit cost-effectiveness (CE) ratio (a cost for some given health effect) in the abstract.
DATA ABSTRACTION
From each abstract, we collected the value for the incremental CE ratio and the measure of health effect (life-years, quality-adjusted life-years [QALYs], other). We then categorized the authors' conclusion into one of three categories: supports strategy requiring additional expenditure, no firm conclusion, and supports low-cost alternative. Finally, we obtained the article and collected information on funding source.
DATA SYNTHESIS
Among the 109 eligible articles, the authors' conclusion supported strategies requiring additional expenditure in 58 (53%) and supported the low-cost alternative in 28 (26%). We then focused on the 65 articles reporting either life-years or QALYs. Cost-effectiveness ratios ranged from $400 to $166,000 (per life-year or QALY) in the 39 articles (60%) in which authors supported additional expenditure, and ranged from $61,500 to $11,600,000 in the 13 articles (20%) in which authors supported the low-cost alternative. Despite identifying similar CE ratios, authors arrived at different conclusions in the overlapping range ($61,500 to $166,000). Of the 10 articles acknowledging industry funding, 9 supported a strategy requiring additional expenditure (p = .01 as compared with those without such funding).
CONCLUSIONS
Authors of CEAs are more likely to support strategies requiring additional expenditure than the low-cost alternative. There is no obvious consensus about how small the CE ratio should be to warrant additional expenditure. Finally, concerns about funding source seem to be warranted.
Keywords: cost-effectiveness analyses, health cost containment, life-years, quality-adjusted life-years
Many view the establishment of priorities among various health services as an important step toward a solution to the problem of rising health care costs. Cost-effectiveness analysis (CEA) has been proposed as an important tool in this effort.1,3 Developed in the military,4 CEA was first applied to health care in the mid 1960s,5 and was introduced in the clinical literature in 1977.6 In the ensuing years, concerns about rising health care costs have led to over a threefold rise in the number of articles indexed annually under “cost-effectiveness.” Most of the analyses have addressed the value of newly contemplated expenditures, such as new pharmaceuticals, new technologies, or the expansion of existing practices to new patients. Many hoped that a critical appraisal of the value of such additional expenditures would serve as an important hurdle to slow their growth and, in turn, help contain health care costs. This hope has not been realized; health care costs continue to rise.
Although CEA practitioners would be quick to point out that the hope to contain expenditures was not a reasonable expectation, they have nonetheless expressed concerns about the current application of the CEA technique.2, 3, 7,12 With the exception of some fears that industry support may bias analyses,13, 14 most of these concerns focus on the method itself. The U.S. Public Health Service recently convened a panel on CEA to address problems that limit its policy relevance.15–18 The panel concluded that individual analyses must be comparable in order to assist in prioritizing health services and that many barriers to comparability exist (e.g., inclusion of different costs, lack of a common effectiveness measure). Although such concerns about the method may be very relevant to CEA practitioners, there are other contexts in which to evaluate the current application of CEA. In this article, we consider an obvious one: the author's conclusion.
Recognizing that the long-term goal of a comprehensive CEA-based prioritization of health services is yet unmet, we focus on an intermediate effect: specifically, the CEA-based recommendations appearing in the clinical literature. Our primary goal was to categorize the author's conclusion of recently published CEAs to determine what proportion support strategies requiring additional expenditure (as opposed to the low-cost alternative). We also examine the association between the author's conclusion and two characteristics: the reported cost-effectiveness (CE) ratio and the source of funding.
METHODS
Background
Cost-effectiveness analysis is a technique to compare strategies intended to produce the same effect. In its most common form, a new strategy is compared with current practice (which may include doing nothing). The new strategy is associated with enhanced effects and higher costs—otherwise no “analysis” would be needed. It is compared against current practice (the “low-cost alternative”) in the calculation of the incremental CE ratio:
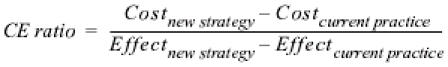 |
The result might be considered as the “price” of the additional outcome purchased by switching from current practice to the new strategy (e.g., $10,000 per life-year). If the price is low enough, the new strategy is dubbed “cost-effective,” meaning that the new strategy is a good value (not that it is cost saving). In this article, we examine how often authors make this conclusion.
Search Strategy
To identify articles that had high visibility to clinicians, we restricted our search to journals listed in the Abridged Index Medicus, a subset of MEDLINE designed to afford rapid access to the biomedical literature of “immediate interest” to the practicing physician. We extracted those articles appearing under either the MeSH heading “cost-effectiveness” (which maps to “cost-benefit analysis”) or the text words “cost-effectiveness analysis.” The time frame encompassed articles published on or after January 1, 1990, that appeared in the database prior to study closure on June 30, 1996. We confined the analysis to articles in which the abstract contained an explicit CE ratio: a cost (specifying a dollar amount or some other currency) for some given health effect (life-years, quality-adjusted life-years [QALYs], cases averted, etc.). Our final sample consisted of 109 eligible articles.
Data Abstraction
Classification of the Authors' Conclusion.
The abstract of each eligible article was reviewed by both authors. Our primary goal was to categorize the major thrust of the study authors' conclusion. In general, abstracts had a single conclusion that was the authors' summarization of the findings with regard to the primary objective of the article. If there was any ambiguity among the sentences of the conclusion, we made the categorization based on the first. As detailed in Table 1, the authors' conclusion was classified into one of three categories:
Table 1.
Classification Scheme for Authors' Conclusion
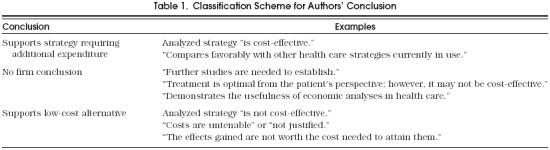
Supports strategy requiring additional expenditure. Any conclusion unambiguously favorable to an analyzed strategy that involved additional expense over existing practice warranted this classification. In general, this involved an assertion that the strategy was “cost-effective.” In addition, we specifically noted those conclusions that incorporated justifications to the effect that the strategy “compares favorably with other current practices.”
No firm conclusion. Ambiguous conclusions were classified in this category. These were generally either mixed messages within a single sentence (“substantial benefit but may not be affordable”) or incredibly generic (“demonstrates the value of economic analysis” or “further studies are needed”).
Supports low-cost alternative. Any conclusion unambiguously unfavorable to the analyzed strategy warranted this classification. In general, this involved an assertion that the strategy was “not cost-effective” or that “the costs are not justified.”
Abstraction of Cost-Effectiveness Ratio.
Our second goal was to make some inference about the “critical” CE ratio—the threshold (or cutoff) value below which a strategy is judged to be “cost-effective.” To explore this issue, we focused on those articles that reported CE ratios with comparable denominators (i.e., either life-years or QALYs) and examined the relation between the authors' conclusion and the magnitude of the CE ratio (see Fig. 1). For these 65 articles, we collected the CE ratio reported in the abstract and converted all currencies to U.S. dollars. In 50, we were able to obtain a point estimate of the CE ratio. For the remaining 15, which reported the CE ratio as a range only, we used the midpoint of the range as the point estimate. We ignored data from sensitivity analyses.
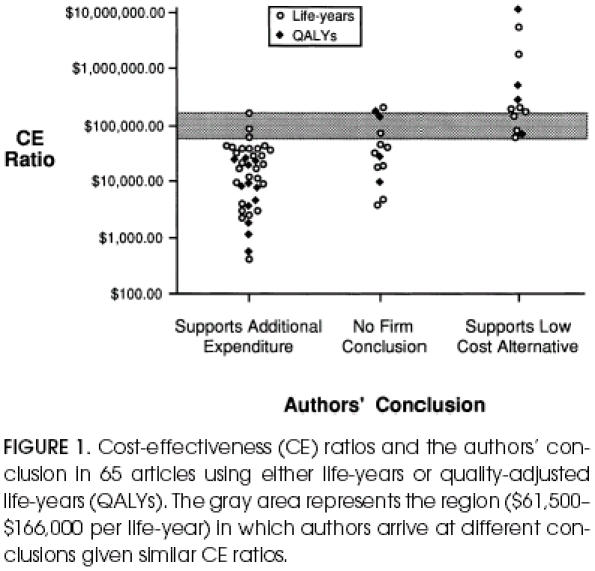
Cost-effectiveness (CE) ratios and the authors' conclusion in 65 articles using either life-years or quality-adjusted life-years (QALYs). The gray area represents the region ($61,500–$166,000 per life-year) in which authors arrive at different conclusions given similar CE ratios.
A number of articles reported multiple point estimates of CE ratios within the abstract. Given our interest in making inferences about the critical CE ratio, we developed the following guidelines to determine which CE ratio to collect. In articles that supported additional expenditure, we extracted the highest CE ratio among the strategies being advocated. Our reasoning was that all these values were below the author's critical CE ratio and that the highest most closely approximated the threshold value. In articles that supported the low-cost alternative, we extracted the lowest CE ratio among the strategies judged to be profligate. In this case, we reasoned that all these values remained above the author's critical CE ratio and that the lowest most closely approximated the threshold value. In articles that made no firm conclusion, we averaged the high and low values.
Source of Funding.
Finally, we examined the relation between the authors' conclusion and funding source. For this analysis, one of us (NAA) obtained the article itself and made a copy of any information dealing with financial support (appearing either on the title page or at the end of the article). A second copy was made masking the title, abstract, and other identifying information. Thus, the assessor of funding source (HGW) was blinded to the authors' conclusion. Funding source was classified using one of three categories:
Industry support. Any explicit acknowledgment of support from private industry (generally pharmaceutical companies or manufacturers of medical devices).
Unknown. No information about support provided.
No industry support. Explicit acknowledgment of support, that did not include private industry (generally from either public sources or private foundations). An explicit statement of “funding source: none” was also included in this category.
RESULTS
Table 2 details the characteristics of the 109 eligible articles; 72 (66%) of the CEAs analyzed either early detection strategies or the use of specific pharmaceuticals, and 11 (10%) involved medical devices, of which 7 involved implantable defibrillators. The numerator of the CE ratio was generally consistent—the overwhelming majority of the analyses used U.S. dollars. The denominator of the CE ratio, conversely, varied across studies. Less than one-fifth reported QALYs (a single measure combining morbidity and mortality), the current “gold standard.”15
Table 2.
Description of the 109 Eligible Articles
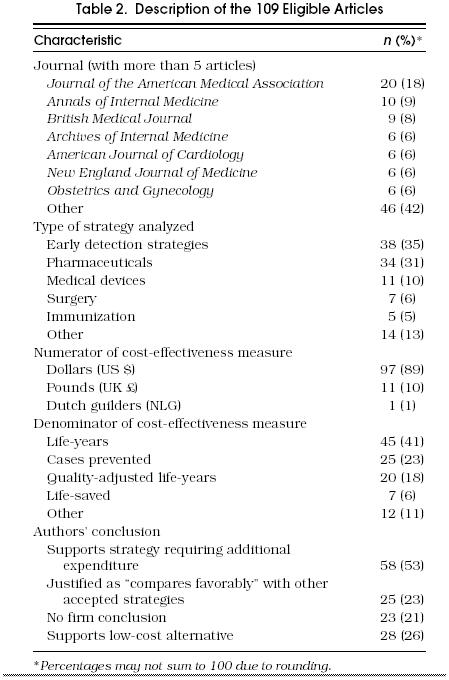
In 58 (53%) of the articles, the authors supported strategies that required additional expenditure. In slightly less than half of these, they justified their conclusion with a statement to the effect that the CE ratio of the strategy analyzed “compares favorably with other current practices.” In only 28 (26%) did the authors clearly support the low-cost alternative.
Authors' Conclusion and Cost-Effectiveness Ratio
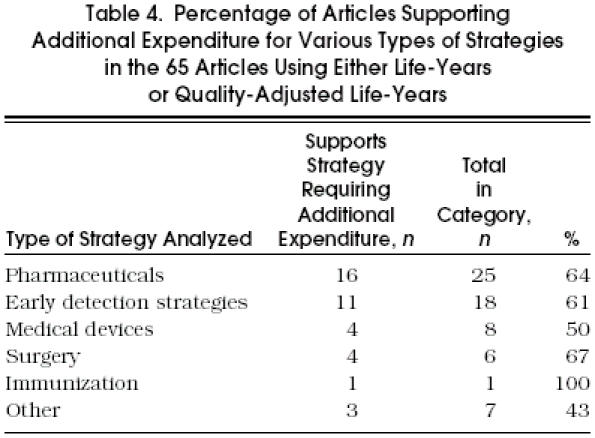
In order to examine the relation between the authors' conclusions and the magnitude of the CE ratio, we then focused on the 65 articles that reported a comparable denominator (i.e., life-years or QALYs). As shown in Table 3, in 39 (60%) of the 65 articles the authors supported strategies that required additional expenditure, while in only 13 (20%) did they support the low-cost alternative.Table 4 demonstrates that this tendency to support additional expenditures is present across all types of strategies.
Table 3.
Authors' Conclusion and Reported Cost-Effectiveness (CE) Ratios in 65 Articles Using Either Life-years or Quality-Adjusted Life-Years (QALYs)
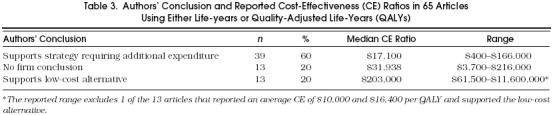
Table 4.
Percentage of Articles Supporting Additional Expenditure for Various Types of Strategies in the 65 Articles Using Either Life-Years or Quality-Adjusted Life-Years
The relation between the authors' conclusion and the reported CE ratio is shown in Table 3 and Figure 1. The median CE ratio for each category follows the expected pattern: namely, it is lower for supported strategies than for those in which no firm conclusion is made and, similarly, is lower for strategies with no firm conclusion than for those which support the low-cost alternative. Nevertheless, the range of CE ratios within each conclusion category is remarkably wide. Furthermore, Figure 1 shows that there is a substantial gray area (between $61,500 and $166,000 per life-year or QALY) in which authors arrive at different conclusions despite having similar CE ratios, suggesting considerable ambiguity about the critical CE ratio.
Authors' Conclusion and Source of Funding
Figure 2 shows the relation between the source of funding and authors' conclusion. Nine (90%) of the 10 articles that explicitly acknowledged funding from industry also clearly supported additional expenditure, as opposed to 15 (44%) of the 34 with no industry funding (Fisher's Exact, p= .01). The 21 articles for which source of funding was unspecified and unknown had an intermediate rate of supporting additional expenditure.
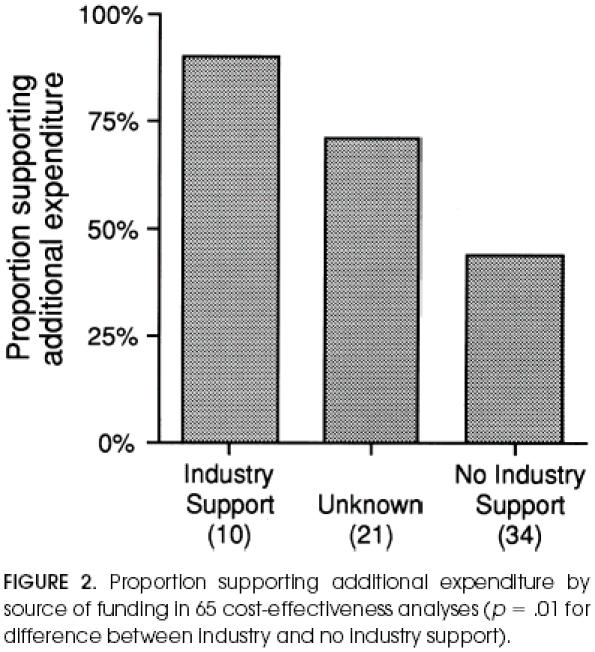
Proportion supporting additional expenditure by source of funding in 65 cost-effectiveness analyses (p= .01 for difference between industry and no industry support).
It appeared that industry funding might have also influenced the critical value of the CE ratio for asserting cost-effectiveness. Among the 39 articles that supported additional expenditure, the median CE ratio for the 9 studies funded by industry was significantly higher than for the remainder ($32,678 vs $9,500, Wilcoxon Rank Sum, p= .02).
DISCUSSION
We found that authors of CEAs are more likely to conclude that additional expenditure is warranted than not and that no obvious consensus exists about how small the CE ratio should be to justify such a conclusion. These data could lead one to wonder whether the CEA has functionally become a small hurdle that new strategies pass over easily. Our analysis, of course, only provides a limited view of CEA. We have only examined the literature since 1990 and confined ourselves to a narrow set of journals. Publication itself may unfairly restrict our sample. But our intent was to focus on those CEAs that are highly visible, as they are more likely to influence practice. Limiting our sample frame to articles published in journals with a wide readership and articles that arguably have cost-effectiveness as their primary focus, therefore, seemed appropriate for our investigation.
Our analysis was also limited in other respects. It was confined to articles that both had an abstract and that reported a CE ratio in that abstract. Although these restrictions clearly limit our sample frame, they minimized ambiguity in our data collection. It is difficult to imagine obtaining a more succinct statement of the authors' conclusion anywhere other than the abstract. And because we were also interested in the CE ratio on which it was based, the second criterion helped direct us to the relevant value. Furthermore, some may reasonably question the validity of our categorization of the authors' conclusion. Although it is difficult for us to allay this concern, Figure 1 demonstrates that our categorizations at least have face validity.
Policy Context
Practitioners of CEA will be quick to point out that reducing health care expenditures was never a goal for CEA; rather, the tool provides a mechanism to allocate limited health care resources. The conceptualization of the process is appealingly straightforward: rank clinical strategies based on their CE ratio and start funding from the lowest cost per effect until available resources are exhausted.1, 3, 6, 19 In this idealized application of CEA, population health would be optimized for any given amount of spending. But the implementation of this ideal is hindered by the two prerequisites implied: first, the existence of an external “global budget” (how big is the pie); and second, the availability of CE ratios for all clinical strategies (the universe of potential “consumers” of the pie). It is possible, although by no means certain, that the first prerequisite will someday be met.
But the second will never be. In their desire to increase the precision of CEA, practitioners have emphasized the need for better specifying the clinical strategy being analyzed (i.e., distinguishing among patients with different risks or among different drug doses)8 and for adding relevant detail (e.g., measuring the preferences of individual patients and capturing the costs of travel or child care).11, 15 These recommendations, although desirable, have side-effects: the former only increases the number of potential strategies to analyze; the latter demands that each analysis require more resources. Both, combined with the problem that health care strategies are continually evolving (and, thus, a “moving target”), make a comprehensive view of CE ratios in health even more unattainable.
Given that the ideal is unachievable, it is important to consider the current state of CEA in medicine: detailed analyses of a few selected clinical strategies and a vast number of strategies whose cost-effectiveness is unknown. Without the pretense of a CEA optimization of population health, it is reasonable to consider what the aggregate effect of these isolated bits of information is. Our primary finding suggests that CEAs are more likely to support additional expenditures than low-cost alternatives. Given its origins, it seems ironic that CEA appears to be, on balance, advocating for new health care expenditures.
Why might this be? It is possible that this is all the result of the selection process used to determine which strategies are analyzed. Or it could be the product of flaws in the methodology used to develop CE ratios, issues of internal and external validity that were recently raised by the U.S. Public Health Service Panel.15,18 Or perhaps CEA is particularly susceptible to the familiar problem of publication bias.20 Certainly these issues should be explored. Yet it is likely the problem is more fundamental: the problem of how to establish a consistent linkage between the CE ratio and the authors' conclusion.
If a comprehensive set of CE ratios for all clinical strategies existed, authors would have a complete context in which to draw conclusions about the relative standing of their analyzed strategy. In order to make a conclusion without such a context, they are forced to compare the CE ratio with some implicit standard: either a comparative standard (the other isolated strategies for which CE ratios have been calculated) or some benchmark CE ratio. This benchmark is often labeled the “critical” CE ratio—strategies with CE ratios below it are concluded to be “good buys,” while those with CE ratios above it are not. Although little is written about the absolute value of the critical CE ratio, tentative guidelines place it in the range of $20,000 to $100,000 per life-year.19 Because neither standard is explicitly fixed, it is not surprising that we found some variability in how authors make the link between the CE ratio and their conclusion. Conclusions were observed in all three categories given CE ratios between $61,500 and $166,000 per life-year.
We also observed that those CEAs which supported additional expenditure tended to cluster most closely immediately below this range (Fig. 1). This clustering may have important implications. In our data, roughly half the authors supporting additional expenditure justified their conclusion using the comparative standard: a statement to the effect that its CE ratio “compares favorably with other current practices.” The other current practices that serve as a standard are, by necessity, those that have been subjected to CEA. As more CEA-supported strategies have CE ratios distributed near the current standard, it is not surprising that one or two are supported despite having CE ratios slightly above it—thereby slightly inflating the comparative standard. Without an explicit benchmark as a standard, a positive feedback loop may result: allowing more expensive new strategies to still “compare favorably” to a standard that is creeping upward.
Finally, part of the tendency for CEA to advocate for additional expenditure can be explained by industry funding. Despite our small sample, studies funded by industry were significantly more likely to support additional expenditure. Because we have no way of knowing the “appropriateness” of these conclusions, this finding could be the result of a number of influences. Our data raise the possibility that industry analyses may have a higher benchmark for the critical CE ratio (making it easier for strategies to be “cost-effective”). The tendency to support additional expenditure may also be the product of strategy selection (the type of strategies private industry chooses to fund), hidden methodologic biases, or selective submission of analyses to journals (submitting only favorable analyses). Regardless of which explanations are operative, previously raised concerns about industry bias now seem even more credible.13, 14
Acknowledgments
This work was supported in part by a VA Health Services Research & Development (HSR&D) Merit Review Award (92-002). Mr. Azimi is a fourth-year medical student at the Dartmouth Medical School and was supported by the summer research assistantship program of the American College of Physicians (New Hampshire Chapter).
The authors are indebted to John Birkmeyer, MD, and Rob Pritchard, MD, in the Departments of Surgery and Medicine at our Veterans Affairs Hospital and Jonathan Skinner, PhD, in the Department of Economics at Dartmouth College for their valuable critique.
References
- 1.Detsky AS, Naglie G. A clinician's guide to cost-effectiveness analysis. Ann Intern Med. 1990;113:147–54. doi: 10.7326/0003-4819-113-2-147. [DOI] [PubMed] [Google Scholar]
- 2.Eddy DM. Oregon's methods: did cost-effectiveness fail? JAMA. 1991;266:2135–41. doi: 10.1001/jama.266.15.2135. [DOI] [PubMed] [Google Scholar]
- 3.Eddy DM. Cost-effectiveness analysis: a conversation with my father. JAMA. 1992;267:1669–75. doi: 10.1001/jama.267.12.1669. [DOI] [PubMed] [Google Scholar]
- 4.Thompson MS. Beverly Hills: Calif: Sage;; 1980. Benefit-cost analysis for program evaluation. [Google Scholar]
- 5.Warner KE, Hutton RC. Cost benefit and cost-effectiveness analysis in health care. Med Care. 1980;18:1060–84. doi: 10.1097/00005650-198011000-00001. [DOI] [PubMed] [Google Scholar]
- 6.Weinstein MC, Stasson WB. Foundations of cost-effectiveness analysis for health and medical practice. N Engl J Med. 1977;296:716–21. doi: 10.1056/NEJM197703312961304. [DOI] [PubMed] [Google Scholar]
- 7.Doubilet P, Weinstein MC, McNeil BJ. Use and misuse of the term “cost effective” in medicine. N Engl J Med. 1986;314:253–6. doi: 10.1056/NEJM198601233140421. [DOI] [PubMed] [Google Scholar]
- 8.Eddy DM. Cost-effectiveness analysis: is it up to the task? JAMA. 1992;267:3342–8. doi: 10.1001/jama.267.24.3342. [DOI] [PubMed] [Google Scholar]
- 9.Eddy D. Cost-effectiveness analysis: will it be accepted? JAMA. 1992;268:132–6. doi: 10.1001/jama.268.1.132. [DOI] [PubMed] [Google Scholar]
- 10.Eddy DM. Cost-effectiveness analysis: the inside story. JAMA. 1992;268:2575–82. doi: 10.1001/jama.268.18.2575. [DOI] [PubMed] [Google Scholar]
- 11.Udvarhelyi S, Graham AC, Rai A, Epstein AM. Cost-effectiveness and cost-benefit analyses in the medical literature. Ann Intern Med. 1992;116:238–44. doi: 10.7326/0003-4819-116-3-238. [DOI] [PubMed] [Google Scholar]
- 12.Smith TJ, Hillner BE, Desch C. Efficacy and cost-effectiveness of cancer treatment: rational allocation of resources based on decision analysis. J Natl Cancer Inst. 1993;85:1460–74. doi: 10.1093/jnci/85.18.1460. [DOI] [PubMed] [Google Scholar]
- 13.Hillman AL, Eisenberg JM, Pauly MV, et al. Avoiding bias in the conduct and reporting of cost-effectiveness research supported by pharmaceutical companies. N Engl J Med. 1991;324:1362–5. doi: 10.1056/NEJM199105093241911. [DOI] [PubMed] [Google Scholar]
- 14.Kassirer JP, Angell M. The Journal's policy on cost-effectiveness analyses. N Engl J Med. 1994;331:669–70. doi: 10.1056/NEJM199409083311009. [DOI] [PubMed] [Google Scholar]
- 15.Washington, DC;: Office of Public Health and Science;; 1996. Panel on Cost-effectiveness in Health and Medicine. Cost-effectiveness in Health and Medicine: Project Summary. [Google Scholar]
- 16.Russell LB, Gold MR, Siegel JE, Daniels N, Weinstein MC, for the Panel on Cost-effectiveness in Health and Medicine The role of cost-effectiveness analysis in health and medicine. JAMA. 1996;276:1172–7. [PubMed] [Google Scholar]
- 17.Weinstein MC, Siegel JE, Gold MR, Kamlet MS, Russell LB, for the Panel on Cost-effectiveness in Health and Medicine Recommendations of the Panel on Cost-effectiveness in Health and Medicine. JAMA. 1996;276:1253–8. [PubMed] [Google Scholar]
- 18.Siegel JE, Weinstein MC, Russell LB, Gold MR, for the Panel on Cost-effectiveness in Health and Medicine Recommendations for reporting cost-effectiveness analyses. JAMA. 1996;276:1339–41. doi: 10.1001/jama.276.16.1339. [DOI] [PubMed] [Google Scholar]
- 19.Laupacis A, Detsky AS, Tugwell PX, Feeny D. How attractive does a new technology have to be to warrant adoption and utilization? Tentative guidelines. Can Med Assoc J. 1992;146:473–81. [PMC free article] [PubMed] [Google Scholar]
- 20.Dickersin K. The existence of publication bias and risk factors for its occurence. JAMA. 1990;263:1385–9. [PubMed] [Google Scholar]