

Abstract
Alterations in endoplasmic reticulum (ER) cholesterol are fundamental for a variety of cellular processes such as the regulation of lipid homeostasis or efficient protein degradation. We show that reduced levels of cellular sterols cause a delayed ER-to-Golgi transport of the secretory cargo membrane protein ts-O45-G and a relocation to the ER of an endogenous protein cycling between the ER and the Golgi complex. Transport inhibition is characterized by a delay in the accumulation of ts-O45-G in ER-exit sites (ERES) and correlates with a reduced mobility of ts-O45-G within ER membranes. A simple mathematical model describing the kinetics of ER-exit predicts that reduced cargo loading to ERES and not the reduced mobility of ts-O45-G accounts for the delayed ER-exit and arrival at the Golgi. Consistent with this, membrane turnover of the COPII component Sec23p is delayed in sterol-depleted cells. Altogether, our results demonstrate the importance of sterol levels in COPII mediated ER-export.
Keywords: cholesterol, ER exit sites, membrane trafficking, modelling, photobleaching
Introduction
Cholesterol is an important structural and functional component of cellular membranes in all animal cells. Already, minor disturbances of membrane cholesterol content result in severe changes in membrane physical properties, affecting a plethora of functions including intracellular signalling or transport events (Simons and Ikonen, 2000; Maxfield and Tabas, 2005). In contrast to other cellular membranes, cholesterol content of the endoplasmic reticulum (ER) has been estimated to be low, with cholesterol contributing not more than few percent of total membrane lipids (Colbeau et al, 1971; Lange et al, 1999). Nevertheless, the ER is a major sterol regulating organelle, harbouring the molecular machinery by which cellular cholesterol homeostasis is maintained. Smooth ER membranes are a source for lipid droplets as storage organelles of esterified cholesterol as well as the site of the enzyme HMG-CoA reductase, catalyzing the rate-limiting step in the biosynthesis of cholesterol and nonsterol isoprenoids. Reduction of the sterol pool in ER membranes triggers transport of the membrane protein SCAP and the transcription factor SREBP from the ER to the Golgi complex, where the latter one is proteolytically activated to its nuclear form, which initiates the expression of genes responsible for the synthesis and uptake of cholesterol and fatty acids (Goldstein et al, 2006).
Apart from being a site for lipid synthesis and regulation, a pivotal function of the ER is its role in secretory protein trafficking. In mammalian cells, secretory cargo leaves the ER at distinct COPII coated ER-exit sites (ERES), which are stable for tens of minutes while the COPII components are rapidly turning over within seconds at these sites (Hammond and Glick, 2000; Stephens et al, 2000; Bevis et al, 2002; Soderholm et al, 2004; Forster et al, 2006). The vesicular coat complex COPII mediates cargo selection and concentration via an interaction of COPII components with cargo proteins or cargo receptors (Springer and Schekman, 1998; Aridor and Traub, 2002; Barlowe, 2003; Lee et al, 2005). The detailed molecular mechanisms of cargo accumulation in ERES as well as the mechanism how ERES are confined to the ER membrane remain to be fully understood. It has been suggested that in addition to interaction with proteins, interaction of COPII components with membrane lipids are critical for the formation of COPII coated transport carriers. The lipid composition of artificial liposomes has been demonstrated to be crucial for the efficient COPII vesicle formation in in vitro reconstitution experiments (Matsuoka et al, 1998) and treatment of semiintact cells with agents changing the lipid environment of the ER affect COPII vesicle formation and ER-export (Pathre et al, 2003).
It is therefore tempting to speculate that because of its low prevalence, already slight alterations of cholesterol content in ER membranes might perturb protein export from the ER. To address this, we analyzed the ER-to-Golgi transport of YFP-tagged secretory marker protein ts-O45-G (Presley et al, 1997; Scales et al, 1997) in HeLa cells with different sterol levels. Our results show that ER-to-Golgi transport of ts-O45-G is significantly delayed in sterol-depleted cells. We further demonstrate by 4D time lapse microscopy that delayed arrival at the Golgi complex correlates with a marked delay in the accumulation of ts-O45-G in individual ERES. Consistent with this, the turnover kinetics of COPII components at ERES are reduced in sterol-depleted cells. Altogether, this suggests that a reduction in cellular sterol levels is associated with a reduced efficiency of COPII coated transport carrier formation at ERES.
Results
Exit of ts-O45-G-YFP from the ER is delayed in sterol-depleted cells
Cellular sterols were depleted by exposing cells cultivated in lipoprotein-depleted serum (LDS) to 2-hydroxypropyl-β-cyclodextrin (HPCD). Several independent approaches have shown that this protocol allows efficient extraction of cholesterol from cultured cells (Kilsdonk et al, 1995b; Lange et al, 1999), thereby inducing a sterol-regulated transport of the SREBP cleavage activating protein SCAP from the ER to the Golgi complex where the proteolytic activation of SREBP is initiated (DeBose-Boyd et al, 1999; Nohturfft et al, 2000). In accordance with these data from the literature, our experimental conditions for sterol depletion induced the translocation of YFP-tagged SCAP from the ER to the Golgi complex (Supplementary Figure 1A) and initiated the proteolytic cleavage of SREBP-1 (Supplementary Figure 1B). Filipin staining demonstrated that under these conditions total cellular cholesterol levels were reduced to 62±0.2% of that in control cells (Supplementary Figure 1C). These data are consistent with previous work indicating that these treatments also drastically decrease the ER sterol levels (Lange et al, 1999). Sterol depletion was counteracted by addition of cholesterol and 25-hydroxycholesterol (25-HC) to the sterol-depleting culture medium (Kilsdonk et al, 1995a), a well-established procedure to potently suppress the activation of SREBP (Supplementary Figure 1A and B; see also DeBose-Boyd et al, 1999; Nohturfft et al, 2000) and to rapidly deliver sterols to cultured cells (Supplementary Figure 1C; see also Christian et al, 1997; Lange et al, 1999). Under our sterol-depleting conditions, the translocation rate of SCAP-YFP from the ER to the Golgi was maximal at about 1 h after adding HPCD to the sterol-depleting medium (Supplementary Figure 1A). We therefore chose this time point for the analysis of ts-O45-G ER-export in sterol-depleted cells.
HeLa cells expressing ts-O45-G-YFP at 39.5°C were shifted to the permissive temperature of 32°C (Scales et al, 1997), and transport from the ER to the Golgi complex was followed over a time period of 20 min (Figure 1). Confocal imaging of ts-O45-G-YFP in cells fixed at different time points after the temperature shift revealed a prominent difference in ts-O45-G-YFP trafficking to the Golgi. In control cells, an increase in the concentration of ts-O45-G-YFP at ERES could be observed almost instantly (<2 min) after the shift to the permissive temperature (Figure 1A, insets, upper panel; see also Presley et al, 1997; Scales et al, 1997) and juxta-nuclear Golgi labelling became apparent for the first time at 8–10 min after the temperature shift (Figure 1A, upper panel). In contrast, accumulation of ts-O45-G-YFP in ERES was significantly delayed under sterol depleted conditions (Figure 1A, insets, middle panel), becoming apparent only between 6 and 10 min after shifting to 32°C. Also, a clear localization of a prominent fraction of ts-O45-G-YFP to the Golgi could be seen only after about 15 min (Figure 1A, middle panel). In cells that received cholesterol and 25-HC to the sterol-depleting medium, ts-O45-G-YFP localization to ERES and subsequent Golgi labelling appeared similar as in nontreated control cells (Figure 1A, lower panel), indicating that the observed delay in ER to Golgi transport in sterol-depleted cells was specifically caused by the lack of sterols.
Figure 1.
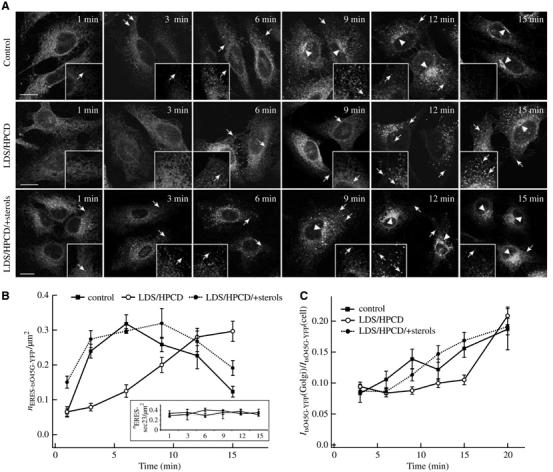
Export of ts-O45-G from the ER is delayed in sterol-depleted cells. (A) HeLa-cells expressing ts-O45-G-YFP at 39.5°C under control conditions (upper panel) and in the absence (LDS/HPCD; medium panel) or presence of sterols (LDS/HPCD/+sterols; lower panel) were shifted to 32°C for the indicated time points before fixation. Insets show z-projections of areas in the periphery of represented cells. Arrows denote examples for ERES, arrowheads juxta-nuclear Golgi-like staining. Bars: 10 μm. (B) Numbers of ERES positive for ts-O45-G-YFP (nERESts-O45-G-YFP) or sec23 (nERESsec23) were counted and nERES/μm2 were plotted against time. Each time point represents the mean from 20 to 40 areas±s.d. from 2–4 independent experiments under control conditions (▪, full line) or in the absence (○, full line) or presence (•, dashed line) of sterols. (C) ts-O45-G-YFP fluorescence intensities in the Golgi [(Its-O45-G-YFP(Golgi)] and total cell area [Its-O45-G-YFP(cell)] plotted against time. Each time point represents the mean from 10–25 cells±s.d. from 2 to 4 independent experiments.
At all time points investigated, the relative amount of ts-O45-G-YFP retained in reticular ER membranes was significantly higher in sterol-depleted cells than in controls. Quantification of the experiments showed that the number of ERES positive for ts-O45-G-YFP in control cells reached a maximum after 6 min following the temperature shift (Figure 1B). In contrast, in sterol-depleted cells, a comparable number of ts-O45-G-YFP-positive ERES was reached not before 15 min after shift to 32°C. Adding-back sterols could rescue this delay and ts-O45-G-YFP localization to ERES followed a similar dynamics as had been determined for control cells. No apparent difference in the number and distribution of ERES positive for the COPII marker Sec23 could be found between the three conditions tested (Figure 1B, inset). Quantification of ts-O45-G-YFP arrival at the Golgi in control cells and cells cultivated in the presence of sterols showed a steady increase during the course of the experiment (Figure 1C). In contrast, in sterol-depleted cells, the relative amounts of ts-O45-G in the Golgi compared to those in the ER remained at a basal level up to 15 min after shift to 32°C, indicative of an inhibition of ER to Golgi transport under these conditions. At later time points (>20 min) the amounts of ts-O45-G in the Golgi became similar to those in control cells. It is likely that this equilibration of ts-O45-G in the Golgi to levels comparable to control cells is a result of an inhibition of constitutive post-TGN transport in sterol-depleted cells as it has been described previously (Wang et al, 2000).
To analyze, if the observed delay in Golgi arrival of ts-O45-G in sterol-depleted cells could also be explained by a reduced velocity of ts-O45-G-containing vesicular-tubular clusters (VTCs), the long-range transport carriers moving ts-O45-G from the ER to the Golgi complex along microtubules (Presley et al, 1997; Scales et al, 1997; Watson et al, 2005), we performed live-cell imaging and tracked individual VTCs over time (Supplementary Figure 2; see also movies 1 and 2). No significant difference in the average velocity of VTCs between control and sterol-depleted cells could be observed (average velocity: 1.85±0.82 μm s−1 for control and 1.57±0.58 μm s−1 for sterol-depleted cells).
These combined results clearly show that cargo trafficking along the early secretory pathway is delayed under sterol-depleted conditions and that particularly early events at the ER level might be sensitive to alterations in cellular sterol levels.
To characterize this further, we analyzed by time-lapse microscopy the dynamics of ts-O45-G-YFP accumulation in individual ERES. To ensure that individual ERES could be followed during the entire time course of the experiment even when moving out of the focal plane, a 3D stack of optical sections was acquired every 3 s (Figure 2). In order to be able to follow and analyze a sufficient number of ERES becoming loaded with ts-O45-G even under sterol-depleted conditions, cells were shifted to 32°C and time-lapse imaging was started only 10 min after the temperature shift. In control cells, an accumulation of a major fraction of ts-O45-G-YFP in punctuate ERES and Golgi-like structures was already apparent at the beginning of the time-lapse analysis consistent with our results in fixed cells (Figure 2A, upper panel). In sterol-depleted cells, most ts-O45-G-YFP was still retained in reticular ER membranes at the beginning of the time-lapse analysis with only little Golgi-like labelling, and a frequent localization of ts-O45-G-YFP to ERES could only be observed at later time points of the time-lapse sequence (Figure 2B, upper panel).
Figure 2.
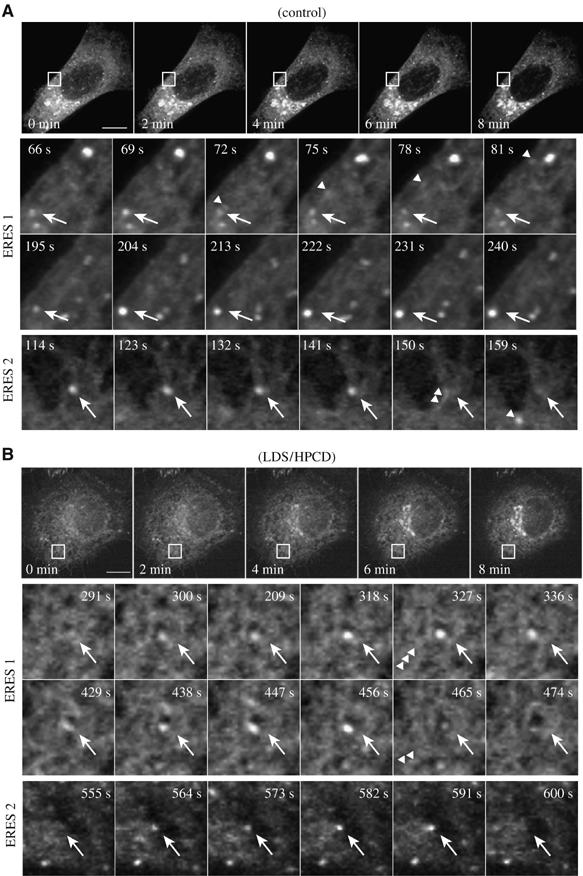
Cargo-loading to ERES is delayed in sterol-depleted cells. HeLa-cells expressing ts-O45-G-YFP were incubated at 39.5°C under control (A) or sterol depleted (B) conditions. Image acquisition was started between 5 and 10 min after shift to 32°C. Maximum intensity projections of frames of whole cells (top panels) or selected regions (lower 3 panels; outlined by box) from 4D-time-lapse sequences are shown. Arrows indicate ts-O45-G-YFP signal within selected ERES at the indicated time points after start of image acquisition. Arrowheads denote the release of vesicular carriers. Bars: 5 μm.
In ERES of control cells, ts-O45-G-YFP fluorescence increased very rapidly after the first appearance of elevated levels of ts-O45-G-YFP in ERES and reached a plateau between 3 and 6 s thereafter (Figure 2A, lower panels; Figure 3A, upper panel; Supplementary movie 3). These ERES were then depleted of cargo by the release of a ts-O45-G containing VTC moving rapidly towards the Golgi complex (see Figure 2A arrowheads; see also Supplementary movies). In contrast, in sterol-depleted cells ts-O45-G-YFP loading to individual ERES occurred much more slowly (Figure 2B, lower panels; Supplementary movie 4), which was characterized by a steady increase in ts-O45-G-YFP fluorescence intensity that could last up to 300 s (Figure 3A, lower panel), indicating that cargo accumulation in individual ERES was delayed when sterols were reduced.
Figure 3.
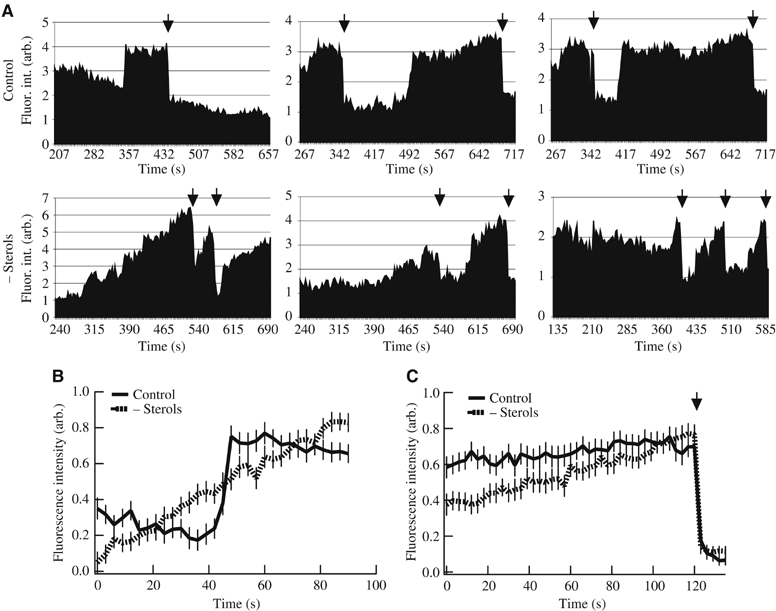
Sterol-dependent cargo dynamics in individual ERES. (A) Relative fluorescence intensity changes of ts-O45-G-YFP in single ERES in HeLa-cells at 32°C (as described for Figure 2) cultivated under control (upper panel) or sterol-depleted conditions (lower panel). Three instances are shown for each condition. Fluorescence intensities within ERES were normalized to ts-O45-G-YFP background fluorescence in reticular ER membranes. Arrows indicate drops in signal intensity reflecting events of cargo release. (B, C) Mean relative fluorescence signal intensities±s.d. from 13 control (full line) or 16 sterol depleted (dashed line) isolated ts-O45-G-YFP loading events to individual ERES. (B) Average fluorescence intensities 90 s around individual loading events were measured in ERES from three different ts-O45-G-expressing HeLa-cells per condition and plotted against time (in s). Note that we set the onset of increase in fluorescence intensity in each ERES as t=0. For sterol-depleted cells, successive 90 s were averaged. For control cells, we averaged fluorescence intensities ±45 s of the loading event. In (C), average fluorescence intensities over 120 s before an event of cargo release (arrow) were plotted against time.
The average loading rate of ts-O45-G-YFP to individual ERES (kon) in control cells was 4.6-fold higher than that determined in sterol-depleted cells (kon (control)=0.146 versus kon (depleted)=0.032) (Figure 3B; see Material and methods for details on kon determination). The maximum fluorescence intensity of ts-O45-G-YFP in a single ERES relative to neighbouring ER membranes immediately before the VTC release was on average 3.47±0.27-fold (n=21 events) in control and 3.57±0.33-fold (n=23 events) in sterol-depleted cells, consistent with a cargo concentration step occurring prior to cargo export from the ER as it has been described previously (Balch et al, 1994; Martinez-Menarguez et al, 1999; Malkus et al, 2002).
Most ERES released cargo one to four times during the course of an experiment, and irrespective of the sterol levels, cargo release was observed as a sharp drop in fluorescence intensity (Figure 3C; arrow). Ts-O45-G-YFP loaded ERES of control cells persisted for extended periods with little change in their fluorescence intensity before cargo release occurred abruptly (Figure 3A and C). In contrast, in sterol-depleted cells, discharge of cargo from ERES occurred almost instantly when the cargo load had reached an apparent upper limit (Figure 3A and C). Altogether, these results strongly support the hypothesis that sterols are an important factor regulating the accumulation of cargo proteins in ERES preceding ER-to-Golgi transport.
Endogenous ERGIC-53 is relocated to ER-membranes in sterol-depleted cells
We further tested if alterations in cellular sterol levels might also affect the ER to Golgi trafficking of endogenous cellular proteins. As candidate protein we chose ERGIC-53 a lectin-like transmembrane protein that is known to cycle between the ER and Golgi complex (Schweizer et al, 1988; Ben-Tekaya et al, 2005). If sterol depletion affected ER export of ERGIC-53 without compromising its recycling from the Golgi to the ER, one would assume a relocation of ERGIC-53 to the ER when cells are exposed to sterol depleting reagents for a sufficient period of time. Comparing cells cultivated under control conditions with those grown in the absence or presence of sterols revealed remarkable differences in the steady-state distribution of ERGIC-53. A major fraction of ERGIC-53 in control cells localized to ERES, with additional pools in the ER and juxtanuclear Golgi-like membranes (Figure 4A). In sterol-depleted cells, the punctuate ERES specific signal was reduced and an increase in diffuse ER-like reticular staining was observed (Figure 4A). After adding-back sterols, the ERES-specific ERGIC-53 signal increased to levels appearing even higher than in control cells (Figure 4A), indicating that the effect in sterol-depleted cells was sterol-specific. Also, a larger fraction of ERGIC-53 compared to controls appeared now associated with juxtanuclear Golgi-like membranes. Quantification of the number of ERGIC-53-positive ERES revealed a reduced fraction of the protein associated with ERES in sterol-depleted cells compared to controls (P<0.05) or cells cultivated in the presence of sterols (Figure 4B). More strikingly, quantification of the fluorescence intensities of ERGIC-53 in ERES relative to ERGIC-53 in ER-membranes showed that under sterol-depleted conditions significantly less ERGIC-53 was associated with individual ERES compared to controls or cells cultivated in the presence of sterols (P<0.001; Figure 4C). After adding back sterols, the ERGIC-53 specific signal in ERES relative to the ER was increased when compared to controls. It is possible that this may have been caused by an overcompensation when adding back sterols. Similar data were obtained when cells were kept at 37°C or 39.5°C (data not shown). These results suggest that the inhibition of ER-exit in sterol-depleted cells is not restricted to ts-O45-G only and point towards a more general role for sterols in cargo exit from the ER.
Figure 4.
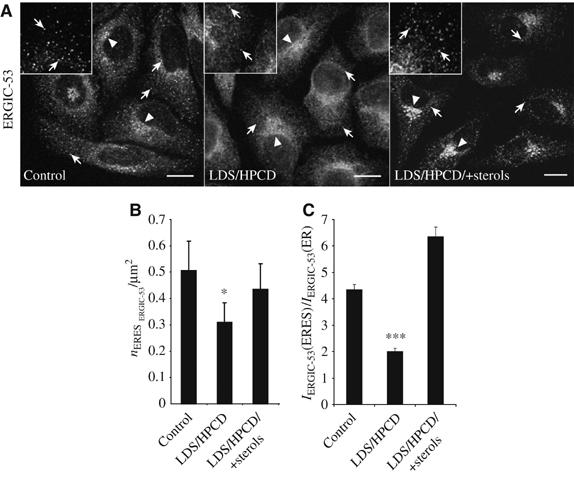
Steady-state localization of ERGIC-53 to ERES is affected by cellular sterol levels. (A) Immunostaining against ERGIC-53 in HeLa-cells cultivated under control conditions and in the absence (LDS/HPCD) or presence of sterols (LDS/HPCD/+sterols). Insets show z-projections of areas in the periphery of represented cells. Arrows denote examples for ERES. Arrowheads denote examples of juxta-nuclear Golgi-like staining. Bars: 10 μm. (B) Numbers (n) of ERGIC-53 positive ERES (nERES ERGIC-53) were counted in an area representing about 20% of total cell area. Each column represents the mean from 20 areas±s.d. from three independent experiments. (C) Ratios±s.d. of mean relative fluorescence signal intensities of ERGIC-53 in individual ERES [IERGIC-53(ERES)] compared to the area surrounding the respective ERES [IERGIC-53(ER)]. Each column represents the mean from 30 areas from three independent experiments.
The mobility of ts-O45-G in the ER is reduced in sterol-depleted cells
One mechanism by which cargo proteins might fail to be efficiently released from the ER could be by a restriction of their free diffusion in membranes. To examine a possible role of sterols on ts-O45-G dynamics within the ER, we determined its mobility by using fluorescence recovery after photobleaching (FRAP) (Nehls et al, 2000; Stephens et al, 2000; Forster et al, 2006). At 39.5°C, ts-O45-G-YFP showed a rapid mobility comparable to other FP-tagged proteins residing in ER membranes (Nehls et al, 2000). Fluorescence recovery reached a plateau within few seconds after photobleaching (Figure 5A, upper panel and B), indicating a rapid exchange of bleached ts-O45-G-YFP with unbleached ts-O45-G-YFP. However, when cellular sterols were depleted, a delay of fluorescence recovery compared to control cells could be observed (Figure 5A, lower panel and B). Quantitative analysis showed an increase in the half-time of maximal fluorescence recovery (τ1/2) of ts-O45-G-YFP in sterol-depleted cells compared to controls or cells exposed to sterol-depleting agents in the presence of sterols (Table I). Independent of the ER sterol levels only a small fraction (about 10%) of ts-O45-G-YFP was immobile.
Figure 5.
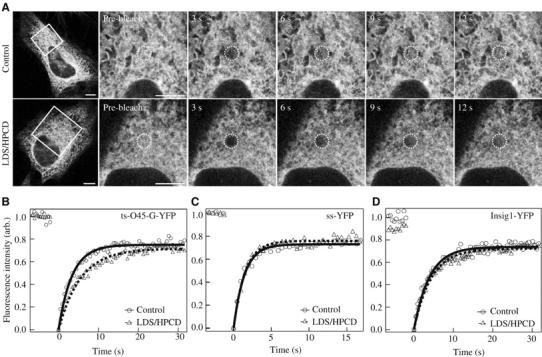
Lateral mobility of ts-O45-G-YFP in the ER is reduced upon sterol depletion. (A) FRAP analysis of ER-localized ts-O45-G-YFP in HeLa-cells incubated at 39.5°C under control (upper panel) or sterol-depleted conditions (lower panel). Images were obtained before photobleaching and at the indicated time points thereafter. The cell area acquired during the time course of the experiment is outlined by a box with the photobleached area (circle) in its centre. Bars: 5 μm. (B–D) FRAP analysis of ts-O45-G-YFP in the ER at 39.5°C (B), or ss-YFP (C) and Insig1-YFP (D) at 37°C under control (•, curve fit: full line) or sterol-depleted conditions (▴, curve fit: dashed line). Relative fluorescence intensities from one representative cell per condition were plotted against time (in s). Images were taken at 500 ms intervals (ss-YFP: 250 ms). For details on recovery curve analysis see Supplementary data.
Table 1.
Dynamics of ts-O45-G-YFP in the ER is reduced no matter of how sterols are depleted
| Construct | Temp (°C) | Condition | τ1/2±s.d. (s)a | fmob±s.d.a | ncells |
|---|---|---|---|---|---|
| ts-O45-G-YFP | 39.5 | Control | 2.511±0.107 | 0.878±0.115 | 45 |
| −Sterols (LDS/HPCD) | 4.262±0.146 | 0.881±0.140 | 49 | ||
| (LDS/HPCD/+sterols) | 2.998±0.226 | 0.835±0.160 | 25 | ||
| ts-O45-G-YFP | 39.5 | +Sterols (25-HC) | 2.489±0.099 | 0.888±0.096 | 46 |
| LDS | 2.910±0.174 | 0.873±0.107 | 11 | ||
| U18666A | 3.180±0.318 | 0.918±0.102 | 21 | ||
| Lovastatin | 3.273±0.382 | 0.863±0.124 | 9 | ||
| LDS/Lovastatin | 3.534±0.336 | 0.869±0.120 | 18 | ||
| MCD | 3.360±0.272 | 0.936±0.068 | 13 | ||
| LDS/MCD | 5.187±0.520 | 0.931±0.100 | 12 | ||
| ss-YFP | 37 | Control | 1.294±0.197 | 0.964±0.095 | 18 |
| −Sterols (LDS/HPCD) | 1.315±0.149 | 0.928±0.143 | 17 | ||
| Insig1-YFP | 37 | Control | 3.086±0.152 | 0.929±0.080 | 21 |
| −Sterols (LDS/HPCD) | 3.170±0.136 | 0.910±0.095 | 17 | ||
| SCAP-YFP | 37 | Control | 3.343±0.117 | 0.868±0.020 | 34 |
| −Sterols (LDS/HPCD) | 4.473±0.399 | 0.795±0.034 | 28 | ||
| Procollagen-YFP | 37 | Control | 3.899±0.259 | 0.870±0.026 | 16 |
| −Sterols (LDS/HPCD) | 5.177±0.289 | 0.831±0.033 | 20 | ||
| aMeans±s.d. from 2 to 5 independent experiments. | |||||
Ts-O45-G-YFP dynamics were also reduced by exposing cells to alternative sterol-depleting agents (for details, see Supplementary data), but essentially unchanged in cells saturated with sterols by an extended exposure of cells to 25-HC (Table I). No apparent morphological differences in ER structure could be observed in sterol-depleted cells compared to controls (Figure 5A, data not shown). However, to exclude the possibility that the reduced mobility of ts-O45-G-YFP was a consequence of a putative disintegration of the ER induced by sterol-depleting agents, we performed FRAP on soluble YFP-protein carrying the ER-retention signal KDEL (ss-YFP) (Figure 5C) as well as on the ER-resident integral membrane protein Insig1-YFP (Figure 5D) (Yang et al, 2002). However, no difference in τ1/2 could be seen between sterol depleted and control cells (Table I), indicating that the overall ER environment was unaffected by our sterol-depletion conditions.
To test, if sterol depletion could also affect the mobility of other cargo proteins, we performed FRAP on the YFP-tagged cargo proteins SCAP and procollagen-I (Stephens and Pepperkok, 2002). Most notably, similar to ts-O45-G, these alternative cargo proteins also showed an increased τ1/2 in ER membranes of sterol-depleted cells relative to controls (Table I). This suggested that a reduced mobility in ER membranes of sterol-depleted cells might not be restricted to ts-O45-G, but also affects further cargo molecules in the ER.
Dynamics of cargo accumulation within ERES and not the diffusional mobility is critical for cargo export dynamics from the ER
Our experiments showed thus far that delayed arrival of ts-O45-G at the Golgi in sterol-depleted cells is accompanied by an inhibition of cargo loading to ERES and a reduction of ts-O45-G mobility in ER membranes. This raised the possibility that the reduced diffusional mobility could account for the delayed loading of cargo to ERES and thus inhibit ER-export of ts-O45-G. We therefore wanted to analyze if at all and how diffusional mobility and cargo loading to ERES are interrelated and whether these events could account for the delayed ER export of ts-O45-G in sterol-depleted cells. To address this, these processes were simulated and tested which parameters are critical to reproduce our experimental findings such as the delayed Golgi arrival of ts-O45-G in sterol-depleted cells (Figure 1).
We assumed that export of a given cargo protein from the ER is influenced by two major parameters (Figure 6A; see Supplementary Data for details). First, by its mobility within the ER which is reflected by its apparent diffusion constant Dapp, and second, by its loading to ERES, characterized by the binding constants kon and koff. The export rate of ts-O45-G from the ER could also be affected by the distance between neighbouring ERES (dERES), the diameter of each ERES (AERES) or the extent of cargo accumulation in ERES (Ithreshold) preceding cargo release and subsequent transport to the Golgi. Since our experiments showed that these parameters were not affected by the cellular sterol levels (Figure 1B, inset, and 2 and 3), they were initially kept constant in the simulation with (dERES)=3 μm, (AERES)=450 nm, and (Ithreshold)=4-fold. When parameters derived from our experimental results from cells cultivated under control conditions (Dapp=0.472, kon=0.148) were used for the simulation, release of ts-O45-G from the ER was rapid, with the onset of cargo export occurring 8.1 s after start of the simulation (Figure 6B). In contrast, parameters derived from sterol-depleted cells (Dapp=0.278, kon=0.032) yielded a 5.8-fold delay of the onset of ts-O45-G ER export (47.0 s after start of the simulation). Similarly, the time required for half-maximum release of ts-O45-G from the ER was 16.7 s in control cells and 69.6 s in sterol-depleted cells, again arguing for a delayed clearance of ts-O45-G from the ER in sterol-depleted cells (Figure 6B). These results show that the model underlying our simulations is able to reproduce faithfully our experimental finding of a delayed Golgi arrival in sterol-depleted cells.
Figure 6.
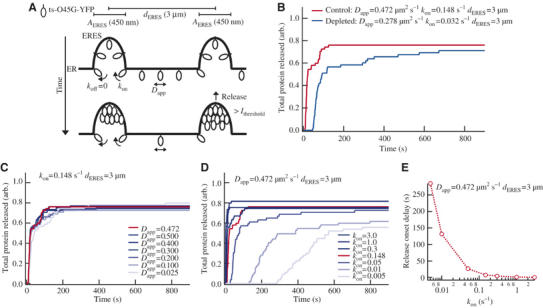
Modelling of the ER exit dynamics of ts-O45-G. (A) Illustration of parameters used in the simulation. The upper panel displays the situation at t=0 (immediately after temperature shift), with ts-O45-G (small ellipsoids) distributed evenly along the ER membrane and diffusing laterally with a diffusion constant Dapp (μm2 s−1). Ts-O45-G molecules bind to ERES with the rate-limiting binding constant kon (s−1) and eventually may dissociate back to the ER with koff (s−1). At permissive conditions, we assume koff=0. dERES, distance between the centre of each ERES. AERES, average diameter of one ERES. Over time (lower panel), ts-O45-G accumulates within ERES. When its amount in ERES exceeds a threshold level (Ithreshold), a vesicular carrier is released, depleting the ERES of ts-O45-G. (B) Simulation results using parameter values experimentally determined from control (red) or sterol depleted (blue) HeLa-cells expressing ts-O45-G. Cumulative amounts of ts-O45-G protein released from the ER are plotted against time. (C) Blue curves: simulation results when kon was kept constant and Dapp was varied. Red curve: cumulative protein release with control parameters (B). (D) Blue curves: simulation results when Dapp was kept constant and kon was varied. (E) Delay in the onset of protein release plotted against kon.
Next, we used the simulation to make predictions about the relative importance of the parameters Dapp, kon, koff, dERES or Ithreshold for cargo export from the ER. By changing one parameter while leaving the others constant, we determined the relative contribution of each parameter on the release of ts-O45-G from the ER. Variation of Dapp even by a factor of 20 had only little influence on cargo export dynamics from the ER (Figure 6C) and a delayed onset of ER release, as we observed it experimentally, could not be reproduced under these conditions. This suggests that a reduced diffusional mobility within the ER is not the factor responsible for a delayed ER-exit of ts-O45-G in sterol-depleted cells. Similar results were obtained when Dapp was varied with different fixed values for kon (e.g. for kon=1.0 s−1; see Supplementary Figure 3A). In contrast to this, already minor deviations of kon from the experimentally determined value (kon=0.148) affected ER export of ts-O45-G dramatically (Figure 6D). We initially assumed koff=0 since under permissive conditions dissociation of ts-O45-G from ERES back to the reticular ER may be expected to be very small compared to the fraction that once bound remains associated with ERES. However, an increase in koff in sterol-depleted cells might well account for the observed delayed arrival in the Golgi complex. Such increase in koff could, for example, occur if sterol depletion inhibited the folding of ts-O45-G, thus increasing the rate of dissociation of ts-O45-G from ERES. To test if sterol depletion affected ts-O45-G folding, we stained cells with the antibody I-14 that recognizes only properly folded ts-O45-G. As described previously (Mezzacasa and Helenius, 2002) and irrespective of the sterol levels, the I-14 staining signal was low immediately after shifting cells to 32°C, but rapidly increased thereafter (Supplementary Figure 4A). No significant difference in the staining intensities between control and sterol-depleted cells could be observed for all time points after the temperature shift tested (Supplementary Figure 4B), indicating that folding of ts-O45-G-YFP in sterol-depleted cells was not inhibited compared to controls. Consistent with this, a delayed onset of ER export of ts-O45-G could not be obtained in our simulations by varying koff over a wide range of values (Supplementary Figure 3B and C).
Similarly, alterations of (dERES) did not cause a delay in the onset of ts-O45-G-exit from the ER (Supplementary Figure 3D).
Increasing Ithreshold, which reflects an increased accumulation of cargo in ERES before cargo can be released showed a delay in ER export only for values of Ithreshold=8 and higher (Supplementary Figure 3E). As under our experimental conditions, only values for Ithreshold between 2 and 6.5 were observed (Figure 3) and Ithreshold was similar in sterol-depleted cells and controls (Figure 3), we concluded that changes in Ithreshold could not account for the observed delayed arrival of ts-O45-G in the Golgi of sterol-depleted cells.
In summary, these simulations of ER export together with our experimental data suggest that sterol depletion causes a decrease in kon values.
Sterol depletion affects the turnover of COPII subunit Sec23p at ERES
The results described so far suggest that sterol depletion inhibits the loading of secretory cargo to ERES, thereby affecting subsequent transport, which ultimately leads to a delayed arrival of ts-O45-G at the Golgi complex in sterol-depleted cells compared to controls. As sorting of secretory cargo into transport carriers at ERES is known to be mediated by the COPII vesicular coat complex, we investigated next if sterol depletion also affected COPII.
Only minor differences between sterol depleted and control cells could be observed in the steady-state distribution of endogenous Sec23 (Figure 1B, inset) or YFP-tagged COPII-marker proteins Sar1p and Sec23p (Figure 7; Table II). We next analyzed COPII turnover at single ERES in living HeLa-cells by using FRAP (Forster et al, 2006). While the time required for half-maximal fluorescence recovery (τ1/2) of Sar1p-YFP remained unchanged between cells cultivated under control or sterol-depleted conditions, the τ1/2 of Sec23p-YFP increased from 2.99±0.37 in controls to 4.22±0.63 in sterol-depleted cells (Table II). The mobile fraction of YFP-tagged COPII-subunits was not apparently different between sterol-depleted cells and controls (Table II). These results are consistent with the delay in cargo loading to ERES in sterol depleted cells and suggest that it might be brought about by a reduced efficiency in COPII coat function. Which step(s) in the COPII assembly/disassembly cycle at ERES were affected by sterol depletion in our experiments cannot directly be derived from the FRAP data as the fluorescence recovery kinetics measured are the sum of the contributing single steps.
Figure 7.
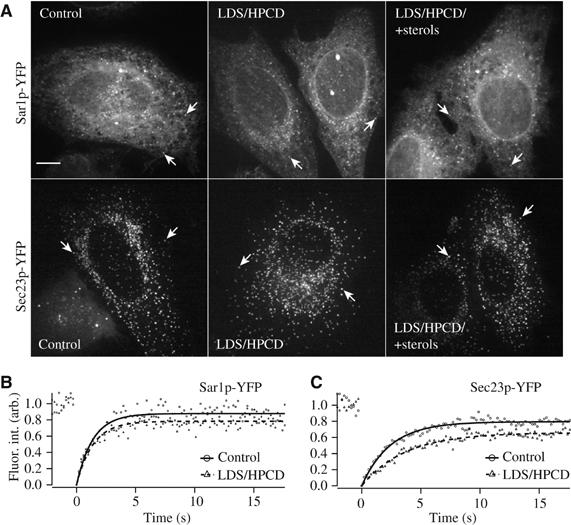
ER-sterol levels affect turnover of COPII subunits at ER exit sites. (A) HeLa-cells expressing YFP-tagged Sar1p or Sec23p were cultivated under control conditions and in the absence (LDS/HPCD) or presence of sterols (LDS/HPCD/+sterols). Maximum intensity projections of frames of whole cells from a 4D-time-lapse sequence are shown. Arrows indicate selected ERES. Bar: 5 μm. (B, C) FRAP analysis of Sar1p-YFP (B) and Sec23p-YFP (C) under control conditions (•, curve fit: full line) or in the absence (▴, curve fit: dashed line) of sterols. Relative fluorescence intensities from one representative cell per condition were plotted against time (in s). Images were taken at 200 ms intervals. For details on recovery curve analysis see Supplementary data.
Table 2.
Steady-state distribution of YFP-tagged COPII-subunits and kinetics of turnover at single ERES
| Construct | Condition | n(ERES)/μm [nERES] | τ1/2±s.d.(s) [nERES] | fmob±s.d. [nERES] | ERES: (CP+ER) [nERES] |
|---|---|---|---|---|---|
| Sar1p-YFP | Control | 0.28±0.01 [32] | 1.05±0.21 [20] | 0.94±0.02 [20] | 0.14±0.01 [32] |
| LDS/HPCD | 0.28±0.02 [30] | 1.06±0.10 [22] | 0.85±0.03 [22] | 0.15±0.03 [30] | |
| Sec23p-YFP | Control | 0.46±0.03 [34] | 2.99±0.37 [26] | 0.80±0.04 [26] | 0.65±0.04 [34] |
| LDS/HPCD | 0.51±0.03 [28] | 4.22±0.63 [35] | 0.71±0.05 [35] | 0.73±0.04 [28] |
In order to obtain insights into which step during COPII assembly/disassembly at ERES was affected by sterol depletion, we made use of a previously developed mathematical model for the COPII kinetics at ERES (Forster et al, 2006). Using this approach, we systematically calculated FRAP curves for a large set of possible values of the model parameters and retained those parameter sets that resulted in recovery times and steady-state values that were consistent with the experimental data of Table II. The retained range for the model parameters sets is given in Table III. These data show that the rate ω, which encodes the probability of Sar1p to undergo GTP exchange and subsequently recruit Sec23/24p, was the parameter that was altered most significantly (decrease to 59%) in sterol depleted compared to control cells (Table III). The parameter λ, which is the rate of Sec23p release from membranes after GTP hydrolysis by Sar1p, was also reduced (Table III). This corresponds to a longer residence time of COPII on ERES and is consistent with the reduced cargo export kinetics observed in our experiments in sterol-depleted cells.
Table 3.
Kinetic parameters of COPII turnover simulation under control and sterol depleted conditions
| Parametera | Control | LDS/HPCD | Ratio [LDS/HPCD:control] |
|---|---|---|---|
| R | 0.408±0.176 | 0.384±0.144 | 0.941 |
| k | 0.162±0.071 | 0.163±0.076 | 1.006 |
| Γ | 1.706±1.019 | 1.333±0.608 | 0.781 |
| ω | 0.406±0.270 | 0.242±0.099 | 0.596 |
| γ | 0.386±0.088 | 0.339±0.081 | 0.878 |
| λ | 0.170±0.029 | 0.113±0.018 | 0.665 |
| S*/(S*+Cm) | 0.468±0.100 | 0.476±0.084 | 1.017 |
| aParameter space that reproduced the experimental data. The range still consistent with these constraints is given by the ‘±’ values. Parameters were defined as: R, ratio of total cellular Sec23/24p to Sar1p; k, Sar1p-GDP binding to ERES; Γ, release of Sar1p-GDP from ERES; ω, GTP-exchange rate; γ, rate of GTP-hydrolysis on Sar1p; λ, release of Sec23/24p from ERES; S*/(S*+Cm), ratio of membrane bound Sar1p-GDP relative to total Sar1p at ERES (for details, see Forster et al, 2006). | |||
Discussion
The results shown here provide strong evidence that cellular sterol levels are important for COPII mediated export of secretory cargo from the ER. Accumulation of the secretory marker protein ts-O45-G in single ERES was delayed in sterol-depleted cells and lead to a delayed arrival of the marker in the Golgi complex. Impaired ER-to-Golgi trafficking was not restricted to ts-O45-G only but could also be demonstrated for the endogenous membrane protein ERGIC-53, which is known to cycle between the ER and the Golgi complex. This suggests that the delay in ER-export demonstrated here for the marker protein ts-O45-G highlights a more general importance of sterol levels in ER-export of secretory cargo. Consistent with such a general role, we could further demonstrate that sterol depletion also affected the membrane turnover of the COPII component Sec23p at ERES. Mathematical modelling of the FRAP experiments measuring COPII membrane turnover, an approach previously described (Forster et al, 2006), predicts that sterol depletion predominantly leads to a reduced membrane recruitment of Sec23p coincident with an increased residence of Sec23p on ERES after GTP hydrolysis by Sar1p. Based on these results we conclude that at least one step in ER-export is functionally linked to cellular sterol levels at the level of COPII action. In full agreement with this interpretation are the results obtained when we simulated ER-export by considering the relative contributions of the potential parameters involved. These simulations clearly predicted that sterol depletion predominantly results in a decrease of the rate of cargo loading to ERES (kon), which involves COPII function, in order to reproduce our experimental results on the delayed ER-export and thus delayed arrival of ts-O45-G at the Golgi.
A delay in ER-to-Golgi transport or reduced incorporation of cargo into COPII coated vesicles has not been observed in earlier studies investigating trafficking of VSVG in cholesterol depleted cells (Keller and Simons, 1998; Espenshade et al, 2002). Also, under sterol depleted conditions an enhanced ER-to-Golgi transport of SCAP has been extensively described (Nohturfft et al, 2000; Goldstein et al, 2006). At least two explanations exist that may resolve these apparent discrepancies with our data here. First, these earlier studies did not investigate in detail the export rate of ts-O45-G from the ER, and they were lacking the temporal resolution of analysis provided by our experimental settings that enabled us to detect in living cells a delay in ts-O45-G ER-export and membrane turnover of the COPII component Sec23p under sterol-depleted conditions. Second, the presence of multiple homologues of the Sec23/24-familiy (Paccaud et al, 1996; Miller et al, 2002) indicates that alternative isoforms of COPII may exist. One might therefore speculate that under sterol-depleted conditions such isoforms, potentially with a different preference for certain lipids, might allow the incorporation of SCAP into nascent COPII-coated carriers and reduce that of constitutively secreted cargo. In this context, it is important to note that the enhanced ER-to-Golgi transport efficiency of SCAP in sterol-depleted cells is most likely due to an altered binding affinity of SCAP to COPII (Sun et al, 2005), not to an overall increased efficiency of the COPII coat. Further experiments in living cells with different Sec23/24p isoforms will be needed to investigate the possibility and molecular details of this point.
Why may a delayed ER-to-Golgi transport and membrane turnover of Sec23p, and thus impaired COPII function, be of physiological relevance, when regulatory proteins such as SCAP and SREBP need to be efficiently exported from the ER in sterol depleted cells (Nohturfft et al, 2000)? A possible answer could be that a delayed ER-export counteracts the enhanced capability of SCAP to bind COPII, thereby contributing to smoothening out rapid oscillations of ER sterols in a feedback loop. In this way only sustained changes in cholesterol levels in the ER would cause the rapid transport of SCAP to the Golgi and the activation of the entire machinery for increasing cellular sterol levels (Goldstein et al, 2006).
Coincident with the delay in ER-exit in sterol-depleted cells, we also show here that the mobility of ts-O45-G, SCAP and procollagen, but not of a luminal protein or the ER-resident membrane protein Insig1, are reduced relative to controls. The mobile fraction of ts-O45-G, however, was not affected by sterol depletion, indicating that reduced ts-O45-G dynamics in sterol-depleted cells cannot be explained by its binding to an immobilizing scaffold. As ts-O45-G mobility in the ER and its recognition by the ER export machinery may be linked (Nehls et al, 2000), our findings prompted us to postulate that a reduced diffusional mobility in sterol-depleted cells may account for the reduced ER-export of ts-O45-G as observed here. However, our mathematical simulations of ER-exit predict that it is predominantly the rate of cargo loading to ERES (kon) rather than the diffusion (Dapp), which determines ER-export rates of secretory cargo proteins. While Dapp could be modified over a wide range of values without significantly affecting ts-O45-G ER-export, already minor changes in kon, koff, dERES or Ithreshold strongly affected ER-exit. We therefore conclude that in general the diffusional mobility is unlikely to account for the inhibited efficiency of ER-export as observed here in sterol-depleted cells. Systematic variations of the remaining parameters of our simulations revealed that only a reduction of kon and not that of the other parameters could reproduce all of our experimental data. We thus propose that the delayed ER-export of ts-O45-G by sterol depletion is a consequence of a slower cargo loading to ERES. Our findings however do not exclude the possibility that the remaining parameters of our simulations play important roles at different levels during ER-export, for example, that the rate koff is of crucial importance for ER-export kinetics under conditions where protein folding is impaired.
How could sterols affect the loading of secretory cargo proteins to ERES? Several scenarios can be proposed. First, sterols may contribute to provide a local physical environment required for ERES formation or cargo concentration therein (Bevis et al, 2002; Soderholm et al, 2004). For example, cholesterol- and sphingolipid-rich lipid rafts are proposed to provide a lateral organization for proteins and lipids within the membranes of several cellular organelles, and enrichment of molecules in lipid rafts is believed to be involved in a number of membrane-trafficking processes (Simons and Ikonen, 2000; Maxfield and Tabas, 2005). During their exit from the ER, a separation of raft-associated proteins from other cargo proteins has been suggested (Muniz et al, 2001), and association of newly synthesized cholesterol with detergent insoluble membranes begins very early after its synthesis, indicating that raft assembly may already be initiated in the ER (Heino et al, 2000).
Second, sterols in the ER may interfere with efficient protein folding. Failure to be released from dynamically interacting chaperones may contribute to both, a reduced ts-O45-G diffusion in the reticular ER as well as a slowed down ER-export kinetics in sterol-depleted cells, and interaction of incompletely folded cargo proteins and chaperones is likely to interfere with cargo entry into ERES (Mezzacasa and Helenius, 2002). However, when studying early folding events with a folding-specific anti-ts-O45-G-antibody, we could not detect significant differences among controls or sterol-depleted cells, excluding the possibility that protein folding of ts-O45-G is impaired in sterol-depleted cells.
Third, and in our opinion the most likely scenario how sterol depletion could affect ts-O45-G loading to ERES would be an interference with the COPII machinery, which mediates cargo sorting and concentration into COPII coated vesicles (Lee et al, 2005). Indeed, our FRAP experiments show that membrane turnover of Sec23p at single ERES of sterol-depleted cells is decreased relative to controls. Simulations with a recently introduced model of COPII-coat assembly and disassembly on ER membranes (Forster et al, 2006) predicts that such changes in membrane turnover are a consequence of an about two-fold reduction in the rate ω of GTP exchange on Sar1p and subsequent recruitment of Sec23/24p. As the model underlying these simulations does not discriminate between GTP exchange and Sec23/24p membrane recruitment, it is presently unclear which of the two reactions is affected by sterol depletion. The results of our combined experimental and simulation approach are highly consistent with previous reports that have shown that the Sar1p-mediated recruitment of Sec23/Sec24p to ER-membranes depends on the lipid composition of artificial liposomes in in vitro reconstitution experiments investigating the budding of COPII coated transport carriers (Matsuoka et al, 1998).
Materials and methods
Antibodies and materials
Mouse monoclonal antibodies were from H-P Hauri (anti-ERGIC-53), A Helenius (I-14) or described previously (anti-Golgi 6c6; Ho et al, 1989). Further materials, cell culture and expression of markers are described in Supplementary Data.
Sterol depletion
For sterol depletion, cells cultivated in DMEM/2 mM L-glutamine/100 IU/ml Penicillin/100 μg/ml Streptomycin/0.5% LDS were exposed to 1% (w/v) HPCD for 1 h before analysis. Where indicated, sterol-depletion was counteracted by the simultaneous addition of 10 μg/ml cholesterol/1 μg/ml 25-HC. For alternative protocols used to modify cellular sterols, see Supplementary data.
Quantification of ts-O45-G and ERGIC-53 transport
For details on immunofluorescence and image acquisition see Supplementary Data. For quantitative ts-O45-G-YFP transport analysis, the number of Sec23-positive ERES and the number of ERES positive for ts-O45-G-YFP per area were counted for each individual time point indicated by using NIH ImageJ software 1.34j (Wayne Rasband Analystics, Bethesda). An identical protocol was applied for the quantification of the number of ERES positive for ERGIC-53. For the determination of the amount of ERGIC-53 in ERES, individual ERES were selected and signal intensities were determined first in a cubic area completely covering the size of the selected ERES, then in a nine-fold larger cubic area with the selected ERES in its centre. Mean fluorescence intensities of ERGIC-53 in ERES were quantified and normalized to ERGIC-53 fluorescence in the surrounding ER-membranes after subtracting extracellular background fluorescence. For the quantification of the steady-state levels of YFP-tagged COPII-subunits in living cells, the ratio of total fluorescence associated with ERES relative to that not associated with ERES (ERES:ER+CP) was determined manually on background substracted images by using the overlay features of ImageJ software (Forster et al, 2006).
For the quantification of ts-O45-G-YFP in the Golgi, whole-cell areas were determined with the plasma membrane marker Concanavalin A conjugated with TexasRed (Molecular Probes). Individual channels were exported by Zeiss LSM software (Carl Zeiss, Jena) and 8-bit tiff images were further processed by using MetaMorph software (Universal Imaging Corporation, Downington, PA). Total fluorescence intensity per cell was determined by measuring ts-O45-G-YFP fluorescence within a mask generated in the Concanavalin A channel. Ts-O45-G-YFP fluorescence in the Golgi area was determined with a mask generated in the 6c6 channel. Background fluorescence was subtracted, and ratios of fluorescence intensities were determined for each individual time point indicated.
Quantification of ts-O45-G loading to ERES
For details on live-cell imaging and FRAP, see Supplementary data. For the determination of ts-O45-G-YFP in individual ERES, regions within the cells were enlarged three-fold without interpolation by using ImageJ software. Individual ERES were selected and signal intensities in a cubic area completely covering the size the selected ERES were quantified in each frame over time. For intensity measurements, extracellular background fluorescence was subtracted from the average intensity in ERES. The rate of ts-O45-G-YFP accumulation within individual ERES is proportional to the increase of fluorescence intensity over time (Figure 3). This rate depends on a balance between binding of free ts-O45-G to the ERES and dissociation of ts-O45-G from the ERES.
![]()
During the initial phase of cargo loading to ERES, the amount of ts-O45-G bound to the ERES is very small compared to that of free ts-O45-G in tubular ER membranes. Therefore, [tsO45GERES]≅0 and (1) is reduced to 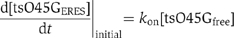 thus,
thus, 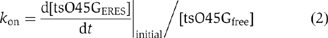 The initial accumulation rate
  was measured by fitting a standard linear equation to the initial increasing phase of one individual cargo loading event. Unbound ts-O45-G density in ER membranes [tsO45Gfree] corresponds to the baseline of fluorescence intensity before the accumulation starts. In order to measure the accumulation rate in control cells, we fitted the initial three time points (6 s) of the loading phase, that is, when fluorescence intensity within on eERES becomes higher than baseline fluorescence. [tsO45Gfree] was determined by averaging fluorescence level at five time points immediately preceding the initiation of cargo loading to one ERES. To measure the accumulation rate in sterol-depleted cells, we fitted the first six time points (15 s) of the loading phase. This could be done, because the accumulation rate in sterol-depleted cells was slower than in control cells and because there the increase in fluorescence intensity was linear and stable. For sterol-depleted cells, [tsO45Gfree] was measured by averaging fluorescence intensities at two time points preceding the initiation of cargo loading to one ERES. We plotted the measurement results in
 and by linear regression, we estimated kon under control or sterol-depleted conditions.
Modelling of ts-O45-G ER-exit dynamics
For a detailed description of the mathematical simulation describing the dynamics of ts-O45-G ER-export, see Supplementary data. For details on modelling the turnover of COPII subunits at ERES, see Supplementary data and Forster et al (2006).
Supplementary Material
Supplementary Figure 1
Supplementary Figure 2
Supplementary Figure 3
Supplementary Figure 4
Supplementary Data
Supplementary Data
Supplementary Data
Supplementary Data
Supplementary Data
Acknowledgments
We thank the Advanced Light Microscopy Facility Team at EMBL Heidelberg for helpful discussions; J Rietdorf, H-P Hauri, A Helenius, S Wiemann and B Joggerst for reagents and support; G Griffiths and F Verissimo for critical comments on the manuscript. Support of the ALMF by Carl Zeiss and Perkin Elmer is acknowledged. This work was supported by the Young Investigator Award, Heidelberg School of Medicine to HR and the EU Grant EAMNET to RP. MW was supported by the Center for Modeling and Simulation in the Biosciences (BIOMS) in Heidelberg. We declare that we have no competing financial interests. Note: During the preparation of the final manuscript, a study reporting an inhibition of ER-to-Golgi transport by statins, inhibitors of cholesterol-biosynthesis was published online (Ridsdale et al (2006) Mol Biol Cell; PMID: 16452637).
References
- Aridor M, Traub LM (2002) Cargo selection in vesicular transport: the making and breaking of a coat. Traffic 3: 537–546 [DOI] [PubMed] [Google Scholar]
- Balch WE, McCaffery JM, Plutner H, Farquhar MG (1994) Vesicular stomatitis virus glycoprotein is sorted and concentrated during export from the endoplasmic reticulum. Cell 76: 841–852 [DOI] [PubMed] [Google Scholar]
- Barlowe C (2003) Signals for COPII-dependent export from the ER: what's the ticket out? Trends Cell Biol 13: 295–300 [DOI] [PubMed] [Google Scholar]
- Ben-Tekaya H, Miura K, Pepperkok R, Hauri HP (2005) Live imaging of bidirectional traffic from the ERGIC. J Cell Sci 118: 357–367 [DOI] [PubMed] [Google Scholar]
- Bevis BJ, Hammond AT, Reinke CA, Glick BS (2002) De novo formation of transitional ER sites and Golgi structures in Pichia pastoris. Nat Cell Biol 4: 750–756 [DOI] [PubMed] [Google Scholar]
- Christian AE, Haynes MP, Phillips MC, Rothblat GH (1997) Use of cyclodextrins for manipulating cellular cholesterol content. J Lipid Res 38: 2264–2272 [PubMed] [Google Scholar]
- Colbeau A, Nachbaur J, Vignais PM (1971) Enzymatic characterization and lipid composition of rat liver subcellular membranes. Biochem Biophys Acta 249: 462–492 [DOI] [PubMed] [Google Scholar]
- DeBose-Boyd RA, Brown MS, Li WP, Nohturfft A, Goldstein JL, Espenshade PJ (1999) Transport-dependent proteolysis of SREBP: relocation of site-1 protease from Golgi to ER obviates the need for SREBP transport to Golgi. Cell 23: 703–712 [DOI] [PubMed] [Google Scholar]
- Espenshade PJ, Li WP, Yabe D (2002) Sterols block binding of COPII proteins to SCAP, thereby controlling SCAP sorting in ER. Proc Natl Acad Sci USA 99: 11694–11699 [DOI] [PMC free article] [PubMed] [Google Scholar]
- Forster R, Weiss M, Zimmermann T, Reynaud EG, Verissimo F, Pepperkok R (2006) Secretory cargo regulates the turnover of COPII subunits at single ER exit sites. Curr Biol 16: 173–179 [DOI] [PubMed] [Google Scholar]
- Goldstein JL, DeBose-Boyd RA, Brown MS (2006) Protein sensors for membrane sterols. Cell 124: 35–46 [DOI] [PubMed] [Google Scholar]
- Hammond AT, Glick BS (2000) Dynamics of transitional endoplasmic reticulum sites in vertebrate cells. Mol Biol Cell 11: 3013–3030 [DOI] [PMC free article] [PubMed] [Google Scholar]
- Heino S, Lusa S, Somerhaju P, Ehnholm C, Olkkonen VM, Ikonen E (2000) Dissecting the role of the golgi complex and lipid rafts in biosynthetic transport of cholesterol to the cell surface. Proc Natl Acad Sci USA 97: 8375–8380 [DOI] [PMC free article] [PubMed] [Google Scholar]
- Ho WC, Allan VJ, van Meer G, Berger EG, Kreis TE (1989) Reclustering of scattered Golgi elements occurs along microtubules. Eur J Cell Biol 48: 250–263 [PubMed] [Google Scholar]
- Keller P, Simons K (1998) Cholesterol is required for surface transport of influenza virus hemagglutinin. J Cell Biol 140: 1357–1367 [DOI] [PMC free article] [PubMed] [Google Scholar]
- Kilsdonk EP, Morel DW, Johnson WJ, Rothblat GH (1995a) Inhibition of cellular cholesterol efflux by 25-hydroxycholesterol. J Lipid Res 36: 505–516 [PubMed] [Google Scholar]
- Kilsdonk EP, Yancey PG, Stoudt GW, Bangerter FW, Johnson WJ, Phillips MC, Rothblat GH (1995b) Cellular cholesterol efflux mediated by cyclodextrins. J Biol Chem 270: 17250–17256 [DOI] [PubMed] [Google Scholar]
- Lange Y, Ye J, Rigney M, Steck T (1999) Regulation of endoplasmic reticulum cholesterol by plasma membrane cholesterol. J Lipid Res 40: 2264–2270 [PubMed] [Google Scholar]
- Lee MC, Orci L, Hamamoto S, Futai E, Ravazzola M, Schekman R (2005) Sar1p N-terminal helix initiates membrane curvature and completes the fission of a COPII vesicle. Cell 122: 605–617 [DOI] [PubMed] [Google Scholar]
- Malkus P, Jiang F, Schekman R (2002) Concentrative sorting of secretory cargo proteins into COPII-coated vesicles. J Cell Biol 159: 915–921 [DOI] [PMC free article] [PubMed] [Google Scholar]
- Martinez-Menarguez JA, Geuze HJ, Slot JW, Klumperman J (1999) Vesicular tubular clusters between the ER and Golgi mediate concentration of soluble secretory proteins by exclusion from COPI-coated vesicles. Cell 98: 81–90 [DOI] [PubMed] [Google Scholar]
- Matsuoka K, Orci L, Amherdt M, Bednarek SY, Hamamoto S, Schekman R, Yeung T (1998) COPII-coated vesicle formation reconstituted with purified coat proteins and chemically defined liposomes. Cell 93: 263–275 [DOI] [PubMed] [Google Scholar]
- Maxfield FR, Tabas I (2005) Role of cholesterol and lipid organization in disease. Nature 438: 612–621 [DOI] [PubMed] [Google Scholar]
- Mezzacasa A, Helenius A (2002) The transitional ER defines a boundary for quality control in the secretion of tsO45 VSV glycoprotein. Traffic 3: 833–849 [DOI] [PubMed] [Google Scholar]
- Miller E, Antonny B, Hamamoto S, Schekman R (2002) Cargo selection into COPII vesicles is driven by the Sec24p subunit. EMBO J 21: 6105–6113 [DOI] [PMC free article] [PubMed] [Google Scholar]
- Muniz M, Morsomme P, Riezman H (2001) Protein sorting upon exit from the endoplasmic reticulum. Cell 104: 313–320 [DOI] [PubMed] [Google Scholar]
- Nehls S, Snapp EL, Cole NB, Zaal KJ, Kenworthy AK, Roberts TH, Ellenberg J, Presley JF, Siggia E, Lippincott-Schwartz J (2000) Dynamics and retention of misfolded proteins in native ER membranes. Nat Cell Biol 2: 288–295 [DOI] [PubMed] [Google Scholar]
- Nohturfft A, Yabe D, Goldstein JL, Brown MS, Espenshade PJ (2000) Regulated step in cholesterol feedback localized to budding of SCAP from ER membranes. Cell 102: 315–323 [DOI] [PubMed] [Google Scholar]
- Paccaud JP, Reith W, Carpentier JL, Ravazzola M, Amherdt M, Schekman R, Orci L (1996) Cloning and functional characterization of mammalian homologues of the COPII component Sec23. Mol Biol Cell 7: 1535–1546 [DOI] [PMC free article] [PubMed] [Google Scholar]
- Pathre P, Shome K, Blumental-Perry A, Bielli A, Haney CJ, Alber S, Watkins SC, Romero G, Aridor M (2003) Activation of phospholipase D by the small GTPase Sar1p is required to support COPII assembly and ER export. EMBO J 22: 4059–4069 [DOI] [PMC free article] [PubMed] [Google Scholar]
- Presley JF, Cole NB, Schroer TA, Hirschberg K, Zaal KJ, Lippincott-Schwartz J (1997) ER-to-Golgi transport visualized in living cells. Nature 389: 81–85 [DOI] [PubMed] [Google Scholar]
- Ridsdale A, Denis M, Gougeon PY, Ngsee JK, Presley JF, Zha X (2006) Cholesterol is required for efficient ER-to-Golgi transport of secretory membrane proteins. Mol Biol Cell 17: 1593–1605 [DOI] [PMC free article] [PubMed] [Google Scholar]
- Scales SJ, Pepperkok R, Kreis TE (1997) Visualization of ER-to-Golgi transport in living cells reveals a sequential mode of action for COPII and COPI. Cell 90: 1137–1148 [DOI] [PubMed] [Google Scholar]
- Schweizer A, Fransen JA, Bachi T, Ginsel L, Hauri HP (1988) Identification, by a monoclonal antibody, of a 53-kD protein associated with a tubulo-vesicular compartment at the cis-side of the Golgi apparatus. J Cell Biol 107: 1643–1653 [DOI] [PMC free article] [PubMed] [Google Scholar]
- Simons K, Ikonen E (2000) How cells handle cholesterol. Science 290: 1721–1726 [DOI] [PubMed] [Google Scholar]
- Soderholm J, Bhattacharyya D, Strongin D, Markovitz V, Connerly PL, Reinke CA, Glick BS (2004) The transitional ER localization mechanism of Pichia pastoris Sec12. Dev Cell 6: 649–659 [DOI] [PubMed] [Google Scholar]
- Springer S, Schekman R (1998) Nucleation of COPII vesicular coat complex by endoplasmic reticulum to Golgi vesicle SNAREs. Science 281: 698–700 [DOI] [PubMed] [Google Scholar]
- Stephens DJ, Lin-Marq N, Pagano A, Pepperkok R, Paccaud JP (2000) COPI-coated ER-to-Golgi transport complexes segregate from COPII in close proximity to ER exit sites. J Cell Sci 113: 2177–2185 [DOI] [PubMed] [Google Scholar]
- Stephens DJ, Pepperkok R (2002) Imaging of procollagen transport reveals COPI-dependent cargo sorting during ER-to-Golgi transport in mammalian cells. J Cell Sci 115: 1149–1160 [DOI] [PubMed] [Google Scholar]
- Sun LP, Li L, Goldstein JL, Brown MS (2005) Insig required for sterol-mediated inhibition of SCAP/SREBP binding to COPII proteins in vitro. J Biol Chem 280: 26483–26490 [DOI] [PubMed] [Google Scholar]
- Wang Y, Thiele C, Huttner WB (2000) Cholesterol is required for the formation of regulated and constitutive secretory vesicles from the trans-Golgi network. Traffic 1: 952–962 [DOI] [PubMed] [Google Scholar]
- Watson P, Forster R, Palmer KJ, Pepperkok R, Stephens DJ (2005) Coupling of ER exit to microtubules through direct interaction of COPII with dynactin. Nat Cell Biol 7: 48–55 [DOI] [PMC free article] [PubMed] [Google Scholar]
- Yang T, Espenshade PJ, Wright ME, Yabe D, Gong Y, Aebersold R, Goldstein JL, Brown MS (2002) Crucial step in cholesterol homeostasis: sterols promote binding of SCAP to INSIG-1, a membrane protein that facilitates retention of SREBPs in ER. Cell 110: 489–500 [DOI] [PubMed] [Google Scholar]
Associated Data
This section collects any data citations, data availability statements, or supplementary materials included in this article.
Supplementary Materials
Supplementary Figure 1
Supplementary Figure 2
Supplementary Figure 3
Supplementary Figure 4
Supplementary Data
Supplementary Data
Supplementary Data
Supplementary Data
Supplementary Data