

Abstract
Tumor metastasis is a complex multi-step process normally involving dysregulation of multiple signal transduction pathways. In this study we developed a novel approach to efficiently define dysreguated pathways associated with metastasis by comparing global gene and protein expressions of two distinct metastasis-suppressed models. Consequently, we identified common features shared by the two models which are potentially associated with metastasis.
The efficiency of metastasis from the highly aggressive polyoma middle T-induced mouse mammary tumors was suppressed by either prolonged caffeine exposure or by breeding the animal to a low metastastic mouse strain. Molecular profiles of the primary tumors from both metastasis-suppressed classes were then derived to identify molecules and pathways that might underlie a common mechanism of metastasis. A number of differentially regulated genes and proteins were identified, including genes encoding basement membrane components, which were inversely related to metastatic efficiency. In addition, the analysis revealed that the Stat signal transduction pathways were potentially associated with metastasis inhibition, as demonstrated by enhanced Stat1 activation, and decreased Stat5 phosphorylation in both genetic and pharmacological modification models. Tumor cells of low-metastatic genotypes also demonstrated anti-apoptotic properties. The common changes of these pathways in all of the metastasis-suppressed systems suggest that they may be critical components in the metastatic cascade, at least in this model system. Our data demonstrate that analysis of common changes in genes and proteins in a metastatic-related context greatly decrease the complexity of data analysis, and may serve as a screening tool to identify biological important factors from large scale data.
Keywords: systems biology, biological association network, metastasis, signaling pathway, microarray, isotope-coded affinity tag
Introduction
The process of tumor dissemination or metastasis is of critical importance in the clinical management of cancer and the majority of cancer mortality is been associated with metastatic disease rather than the primary tumor (1). Reducing cancer mortality relies on two complimentary aspects: early diagnosis and prognosis of patients with metastatic disease, and development of effective chemotherapeutic drugs (2, 3). Since it has been estimated that 60–70% of patients have progressed to metastatic disease by the time of primary diagnosis (4), the ability to identify those patients with high likelihood of developing metastases prior to detectable secondary disease and enrolling them in metastasis-prevention regimens might significantly reduce the burden of secondary lesions. Definition of key regulatory components of the metastatic process could facilitate identification of patients that are predisposed to metastatic disease and enable the design of superior chemotherapeutic agents. However, identification of these components has proven extremely challenging. Part of the complexity may be that dysregulation of a variety of different cell signaling pathways acting in a variety of different combinations may produce remarkably similar phenotypes. Another confounding factor is likely to be genetic susceptibility to metastatic progression, i.e. genetic modulation of the efficiency of tumor dissemination, which has been shown to be an important regulatory factor both in vitro and in vivo (5).
Development of high throughput technologies including microarray and mass spectrometry-based proteomic analyses has enabled the use of global approaches to identify factors potentially regulating metastatic efficiency. Since these data-driven methods do not rely on a priori hypotheses regarding the biochemical nature of important genetic components in metastasis modulation, novel molecules and pathways whose function has not previously been associated with metastatic dissemination may be revealed. These systems approaches would also allow us to explore multiple pathways and networks that may have been altered in the metastasis process simultaneously, thus providing a much more complex understanding of metastasis, as compared to the traditional hypothesis-driven strategy targeting on one single gene or one pathway. However, the mass of information generated by genomic and proteomic analyses requires researchers to put tremendous effort into identifying the biologically critical information.
One method to reduce the complexity of such analyses is to use multiple experimental systems that share common phenotypes to discover relevant molecular processes and pathways. Like the use of haplotype mapping in genetic analysis to identify candidate genes that segregate with the trait of interest (6), the identification of biological systems that are coordinately modified or altered in related experimental models may enable the prioritization of those signaling pathways or molecules that may underlie critical central components of a process for subsequent studies.
In the current study, we tested this approach in a metastasis-related context, using models with enriched genetic factors that specifically influence tumor progression and metastasis. Previously, we have demonstrated that crossing the PyMT transgenic mouse with DBA/NJ mouse specifically suppresses metastatic progression of the mammary tumors with little or no alteration of other tumor phenotypes being measured. Similarly, chronic caffeine exposure has also been shown to suppress tumor metastasis specifically, rather than suppression of metastasis being the secondary result of significant suppression of tumor growth or initiation rates. Using these genetic- (6) and chemical-suppressed (7) metastatic tumor models, we identified genes and regulatory pathways that are concordantly regulated in the two distinct metastasis-suppressed models compared their. Based on our hypothesis, these molecules and pathways are more likely to be associated with metastatic progression than those modulated in only one of the systems. The preliminary results presented here suggest that regulation of Stat activation may be associated with metastasis inhibition. In addition, our data showed that activation/deactivation of the Akt pathway, the caspase-dependent apoptosis pathway, and the Ras signaling pathways can also be modulated by genetic modifications and caffeine exposure and thus may represent important molecular mechanisms to further investigate for their role in metastatic progression.
Materials and Methods
Materials
Ammonium biocarbonate (NH4HCO3), guanidine hydrochloride (Gdn·HCl), dibasic sodium phosphate (Na2HPO4), monobasic sodium phosphate (NaH2PO4), sodium chloride (NaCl), Tris, sodium fluoride (NaF), sodium orthovanadate (Na3VO4), Triton X-100 and phenylmethanesulfonyl fluoride (PMSF) were purchased from Sigma (St. Louis, MO). Trifluoroacetic acid (TFA) and formic acid were from Fluka (Milwaukee, WI). HPLC grade acetonitrile (CH3CN) was obtained from EM Science (Darmstadt, Germany). UltraLink™ immobilized monomeric avidin, Tris(2-carboxyethyl)phosphine hydrochloride (TCEP·HCl), ImmunoPure D-biotin, and bicinchonic acid (BCA) protein assay reagent kit were purchased from Pierce (Rockford, IL). Water was purified by a Barnstead Nanopure system (Dubuque, IA).
Animals and tumor samples
To generate genetically suppressed low metastatic mammary tumors, we crossed two inbred strains, [FVB/N-TgN(MMTV-PyVT)634Mul × inbred (DBA/2J or NZB/B1NJ)]. High metastatic FVB F1 transgenic mice were generated by crossing inbred FVB/N-TgN(MMTV-PyVT)634Mul × FVB/NJ. Each F1 animal has received one whole chromosome from each parent, therefore all of the F1 animals in each group are genetically identical and are thus not segregating different collections of parental DNA. DBA and NZB F1 hybrids have a significantly lower metastatic capacity (REF) than FVB F1 mice. Chemically suppressed low metastatic models were generated by giving FVB F1 progeny caffeine commencing at weaning or at age of 60 days (after the formation of frank mammary tumors) as previously described (7). Metastatic capacities of the trangenic mice were suppressed by 30–50% with caffeine exposure. The metastatic models used in the current study are outlined in Table 1. Mammary tumors were collected from virgin female transgene positive FVB, DBA and NZB F1 progeny, and FVB F1 exposed to caffeineor from (Table 1),. All animals were handled according to Policy on Humane Care and Use of Laboratory Animals (http://grants/grants/olaw/references/phspol.htm.)
Table 1.
Description of animal models in the current study.
| Phenotype | High-metastasis phenotype | Low-metastasis phenotype | |||
|---|---|---|---|---|---|
| Group | Control | Caffeine21 | Caffeine60 | DBA | NZB |
| Modification | None | Pharmacological | Pharmacological | Genetic variation | Genetic variation |
| Genetic background | FVB/NJ homozygous | FVB/NJ homozygous | FVB/NJ homozygous | DBA/2J × FVB/NJ | NZB/B1NJ × FVB/NJ |
| Transgene | PyMT | PyMT | PyMT | PyMT | PyMT |
| Treatment | None | Caffeine exposure starting from weaning to 100 days of age | Caffeine exposure starting from 60 days of age to 100 days of age | None | None |
Affymetrix microarray
To generate transcriptional profiles of the F1 hybrid tumor samples, Affymetrix microarray analyses were performed as previously described (7). Affymetrix data for the caffeine samples was generated in a previous study (7). Briefly, mRNA (one mRNA sample per mouse, three mouse per group) was extracted from mammary tumors to synthesize cDNA, followed by in vitro transcription to generate labeled cRNA. Fragmented cRNA was hybridized to Affymetrix Murine Genome MOE430 A and B GeneChip® Arrays, and analyzed on an Affymetrix GeneChip 3000 scanner (Affymetrix) with Affymetrix Microarray Suite version 5.0.0.032 software (Affymetrix) and BRB ArrayTools v 3.2.0 (http://linus.nci.nih.gov/BRB-ArrayTools.html).
Microarray data analysis
The .CEL files generated by Affymetrix Microarray Suite version 5.0.0.032 were processed using the RMA function of the BRB-ArrayTools ver 3.2.0. Normalization and statistical analysis were performed using the BRB-Array Tools (8, 9). Genes whose expression differed by at least 1.25 fold from the median in at least 25% of the arrays were retained. To identify gene transcripts that were differentially regulated between the high and low metastatic tumors, we used a multivariate permutation test (10, 11) to compare the gene expression profiles from the two different phenotypes. The non-parametric multivariate permutation test was performed to provide 90% confidence that the false discovery rate was less than 10%. The test statistics used are random variance t-statistics for each gene (12). Genes were considered statistically significant if their p value was less than 0.001 and with a fold change over 1.5-fold.
Protein extraction for cleavable isotope-coded affinity tag (cICAT) analysis
ICAT analysis was used to reveal global protein expression regulation by DBA/NJ genome and caffeine exposure starting from 60 days of age. Protein was extracted from mammary tumors (3 samples per group) of control FVB/NJ F1 mice, FVB/NJ F1 mice receiving caffeine at 60 days of age and DBA/2J F1 mice. Mammary tumors (~100 mg) were pulverized and homogenized in lysis buffer (50 mM Tris-HCl (pH 7.2), 1% Triton X-100, 10 mM NaF and 1 mM Na3VO4, 1mM EDTA). Tissue lysates were passed through a 26G needle, dounced with a douncer homogenizer, and centrifuged at 14,000× g to remove any pellets. The supernatant was collected and desalted into 50 mM NH4HCO3, pH 8.3 using a D-Salt Excellulose plastic desalting column (Pierce, Rockford, IL). Protein concentrations were determined using the BCA assay. Protein samples for each treatment group were then pooled to produce uniform samples containing 800 μg protein, and subsequently lyophilized and stored at −80°C prior to cICAT labeling.
cICAT labeling
Protein samples for the cICAT experiment were labeled as follows. Eight hundred microgram protein from each group was labeled with the light (cICAT-13C0) or the heavy (cICAT-13C9) isotopic version of the ICAT reagent (ABI, Framingham, MA), using a modified protocol from that recommended by the manufacturer (13). Briefly, each sample was dissolved in 640 μl of 6 M Gdn·HCl in 50 mM NH4HCO3, pH 8.3, and then reduced by adding 8 μl of 100 mM TCEP·HCl followed by boiling in a water bath for 10 min. The reduced samples were transferred to separate vials containing either cICAT-13C0 or cICAT-13C9 dissolved in 20 μl of CH3CN and incubated at 37 °C for 2 h. The two samples were combined, buffer exchanged into 50 mM NH4HCO3, pH 8.3, using a D-Salt Excellulose plastic desalting column (Pierce, Rockford, IL) and digested with trypsin (Promega, Madison, WI) overnight at 37 °C using an enzyme to protein ratio of 1:50 (w/w). Trypsin digestion was quenched by boiling the samples in a water bath for 10 min and adding PMSF to a final concentration of 1 mM.
Affinity purification and cleaving of cICAT-labeled peptides
cICAT labeled molecules were purified for further analysis by the following protocol. A 1.5 ml bed volume UltraLink immobilized monomeric avidin column was slurry packed in a glass Pasteur pipet and equilibrated with 2× PBS (0.2 M sodium phosphate, 0.3 M NaCl, pH 7.2). The column was blocked with 2 mM D-biotin in 2× PBS, pH 7.2. Biotin was stripped from the reversible binding sites of the column as per the manufacturer’s instruction, and the column was re-equilibrated with 2× PBS, pH 7.2. Samples containing the cICAT-labeled peptides were boiled for 5 min, cooled to room temperature, and loaded onto an avidin column and allowed to incubate for 15 min at ambient temperature. After column washing with 2× PBS, pH 7.2, 1× PBS, pH 7.2, and 50 mM NH4HCO3/20% CH3CN, pH 8.3, cICAT-labeled peptides were eluted using 30% CH3CN/0.4% formic acid and lyophilized to dryness. The biotin moiety was cleaved from the cICAT-labeled peptides by treatment with cleaving reagents provided by the manufacturer for 2 h at 37 °C, and lyophilized to dryness.
Strong Cation Exchange Liquid Chromatographic (SCXLC) Fractionation
Fractionation of the labeled peptides for analysis was perfored as follows. The cICAT-labeled peptides were dissolved in 25% CH3CN and 0.1% TFA, and loaded onto a 1 mm i.d. × 150 mm SCXLC column (PolyLC, Columbia, MD) which had been pre-equilibrated with 25% CH3CN delivered by an Agilent 1100 capillary LC system (Agilent Technologies, Paolo Alto, CA). Peptides were eluted by a gradient generated from mobile phase A (25% acetonitrile in water) and mobile phase B (25% acetonitrile with 0.5 M ammonium formate, pH 3) over 96 min. Ninety-six fractions were collected for μLC-MS/MS analysis.
Reversed-phase μLC-MS/MS of SCX Fractions
A 10 cm long 75 qm i.d μRPLC-electrospray ionization (ESI) column was coupled online with an ion-trap (IT) MS (LCQ Deca XP, Thermo Finnigan, San Jose, CA) to analyze each SCXLC fraction (13). Columns were connected via a stainless steel union to an Agilent 1100 capillary LC system (Agilent Technologies, Paolo Alto, CA), which was used to deliver mobile phases A (0.1% formic acid in water) and B (0.1% formic acid in CH3CN). After loading 6 ql of sample, cICAT-labeled peptides were eluted at a flow rate of ~400 nl/min using a linear step gradient of 2%–40% B for 110 min and 40%–98% B for 30 min. The IT-MS was operated in a data-dependent MS/MS mode using a normalized collision-induced dissociation (CID) energy of 35%. Capillary voltage and temperature of the ion source were set at 10 V and 180 °C, respectively.
Peptide identification and quantification
To identify peptides the raw MS/MS data acquired on the IT-MS were searched using SEQUEST (ThermoElectron, San Jose, CA) against a mouse proteome database (27,612 entries) downloaded from the European Bioinformatics Institute (http://www.ebi.ac.uk/proteome/index.html). Dynamic modifications for cysteinyl (Cys) residues were set by mass additions of cleaved cICAT labels (227.13 Da for the light label, 236.16 Da for the heavy label) in a single search. SEQUEST criteria were set as Xcorr ≥ 1.9 for [M+H]1+ ions, ≥ 2.2 for [M+2H]2+ ions and ≥ 2.9 for [M+3H]3+ ions, and DeltaCn ≥ 0.08 for the identification of fully tryptic peptides within the cICAT-labeled samples. Identified peptides were quantified using XPRESS (ThermoElectron, San Jose, CA), which calculates the relative abundance (13C9/13C0, in this data set) of peptides based on the area of their extracted ion chromatograms. The distribution of logarithms of protein abundance ratio between both the caffeine-treated and constitutively low metastatic potential groups and the high metastatic potential FVB/NJ control group showed a bell-shaped distribution, permitting standard statistical analysis. Proteins with an abundance ratio of less than 0.67 or greater than 1.5 were considered to be differentially expressed in this study.
Biological association network
Changes in gene/protein expression are not isolated events, especially for those playing important roles in a biological process. Instead, those changes may be caused by or would result in changes in a whole array of genes and proteins interacting with the key factors. Therefore, we hypothesize, differentially regulated genes/proteins that are interacted with many other differentially expressed genes/proteins may be more likely to play crucial roles in metastatic progress. To identify those key factors, we explored the biological associations among the differentially regulated proteins and genes identified by microarray and ICAT assays using PathwayAssist (Stratagene). Differentially regulated genes or proteins identified by microarray analysis or ICAT assay were uploaded into PathwayAssist. Integration of genes and proteins into biological association networks was performed based on gene and protein interactions documented in ResNet 2.5 database (Statagene). ResNet database is a comprehensive pathway database which contains more than 500,000 events of regulation, interaction and modification among thousands of proteins, cell processes and small molecules automatically extracted from scientific literature. Common downstream targets or upstream regulators of multiple proteins were also identified by using this software, which facilitated the process of selecting key factors and potential mechanisms from the large number of differentially regulated genes and proteins.
Western Blot
To confirm the results of the cICAT experiment and to further explore how pathways of interest identified by using PathwayAssist were regulated by various experimental conditions, Western blots were performed to examine the expression of protein and pathways of interest. Tumor samples (3 per group) were homogenized in T-PER Tissue Protein Extraction Reagent (Pierce Biotechnology, Inc.) with Halt Protease Inhibitor Cocktail (Pierce Biotechnology, Inc.) Protein concentrations were determined by the BCA assay (Pierce Biotechnology, Inc.). Pooled protein samples were separated on SDS-PAGE pre-cast gels (Invitrogen Corp., Carlsbad, CA) then transferred to Immobilon-P membranes (Millipore). Western blotting was performed as previously described (14). The presence of the antigen was detected using an ECL-Plus Kit (Amersham) as per the manufacturer’s protocol. Quantification of protein signals was performed using ImageQuant QL (Amersham). GAPDH was used as a loading control. Differentially expressed proteins were further confirmed by Western blot quantification analysis of three samples per group.
Correlation coefficient calculation and validation
To correlate mRNA abundance to protein abundance for whole datasets, pearson correlation coefficients were calculated using R-package (www.r-project.org) for log transformed data in each pair of the microarray datasets (i.e. Caffeine21/Control vs. Caffeine 60/Control; DBA/Control vs Caffeine60/Control; DBA/Control vs Caffeine60/Control; figure 1).
Figure 1.

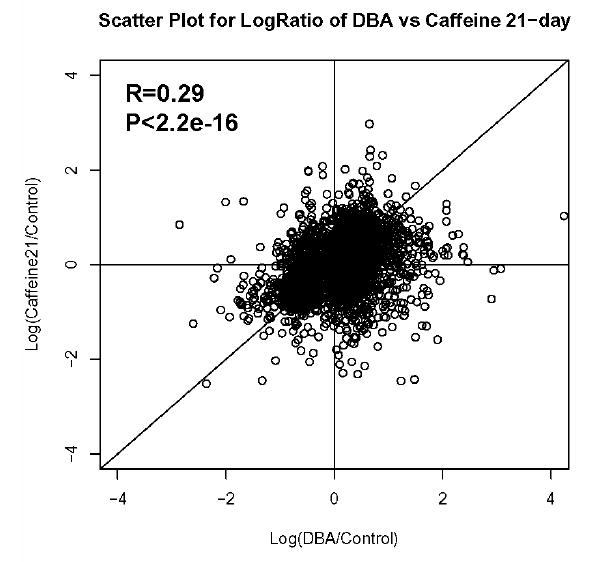
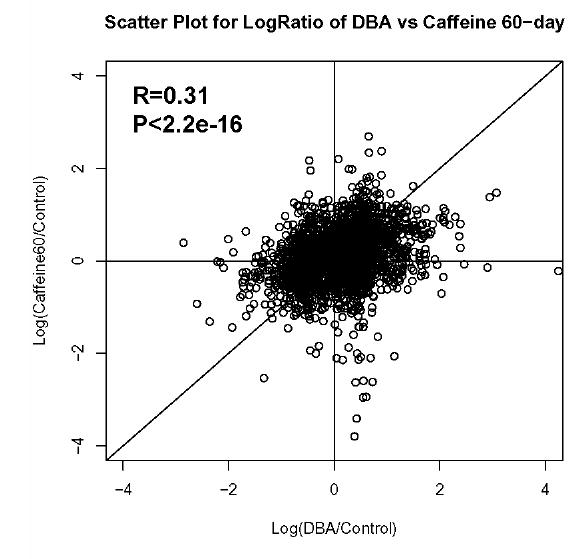
Correlation of gene expression between the different metastasis suppressed samples. The R value and P value of the correlation between each set of samples is indicated in the upper left of the figure. A. Caffeine-21 versus Caffeine-60 samples. B. DBA versus Caffeine-21 samples. C. DBA versus Caffeine-60 samples.
To correlate mRNA abundance to protein abundance in individual pathway scope, pathway-scope correlation coefficients were calculated for each pathway from Biocarta collection (www.biocarta.com), or each GO (Gene Ontology) term-associated group (Biological Processes, www.geneontology.org), which has at least 3 genes that have valid data in the dataset pairs for calculation. Briefly, genes and their associated data from the whole datasets are sorted into subgroups based on whether they belong to individual pathways or GO groups by using a pathway-based analysis software package developed in Advanced Biomedical Computing Center, National Cancer Institute and SAIC-Frederick (http://www.abcc.ncifcrf.gov/wps/wps_index.php). Then, the correlation coefficients for genes in each pathway or GO group that have at least 3 genes with valid data in the dataset pairs (DBA/Control vs Caffeine60/Control; DBA/Control vs Caffeine21/Control; Table 3) are calculated as a batch using R-package with Pearson method (genes with missing values in one of the dataset pairs were not put into calculation for correlation coefficients). The results are parsed and put into a tabular format for representation purpose. The statistical significance of the results was validated using permutation analysis. Briefly, the permutation analysis is done with a written utility program for permutation of the data and R-package for statistical calculation of correlation coefficients for data in each permutated data files. To obtain permutated correlation coefficients for each candidate pathways or GO groups to be validated, each gene and its data in the pathway or GO group is shuffled randomly within the data pool of the corresponding dataset to generate a permutated file with the same number of genes as in the original file but with permutated data. This process is iterated for 1000 times to generate 1000 permutated file for each intended pathway or GO group. Then correlation coefficients for each permutated data file were calculated using R-package with Pearson method similarly as described as above.
Table 3.
Functional groups of genes with high mRNA expression ratio correlation coefficients resulting from genetic variation and caffeine exposure.
| Correlation Coefficient | P Value | Degree of freedom | Functional groups * |
|---|---|---|---|
| DBA/Control vs. Caffeine60/Control | |||
| 0.98 | 0.003 | 3 | cell cycle arrest |
| 0.92 | 0.003 | 5 | skeletal development |
| 0.90 | 0.04 | 3 | anti-apoptosis |
| 0.85 | 0.015 | 5 | negative regulation of transcription from Pol II promoters |
| 0.81 | 0.015 | 6 | protein amino acid dephosphorylation |
| DBA/Control vs. Caffeine21/Control | |||
| 0.99 | 0.0002 | 4 | negative regulation of transcription from Pol II promoters |
| 0.71 | 0.0003 | 19 | apoptosis |
| 0.78 | 0.012 | 7 | transcription |
Functional groups are defined by the Gene Ontology
Clustering analysis
To demonstrate the similarity of protein expression pattern in the pathways examined among the various models, clustering analysis of the relative protein expression based on Western blot results of proteins in the Caspase-dependent apoptosis pathway, the Stats signaling pathway, and the Akt pathway was performed using BRB ArrayTools 3.2. Briefly, the relative protein expression data were imported into BRB ArrayTools. Unsupervised hierarchical clustering was performed using average linkage and centered correlation. The R (reproducibility) measure described in (15) was used to evaluate the robustness of the clusters.
Results
Identification of genes associated with low metastatic phenotype. The complexity of the metastatic process suggests that there are many different molecules and pathways that may be involved. This complexity, expressed in both the tumor epithelium and surrounding normal tissues make the ability to identify key pathways and molecules extremely difficult. To attempt to gain a better understanding of critical metastatic pathways, in this study we attempted to identify concordantly regulated elements in the primary tumors in multiple metastasis-suppressed models, based on the hypothesis that common pathways are more likely to be important to the metastatic process than pathways modulated in only a subset of experimental systems.
This rationale was applied to model systems with low metastatic capacity achieved via genetic and pharmacological modifications as compared to the original high metastatic model. Previously we demonstrated that predisposition to tumor dissemination is significantly influenced by genetic background (6), and can be modified by pharmacological intervention, such as exposure to caffeine (7). Prolonged exposure to caffeine, starting from weaning or from 60 days of age significantly decreased lung metastases in the PyMT transgenic mouse by 55% and 31% respectively, while introduction of the DBA/2J genome by breeding suppressed metastases by 90% (Table 1). Work from other labs has demonstrated that gene expression patterns of the primary tumors are able to predict metastatic capacity and chemotherapeutic efficiency both in animal models and in clinical trials (16–19). To identify genes that were transcriptionally responsive to caffeine treatment, and were differentially regulated as a consequence of hereditary variations, gene expression patterns of the genetically or chemically modified primary tumors were analyzed using Affymetrix microarray. Genes that were coordinately up- or down-regulated in low metastatic samples (i.e. caffeine-treated groups, and DBA/2J F1 mice) as compared to the high metastatic phenotype (i.e. FVB/NJ homozygous mice) were identified. Sixty-three genes showed a greater than 1.5-fold difference (P < 0.001) at the mRNA expression level (Table 2), with the majority of genes (54/63) being up-regulated in the low-metastatic tumor-bearing mice. Differential expressions of a number (N =11) of these genes were validated by real-time PCR and have been reported previously (7).
Table 2.
Differentially expressed genes of known functions (P = 0.001) between high- and low-metastatic tumors determined using Affymetrix array.
| Probe set | Gene symbol* | Expression ratio (low-/high-metastatic groups | Description |
|---|---|---|---|
| 1450637_a_at | Aebp1 | 1.59 | AE binding protein 1 |
| 1446481_at | Apbb2 | 1.50 | amyloid beta (A4) precursor protein-binding, family B, member 2 |
| 1429012_at | Arhgef6 | 1.51 | Rac/Cdc42 guanine nucleotide exchange factor (GEF) 6 |
| 1449130_at | Cd1d1 | 0.57 | CD1d1 antigen |
| 1448755_at | Col15a1 | 1.69 | procollagen, type XV |
| 1450625_at | Col5a2 | 1.77 | procollagen, type V, alpha 2 |
| 1424131_at | Col6a3 | 1.90 | procollagen, type VI, alpha 3 |
| 1421276_a_at | Dst | 1.55 | dystonin |
| 1451691_at | Ednra | 2.22 | endothelin receptor type A |
| 1438686_at | Eif4g1 | 0.56 | eukaryotic translation initiation factor 4, gamma 1 |
| 1460208_at | Fbn1 | 2.16 | fibrillin 1 |
| 1416221_at | Fstl1 | 2.15 | follistatin-like 1 |
| 1418526_at | Fusip1 | 0.66 | FUS interacting protein (serine-arginine rich) 1 |
| 1426114_at | Hnrpab | 0.61 | heterogeneous nuclear ribonucleoprotein A/B |
| 1458161_at | Kcnq1ot1 | 1.55 | KCNQ1 overlapping transcript 1 |
| 1431004_at | Loxl2 | 1.52 | lysyl oxidase-like 2 |
| 1436714_at | Lpp | 1.51 | LIM domain containing preferred translocation partner in lipoma |
| 1448655_at | Lrp1 | 1.79 | low density lipoprotein receptor-related protein 1 |
| 1446240_at | Map2k5 | 1.59 | mitogen activated protein kinase kinase 5 |
| 1434178_at | Mll3 | 1.50 | myeloid/lymphoid or mixed-lineage leukemia 3 |
| 1439364_a_at | Mmp2 | 1.89 | matrix metalloproteinase 2 |
| 1437165_a_at | Pcolce | 1.83 | procollagen C-proteinase enhancer protein |
| 1436970_a_at | Pdgfrb | 1.63 | platelet derived growth factor receptor, beta polypeptide |
| 1428896_at | Pdgfrl | 1.72 | platelet-derived growth factor receptor-like |
| 1423606_at | Postn | 1.76 | periostin, osteoblast specific factor |
| 1420747_at | Ppnr | 1.96 | per-pentamer repeat gene |
| 1444828_at | Ppp2r5c | 1.52 | protein phosphatase 2, regulatory subunit B (B56), gamma isoform |
| 1441140_at | Rere | 1.54 | RIKEN cDNA E230012J19 gene |
| 1457177_at | Rora | 1.65 | RAR-related orphan receptor alpha |
| 1426386_at | Rpl7l1 | 0.65 | ribosomal protein L7-like 1 |
| 1416589_at | Sparc | 1.71 | secreted acidic cysteine rich glycoprotein |
| 1426164_a_at | Usf1 | 0.61 | upstream transcription factor 1 |
Gene symbols in bold are the genes being differentially expressed between lymphatic infitration negative and positive human breast cancers.
Analysis of the GO assignments revealed that transcripts in extracellular matrix (ECM) remodeling, regulation of protein metabolism, and calcium ion-binding categories were over-represented in differentially expressed genes. Most significantly, enrichment of mRNA expression of basement membrane components was evident in low metastasis tumors, with a number of basement membrane-related transcripts being over-expressed, including Col5a2, Col6a3, Col15a1, Mmp2, Sparc, and Fbn1. Clinical studies have shown that all these genes are significantly up-regulated in the lymphocytic infiltrate negative compared to lymphocytic infiltrate positive breast cancers, and in Grade 1 compared to Grade 3 breast cancers (16). Other basement membrane components such as COL1A1 and COL1A2 have been proposed as metastatic predictors (20). This coincidence suggests that this class of genes may be of prognostic value for metastatic disease. Our data corroborated earlier studies, and suggested that ECM composition may play a significant role in modulating tumor metastasis (21, 22).
Correlation analysis of the gene expression patterns resulting from caffeine exposure and hereditary variation. To gain an overview of the similarities in gene expression between caffeine treatment and genetic variation that modulate metastatic efficacy, pairwise comparisons of the gene expression profiles resulting from caffeine exposure or genetic variation were performed using the Pearson correlation coefficient (r, figure 1). The gene expression profiles from mice exposed to caffeine beginning at weaning and at 60 days of age showed a positive correlation (r = 0.55, P < 2.2e-16), indicating similar transcriptional regulation events occurring in both models. Positive correlations were also observed between the expression profiles from the DBA/2J F1 group and the two caffeine treatment groups (figure 1), indicating that mechanisms by which hereditary factors influence metastatic efficiency may be similar to the mechanisms by which caffeine decreases tumor dissemination.
To identify underlying pathways, analysis of the GO assignments was performed to determine those functionalities showing high correlation in the low metastasis groups. Functional groups with strong correlations (r > 0.7) were shown in Table 3. Of particular interest was the finding that genes regulating protein dephosphorylation were overexpressed in both DBA/2J F1 mice and mice receiving caffeine from 60 days of age. These genes included dual specificity phosphatase 1, dual specificity phosphatase 4, phosphatidic acid phosphatase type 2A, protein tyrosine phosphatase gamma, and protein phosphatase 1A. Up-regulation of these genes was validated by quantitative RT-PCR (data not shown). Considering the importance of protein phosphorylation in signaling transduction pathways, we hypothesize that those genes may be potential targets or effectors in metastasis suppression although comprehensive functional genomics analyses are required to explicitly define the roles of these genes in metastasis inhibition.
Mammary tumor proteome
Since metastatic suppression is likely modulated at both the transcriptional and post-transcriptional levels, high throughput proteomics analysis was also performed on the caffeine- and genotype-suppressed samples. Using ICAT analysis, a method for large scale protein identification and quantification, we identified 2295 unique proteins (~8% of the proteins currently predicted to be encoded by the mouse genome) presented in mouse primary tumors and determined their relative abundance in response to caffeine exposure or genetic modification by DBA/2J genome (shown in Supplementary Materials). We have chosen to highlight proteins with an altered abundance ratio of greater than 1.5-fold, and designated these proteins as differentially regulated. Based on this criterion, we found that caffeine treatment altered the expression of 411 proteins, while DBA/2J genome changed the expression of 433 proteins. Multiple proteins were found consistently regulated in both models, including Mif, A2m, Gas6, Dpysl3, Azgp1, Vps35, Mell1, Flj10305, Ndrg1, Sfn, Farsl, Ckm, Bdh, and Pls3 (Supplementary Materials). ICAT data were validated by results from Western blot in which the expression of several proteins including H-Ras, Cdc42 were determined (data not shown).
Biological Association Network (BAN) analysis
To gain an overview of the interactions among differentially regulated genes and proteins, and to prioritize genes, proteins and pathways for further evaluation, we used PathwayAssist to explore and demonstrate associations among differentially regulated genes and proteins based on the available knowledge about eukaryotic molecular interactions documented in ResNet database. From the 63 genes which were differentially expressed at the mRNA level between low and high metastatic groups, direct interactions were observed between 2 nodes (Sparc and Mmp2). Both of these nodes are ECM components that participate in modification of cell morphology, cell motility, and cell invasion. Many studies (23, 24) have demonstrated these two genes are co-expressed and are associated with metastasis. The up-regulation of the two genes is consistent with the positive regulation of Mmp2 by Sparc. In addition, up-regulation of Sparc was observed in DBA F1 hybrid at both mRNA and protein level, therefore supporting the up-regulation of Mmp2 expression by Sparc.
Genes differentially expressed at the protein level were selected for BAN analysis based on two criteria of different stringency: 1) to determine possible pathways and protein interactions perturbed by genetic variation or caffeine intervention, all of the proteins whose expression changed by 1.5-fold were incorporated into association networks (“broad network”, Figure 2A and 2B); 2) to identify perturbed protein interactions with a higher degree of confidence, we constructed BANs by integrating proteins with abundance ratios > 1.5 or < 0.67, with multiple unique peptides identified, and with a coefficient variation < 0.6. Subsequently, we identified downstream molecular processes in order to determine if common molecular mechanisms were present. The resulting association networks (“focus network”) are shown in Figure 3A and 3B. A protein complex containing Rhoa, Cdc42, Prkca, and Arf1, all of which involved in Ras signaling pathway, was found to be modulated by both caffeine treatment and DBA/2J genome. Caffeine increased the expression of Cdc42 and Prkca and the introduction of the DBA/2J genome increased the expression of RhoA and decreased that of Arf1. These results implied that the Ras-related signaling pathways appeared to be of great importance in these model systems. In addition, a core interaction network revolving around H-Ras, Grb2, and Egfr (shown in Figure 3) was identified in mice treated with caffeine at the age of 60 days, with the majority of proteins in the network participating in the regulation of Akt phosphorylation or/and cell proliferation. Since the Akt signaling pathway is part of active oncogenic pathways initiated by the PyMT antigen (25), the effect of caffeine on this pathway may be related to its inhibition of tumor dissemination. Similarly, the association network assembled from proteins differentially regulated by DBA/2J allele shows that activation of Stat proteins and apoptosis pathways may be potentially related to its metastatic suppression mechanism. Overall, visualization of the interactions among the differentially regulated proteins allows us to screening for proteins centering the biological association networks and to identify their downstream and upstream effectors. However, due to the complexity and the context-dependent nature of protein interactions, the consequence of the differentially regulated pathways following a specific treatment remains to be clarified in the current system.
Figure 2.


The “broad” biological association networks integrated from differentially expressed proteins with relative abundance ratio (perturbed/Control) of >1.5 or <0.67. The protein complex containing Rhoa, Cdc42, Prkca, and Arf1, was highlighted inside a purple circle. A. Network resulting from caffeine treatment starting from 60 days of age. B. Network resulting from genetic variation present in DBA/2J F1 mice. Protein expression ratios are indicated by node color. Red: low-metastatic/high-metastatic > 1.5; Green: low-metastatic/high-metastatic < 0.67. The modes of interactions among the proteins were listed in the legend. Positive association and negative associations were indicated as “+” or “−” sign inside the interaction nodes.
Figure 3.

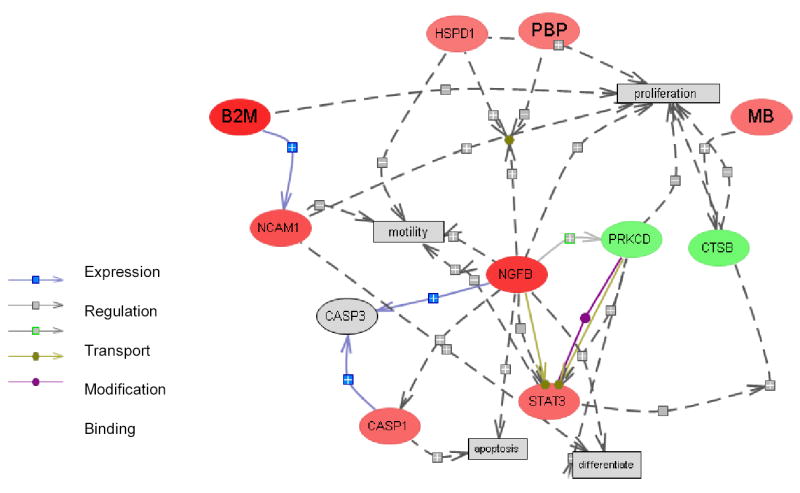
The “focus” biological association networks constructed using differentially regulated proteins with abundance ratio (perturbed/Control) > 1.5 or <0.67, with multiple unique peptides identified, and with a coefficient of variation < 0.6 were included. A. Network modified by caffeine treatment starting from 60 days of age. Two molecular processes, Akt phosphorylation and cell proliferation, were identified as downstream of multiple proteins in the network. B. Network modified by genetic variation present in DBA/2J F1 mice. Protein expression ratios are indicated by node color. Red: low-metastatic/high-metastatic > 1.5; Green: low-metastatic/high-metastatic < 0.67; Gray: ratio not determined or not considered to be different. The modes of interactions among the proteins were listed in the legend. Positive association and negative associations were indicated as “+” or “−” sign inside the interaction nodes.
Biological association analysis suggests that the Ras, Akt, caspase-dependent apoptosis pathway and Stat signaling pathways were differentially regulated by caffeine treatment and/or the DBA/2J genome presence. In light of the finding that a number of protein phosphatases were differentially regulated, we hypothesized that the effect of caffeine and DBA/2J allele may involve dephosphorylation of the proteins in these pathways. Using Western blot analyses, we examined the expression and phosphorylation status of key components in each of the four pathways. Two additional sample groups, samples from NZB/B1NJ F1 and FVB/NJ mice receiving caffeine at weaning, were included in the analyses, to gain higher confidence in identifying metastasis-related pathways that were common to multiple systems. Similar to DBA/2J F1, F1 hybrids between PyMT and NZB/B1NJ also suppress metastatic involvement approximately 10-fold compared to the FVB/NJ homozygous animals, without altering tumor latency or burden (26). The response profiles and a non-supervised hierarchical clustering analysis result based on these response profiles are shown in Figures 4 and 5, respectively. We observed differential regulation of all pathways examined (Stat, Akt, caspase-dependent pathways), however, the response profiles of the four low metastatic groups were similar only in Stat signaling pathways. Based on our hypothesis, Stat signaling pathways are more likely to be important in metastasis control in the current system, therefore will be discussed in detail. In addition, the non-supervised clustering analysis showed that the protein expression profiles in the Stat, Akt, and caspase-dependent pathways can segregate tumor samples according to their metastatic efficacies.
Figure 4.


Response profiles of the Akt, caspase-dependent apoptosis, and Stat signaling pathways to caffeine treatments and genetic variations. The expression of the proteins in the Akt pathway (A1 and A2), caspase-dependent apoptosis pathway (B1 and B2), and Stats signaling pathway (C1 and C2) were determined using Western blot. The signal intensity of the target proteins was normalized against the signal intensity of GAPDH. Significant effects of caffeine exposure and genetic variations were observed in all 3 pathways. The relative abundance of protein expression (Perturbed/Control) in each pathway was plotted to provide an overview in the similarity of genetic and drug modifications on each pathway. The profiles of all 4 groups are similar in Stats signaling pathway (C2), however, inconsistent in the Akt pathway (A2) and caspase-dependent apoptosis pathway (B2). The metastatic phenotype of each group is indicated as H (high) or L (low).
Figure 5.

Unsupervised clustering analysis of response profiles to caffeine treatment and genetic variation based on the three pathways examined, including the Akt pathway, caspase-dependent apoptosis pathway and the Stats signaling pathway. CAFF21: caffeine treatment starting from weaning; CAFF60: Caffeine treatment starting from age of 60 days.
Stat signaling pathways
ICAT data showed that Stat3 and Stat6 were up-regulated in DBA/2J F1 hybrid. Stat3 was also observed to be a key node in the biological association network (Figure 3). Therefore, we decided to investigate the response of Stats proteins to caffeine exposure and constitutional genetic variation. As shown in Figure 4C, the effects of caffeine treatment and genetic background on Stat1, Stat3, Stat5, and Stat6 activation were consistent with the exception of the effect of caffeine60 on Stat1 activation. Enhanced phosphorylation of Stat1 and Stat6, and decreased phosphorylation of Stat5 were observed across a majority of the samples.
In addition, no or weak correlations have been observed between global gene and protein expressions (data not shown). BAN analysis using both differentially regulated genes and proteins failed to detect pathways being affected at both transcriptional and translational levels. These data indicate that the transcriptional and translation profiling reveal complimentary but overlapping mechanisms on metastasis regulation in the current model.
Discussion
Tumor metastasis is a complex process, normally involving dysregulation of multiple signal transduction pathways. Attempts to reveal the identities of such pathways are greatly hindered by cell complexity and likelihood that abnormal signaling of multiple pathways produced remarkably similar phenotypes. In an attempt to efficiently clarify pathways that play an integral role in the process of metastasis, we used different conditions to suppress pulmonary metastasis of PyMT-induced mammary tumors followed by gene and protein profiling of mammary tumors and pathway analysis to identify commonly altered molecules and pathways that were more likely to play central roles in changing the metastatic capacity of the primary tumor cells. The study of molecular responses to metastasis suppression that results as a consequence of genetic variation and/or caffeine exposure serves to illustrate at least three important purposes: 1) most importantly, to facilitate the identification of metastasis-associated molecules and molecular pathways; 2) to reveal non-specific (metastasis-irrelevant) targets of caffeine and genetic polymorphisms; 3) to provide information on large scale comparisons of the transcriptome and proteome. Our data demonstrate that analysis of common changes in genes and proteins in a metastatic-related context greatly decrease the complexity of data analysis and allow us to better visualize potential molecular pathways related to metastatic progression. Such a strategy could also be applied to identify other disease-associated or biochemical activity-targeted molecular processes or pathways.
Using such a strategy, we identified 63 differentially regulated genes in low-metastatic potential DBA/2J F1 hybrids and caffeine-treated mice. Up-regulation of multiple genes encoding basement membranes components, including Col5a2, Col6a3, Col15a1, Fbn1, Lrpa, MMp2, and Sparc, strongly indicates that basement membrane remodeling plays an important role in suppressing metastasis in the models studied. Basement membranes provide barriers inhibiting successful invasion. Epithelial tumors must first infiltrate their own basement membranes and locally invade the adjacent stroma before disseminating to the lymphatic or circulatory system to reach distant sites. Several of these genes (Sparc and Mmp2) have been previously associated with metastatic progression, giving greater confidence in the methodology discussed here.
Expressions of this set of basement membrane genes were highly correlated with each other, which has been demonstrated both in the current model and in lymphocytic infitration positive and negative human breast cancers (16). This finding implied that the expression of these genes may be under the regulations of the same upstream molecules, or their promoters are regulated in a similar manner. Earlier studies have provided evidence for such a hypothesis (27). By using a combined cDNA microarray/promoter transactivation approach, Verrecchia et al. (27) identified COL3A1, COL6A1, COL6A3, and COL5A2 as immediate targets of TGF-β/Smad3. In addition, TGF-β also enhances the expression of FBN1, MMP2, and LRP1. Thus, we hypothesized that this set of basement membrane genes may be regulated via a TGF-β and/or Smad3-related mechanism. Examination of the expression of TGF-β2 in caffeinated-samples showed significant increase of TGF-β2 with caffeine exposure (data not shown). It is likely that over-expression of basement membrane components may inhibit local tumor cell invasion, leading to suppression of distant dissemination, possibly via a TGF-β-dependent mechanism. It is worthy of note, that 20 genes out of the 32 genes with known function that were differentially regulated in the low-metastatic tumors were also differentially regulated in lymphocytic infitration negative as compared to lymphocytic infitration positive human breast cancers (Table 2) (16). This gene expression pattern similarity suggests the metastasis model used in the current study may have a similar pathological progression as that occurs in human breast cancer metastasis.
In search of common proteins regulated by caffeine and genetic background, we identified that regulation of the Stats signaling pathway is of potential importance in spontaneous lung metastasis. Stats are a family of cytoplasmic transcription factors that can be activated (i.e. phosphorylated) by cell surface receptors. Activated Stats proteins transmit signals to the nucleus by binding to specific recognition sequences within promoters and regulate gene expression. Aberrant Stats signaling, in particular signaling mediated by Stat3 and Stat5, participates in oncogenesis through up-regulation of genes encoding apoptosis inhibitors (Bcl-xL, Mcl-l), cell cycle regulation (cyclins D1/D2, c-Myc), and inducers of angiogenesis (VEGF). mRNA expression data from ONCOMINE (http://141.214.6.50/oncomine/main/index.jsp) showed that Stat5 expression is positively related to formation of metastatic lesions (28). Although the role of Stat5 in breast tumor progression is less clear, Stat5 phosphorylation has been implicated in the pathogenesis of chronic myelogenous leukemia (29), acute myeloid leukemia (30), and prostate cancer progression (31, 32). Dephosphorylation of Stat5 is believed to be mediated by protein tyrosine phosphatases (33). Concomitantly, over-expression of protein tyrosine phosphatases at the mRNA level was observed in low-metastatic tumors. In contrast to Stat3 and Stat5, Stat1 is regarded as a tumor suppressor, and has been suggested to anatagonize the activities of STAT3 and 5 (34). In the PyMT-induced mammary tumors with low-metastatic efficacy, we observed up-regulation of Stat1 phosphorylation. Stat1 activation has also been shown to be strongly related to a favorable prognosis in mammary carcinoma (35). Enhanced STAT1 phosphorylation has also been observed in breast cancer cells following treatment of a widely used chemotherapeutic drug doxorubicin (36). Therefore, Stats proteins may represent good candidates as molecular targets for cancer therapy. Collectively, we argue this study demonstrates that the activation/deactivation of Stats by caffeine treatment, DBA/2J or NZB/B1NJ genome potentially lead to a less invasive tumor type. Further studies will be required to validate this hypothesis, including the analysis of how variation in Stat expression influences metastatic efficiency.
In addition to identifying metastasis-related targets, we uncovered two other pathways regulated by caffeine exposure and genetic polymorphisms. These additional pathways included the Akt pathway and its downstream target, the caspase-dependent apoptosis pathway (37). It was important to note that these pathways were not consistently regulated by caffeine exposure and genetic variation. In the DBA/2J F1 hybrid, PI3K expression was increased by 2.27-fold (Supplementary Materials), consistent with the enhanced phosphorylation of downstream effectors in the Akt pathway. As a consequence of Akt activation, apoptosis in these tumor cells was suppressed. Conversely, caffeine-treated mice displayed decreased activation of the Akt pathway, most possibly due to the inhibitory effect of caffeine on kinase activity of PI3K (37). Activation of the Akt pathway can increase cell proliferation or/and inhibit apoptosis (38), which has been shown to provide cell survival signals essential to tumor formation induced by the PyMT antigen (39). Studies using overexpression of activated Akt1 in mouse mammary gland or neural progenitor cells have observed a higher incidence of tumor formation (39, 40). This effect was only apparent, however, when Akt1 transgenic animals were crossed with animals carrying activated K-ras alleles or with animals expressing mutated middle T oncoprotein that leads to increased Ras activation (39).
These observations suggest that Akt activation is an important aspect of neoplastic progression, yet is not sufficient to induce tumorigenesis in isolation. The association between Akt activation and metastasis is controversial. Phosphorylation of Akt has been associated with malignant progression and poor prognosis in human cancers (41). In the PyMT mouse model, activation of the Akt pathways accelerates tumor formation, while inhibiting metastasis (42). Tumors expressing constitutive activated Akt are less invasive to the surrounding tissues and are more differentiated (42). Cell lines derived from PyMT-induced mammary tumors demonstrated otherwise. Excessive activation of the Akt pathway was observed in a high-metastatic PyMT tumor cell line but not in a low-metastatic tumor cell line carrying a mutated PyMT antigen (Borowsky et al, submitted). While the discrepancy regarding the role of Akt activation in metastasis may be due to differences between tumor models (human populations vs. animal models vs. cell lines; PyMT-induced vs. mutated PyMT-induced vs. spontaneous), it is also possible that activation of the Akt pathway in isolation is not sufficient to promote metastasis, in a manner similar to its role in tumorigenesis.
In conclusion, we have demonstrated that the metastasis-related multisystem approach combined with pathway analysis permits rapid identification of molecular pathways potentially associated with metastasis control. The data presented demonstrate that systems biology is a powerful means of discovering important genes, proteins and pathways involved in complex biological processes such as tumor metastases. We believe that this global approach to interrogating the metastatic process may yield novel insights into the complex and multiple pathways involved in this process, and potentially lead to exciting new strategies and targets for clinical intervention.
Acknowledgments
This research was supported by the Intramural Research Program of the NIH and the National Cancer Institute. We would like to thank Dr. Nigel Crawford for the critical review and editing of the manuscript and Jennifer Officewala for performing Western blotting. Microarray analyses were performed using BRB ArrayTools developed by Dr. Richard Simon and Amy Peng Lam.
References
- 1.Liotta LA and Stetler-Stevenson WG. Principles of molecular cell biology of cancer: Cancer metastasis. In: DeVita SHV and Rosenberg SA, editors. Cancer: Principles & Practice of Oncology. Philadelphia, PA: J.B. Lippincott Co.; 1993. vol. 4th ed. p.134–149.
- 2.Arslan N, Serdar M, Deveci S, et al. Use of CA15-3, CEA and prolactin for the primary diagnosis of breast cancer and correlation with the prognostic factors at the time of initial diagnosis. Ann Nucl Med. 2000;14:395–399. doi: 10.1007/BF02988705. [DOI] [PubMed] [Google Scholar]
- 3.Abner AL, Collins L, Peiro G, et al. Correlation of tumor size and axillary lymph node involvement with prognosis in patients with T1 breast carcinoma. Cancer. 1998;83:2502–2508. [PubMed] [Google Scholar]
- 4.Eccles SA, Box G, Court W, Sandle J, Dean CJ. Preclinical models for the evaluation of targeted therapies of metastatic disease. Cell Biophys. 1994;24–25:279–91. doi: 10.1007/BF02789239. 279–291. [DOI] [PubMed] [Google Scholar]
- 5.Muschel RJ, Williams JE, Lowy DR, Liotta LA. Harvey ras induction of metastatic potential depends upon oncogene activation and the type of recipient cell. Am J Pathol. 1985;121:1–8. [PMC free article] [PubMed] [Google Scholar]
- 6.Hunter KW, Broman KW, Voyer TL, et al. Predisposition to Efficient Mammary Tumor Metastatic Progression Is Linked to the Breast Cancer Metastasis Suppressor Gene Brms1. Cancer Res. 2001;61:8866–8872. [PubMed] [Google Scholar]
- 7.Yang H, Rouse J, Lukes L, et al. Caffeine suppresses metastasis in a transgenic mouse model: a prototype molecule for prophylaxis of metastasis. Clin Exp Metastasis. 2005;21:719–735. doi: 10.1007/s10585-004-8251-4. [DOI] [PubMed] [Google Scholar]
- 8.Hedenfalk I, Duggan D, Chen Y, et al. Gene-Expression Profiles in Hereditary Breast Cancer. N Engl J Med. 2001;344:539–548. doi: 10.1056/NEJM200102223440801. [DOI] [PubMed] [Google Scholar]
- 9.Scherf U, Ross DT, Waltham M, et al. A gene expression database for the molecular pharmacology of cancer. Nat Genet. 2000;24:236–244. doi: 10.1038/73439. [DOI] [PubMed] [Google Scholar]
- 10.Korn E, Troendle J, McShane L, Simon RM. Controlling the number of false discoveries: Application to high-dimensional genomic data. Journal of Statistical Planning and Inference 2005
- 11.Simon, R., Korn, E., McShane, L., Wright, G., and Zhao, Y. Design and Analysis of DNA Microarray Investigations. New York: Springer-Verlag, 2005.
- 12.Wright GW, Simon RM. A random variance model for detection of differential gene expression in small microarray experiments. Bioinformatics. 2003;19:2448–2455. doi: 10.1093/bioinformatics/btg345. [DOI] [PubMed] [Google Scholar]
- 13.Yu LR, Conrads TP, Uo T, et al. Evaluation of the acid-cleavable isotope-coded affinity tag reagents: application to camptothecin-treated cortical neurons. J Proteome Res. 2004;3:469–477. doi: 10.1021/pr034090t. [DOI] [PubMed] [Google Scholar]
- 14.Le Voyer T, Lu Z, Babb J, et al. An epistatic interaction controls the latency of a transgene-induced mammary tumor. Mamm Genome. 2000;11:883–889. doi: 10.1007/s003350010163. [DOI] [PubMed] [Google Scholar]
- 15.McShane LM, Radmacher MD, Freidlin B, et al. Methods for assessing reproducibility of clustering patterns observed in analyses of microarray data. Bioinformatics. 2002;18:1462–1469. doi: 10.1093/bioinformatics/18.11.1462. [DOI] [PubMed] [Google Scholar]
- 16.van ‘t Veer LJ, Dai H, van de Vijver MJ, et al. Gene expression profiling predicts clinical outcome of breast cancer. Nature. 2002;415:530–536. doi: 10.1038/415530a. [DOI] [PubMed] [Google Scholar]
- 17.Ghadimi BM, Grade M, Difilippantonio MJ, et al. Effectiveness of gene expression profiling for response prediction of rectal adenocarcinomas to preoperative chemoradiotherapy. J Clin Oncol. 2005;23:1826–1838. doi: 10.1200/JCO.2005.00.406. [DOI] [PMC free article] [PubMed] [Google Scholar]
- 18.van’t Veer LJ, Paik S, Hayes DF. Gene expression profiling of breast cancer: a new tumor marker. J Clin Oncol. 2005;23:1631–1635. doi: 10.1200/JCO.2005.12.005. [DOI] [PubMed] [Google Scholar]
- 19.Mintz MB, Sowers R, Brown KM, et al. An expression signature classifies chemotherapy-resistant pediatric osteosarcoma. Cancer Res. 2005;65:1748–1754. doi: 10.1158/0008-5472.CAN-04-2463. [DOI] [PubMed] [Google Scholar]
- 20.Ramaswamy S, Ross KN, Lander ES, Golub TR. A molecular signature of metastasis in primary solid tumors. Nat Genet. 2003;33:49–54. doi: 10.1038/ng1060. [DOI] [PubMed] [Google Scholar]
- 21.Hao X, Sun B, Hu L, et al. Differential gene and protein expression in primary breast malignancies and their lymph node metastases as revealed by combined cDNA microarray and tissue microarray analysis. Cancer. 2004;100:1110–1122. doi: 10.1002/cncr.20095. [DOI] [PubMed] [Google Scholar]
- 22.Eckhardt BL, Parker BS, van Laar RK, et al. Genomic analysis of a spontaneous model of breast cancer metastasis to bone reveals a role for the extracellular matrix. Mol Cancer Res. 2005;3:1–13. [PubMed] [Google Scholar]
- 23.Yamashita K, Upadhay S, Mimori K, Inoue H, Mori M. Clinical significance of secreted protein acidic and rich in cystein in esophageal carcinoma and its relation to carcinoma progression. Cancer. 2003;97:2412–2419. doi: 10.1002/cncr.11368. [DOI] [PubMed] [Google Scholar]
- 24.Gilles C, Bassuk JA, Pulyaeva H, et al. SPARC/osteonectin induces matrix metalloproteinase 2 activation in human breast cancer cell lines. Cancer Res. 1998;58:5529–5536. [PubMed] [Google Scholar]
- 25.Dankort DL, Muller WJ. Signal transduction in mammary tumorigenesis: a transgenic perspective. Oncogene. 2000;19:1038–1044. doi: 10.1038/sj.onc.1203272. [DOI] [PubMed] [Google Scholar]
- 26.Lifsted T, Le Voyer T, Williams M, et al. Identification of inbred mouse strains harboring genetic modifiers of mammary tumor age of onset and metastatic progression. Int J Cancer. 1998;77:640–644. doi: 10.1002/(sici)1097-0215(19980812)77:4<640::aid-ijc26>3.0.co;2-8. [DOI] [PubMed] [Google Scholar]
- 27.Verrecchia F, Chu ML, Mauviel A. Identification of novel TGF-beta/Smad gene targets in dermal fibroblasts using a combined cDNA microarray/promoter transactivation approach. J Biol Chem. 2001;276:17058–17062. doi: 10.1074/jbc.M100754200. [DOI] [PubMed] [Google Scholar]
- 28.Bhattacharjee A, Richards WG, Staunton J, et al. Classification of human lung carcinomas by mRNA expression profiling reveals distinct adenocarcinoma subclasses. Proc Natl Acad Sci U S A. 2001;98:13790–13795. doi: 10.1073/pnas.191502998. [DOI] [PMC free article] [PubMed] [Google Scholar]
- 29.Huang M, Dorsey JF, Epling-Burnette PK, et al. Inhibition of Bcr-Abl kinase activity by PD180970 blocks constitutive activation of Stat5 and growth of CML cells. Oncogene. 2002;21:8804–8816. doi: 10.1038/sj.onc.1206028. [DOI] [PubMed] [Google Scholar]
- 30.Birkenkamp KU, Geugien M, Lemmink HH, Kruijer W, Vellenga E. Regulation of constitutive STAT5 phosphorylation in acute myeloid leukemia blasts. Leukemia. 2001;15:1923–1931. doi: 10.1038/sj.leu.2402317. [DOI] [PubMed] [Google Scholar]
- 31.Li H, Ahonen TJ, Alanen K, et al. Activation of signal transducer and activator of transcription 5 in human prostate cancer is associated with high histological grade. Cancer Res. 2004;64:4774–4782. doi: 10.1158/0008-5472.CAN-03-3499. [DOI] [PubMed] [Google Scholar]
- 32.Kazansky AV, Spencer DM, Greenberg NM. Activation of signal transducer and activator of transcription 5 is required for progression of autochthonous prostate cancer: evidence from the transgenic adenocarcinoma of the mouse prostate system. Cancer Res. 2003;63:8757–8762. [PubMed] [Google Scholar]
- 33.Edwards GM, Wilford FH, Liu X, et al. Regulation of Mammary Differentiation by Extracellular Matrix Involves Protein-tyrosine Phosphatases. J Biol Chem. 1998;273:9495–9500. doi: 10.1074/jbc.273.16.9495. [DOI] [PubMed] [Google Scholar]
- 34.Yu H, Jove R. The STATs of cancer--new molecular targets come of age. Nat Rev Cancer. 2004;4:97–105. doi: 10.1038/nrc1275. [DOI] [PubMed] [Google Scholar]
- 35.Widschwendter A, Tonko-Geymayer S, Welte T, et al. Prognostic significance of signal transducer and activator of transcription 1 activation in breast cancer. Clin Cancer Res. 2002;8:3065–3074. [PubMed] [Google Scholar]
- 36.Thomas M, Finnegan CE, Rogers KMA, et al. STAT1: A Modulator of Chemotherapy-induced Apoptosis. Cancer Res. 2004;64:8357–8364. doi: 10.1158/0008-5472.CAN-04-1864. [DOI] [PubMed] [Google Scholar]
- 37.Foukas LC, Daniele N, Ktori C, et al. Direct effects of caffeine and theophylline on p110 delta and other phosphoinositide 3-kinases. Differential effects on lipid kinase and protein kinase activities. J Biol Chem. 2002;277:37124–37130. doi: 10.1074/jbc.M202101200. [DOI] [PubMed] [Google Scholar]
- 38.Franke TF, Hornik CP, Segev L, Shostak GA, Sugimoto C. PI3K/Akt and apoptosis: size matters. Oncogene. 2003;22:8983–8998. doi: 10.1038/sj.onc.1207115. [DOI] [PubMed] [Google Scholar]
- 39.Hutchinson J, Jin J, Cardiff RD, Woodgett JR, Muller WJ. Activation of Akt (protein kinase B) in mammary epithelium provides a critical cell survival signal required for tumor progression. Mol Cell Biol. 2001;21:2203–2212. doi: 10.1128/MCB.21.6.2203-2212.2001. [DOI] [PMC free article] [PubMed] [Google Scholar]
- 40.Holland EC, Celestino J, Dai C, et al. Combined activation of Ras and Akt in neural progenitors induces glioblastoma formation in mice. Nat Genet. 2000;25:55–57. doi: 10.1038/75596. [DOI] [PubMed] [Google Scholar]
- 41.Perez-Tenorio G, Stal O. Activation of AKT/PKB in breast cancer predicts a worse outcome among endocrine treated patients. Br J Cancer. 2002;86:540–545. doi: 10.1038/sj.bjc.6600126. [DOI] [PMC free article] [PubMed] [Google Scholar]
- 42.Hutchinson JN, Jin J, Cardiff RD, Woodgett JR, Muller WJ. Activation of Akt-1 (PKB-alpha) can accelerate ErbB–z2-mediated mammary tumorigenesis but suppresses tumor invasion. Cancer Res. 2004;64:3171–3178. doi: 10.1158/0008-5472.can-03-3465. [DOI] [PubMed] [Google Scholar]