Abstract
Low accessibility of the rRNA is together with cell wall impermeability and low cellular ribosome content a frequent reason for failure of whole-cell fluorescence hybridization with fluorescently labeled oligonucleotide probes. In this study we compare accessibility data for the 16S rRNA of Escherichia coli (gamma Proteobacteria, Bacteria) with the phylogenetically distantly related organisms Pirellula sp. strain 1 (Planctomycetes, Bacteria) and Metallosphaera sedula (Crenarchaeota, Archaea) and the 18S rRNA accessibility of Saccharomyces cerevisiae (Eucarya). For a total of 537 Cy3-labeled probes, the signal intensities of hybridized cells were quantified under standardized conditions by flow cytometry. The relative probe-conferred fluorescence intensities are shown on color-coded small-subunit rRNA secondary-structure models. For Pirellula sp., most of the probes belong to class II and III (72% of the whole data set), whereas most of the probes targeting sites on M. sedula were grouped into class V and VI (46% of the whole data set). For E. coli, 45% of all probes of the data set belong to class III and IV. A consensus model for the accessibility of the small-subunit rRNA to oligonucleotide probes is proposed which uses 60 homolog target sites of the three prokaryotic 16S rRNA molecules. In general, open regions were localized around helices 13 and 14 including target positions 285 to 338, whereas helix 22 (positions 585 to 656) and the 3′ half of helix 47 (positions 1320 to 1345) were generally inaccessible. Finally, the 16S rRNA consensus model was compared to data on the in situ accessibility of the 18S rRNA of S. cerevisiae.
Fluorescence in situ hybridization (FISH) is an integral part of the rRNA approach to microbial ecology and evolution (14). Since the first application as phylogenetic stains in 1989 (8), fluorescence-labeled, rRNA-targeted oligonucleotide probes have evolved to become a widely used tool for the direct, cultivation-independent identification of individual microbial cells in complex environmental samples.
FISH is often hampered by low signal intensities. The probe-conferred fluorescence is, in addition to cell wall permeability and the cellular ribosome content, dependent on the in situ accessibility of the probe target site. The access of oligonucleotide probes to their target site may be hindered by the three-dimensional structure of the ribosome which includes rRNA-rRNA interactions as well as interactions of the rRNAs with ribosomal proteins (2, 6).
Until now, there have been only two systematic studies on the accessibility of rRNA target sites. In 1998, Fuchs et al. quantified the fluorescence signals conferred by 171 carboxyfluorescein-labeled oligonucleotides targeted to the 16S rRNA of Escherichia coli (11). Three years later, a study was published on the in situ accessibility of the 23S rRNA of Escherichia coli for Cy3-labeled oligonucleotide probes (10). The question of the transferability of the E. coli accessibility data to other organisms remained open. Here, we address this question by flow cytometric quantification of fluorescent signals conferred by oligonucleotides targeting the 16S rRNAs of the bacterium Pirellula sp. strain 1 and the archaeon Metallosphaera sedula as well as the 18S rRNA of the yeast Saccharomyces cerevisiae.
The organisms were chosen to cover all three domains of life. Pirellula sp. belongs to the bacterial phylum Planctomycetes and was included in the study because of the distant relationship to E. coli. Furthermore, the 16S rRNA accessibility of E. coli, which was initially studied with carboxy-fluorescein-labeled oligonucleotides, was reexamined with Cy3-labeled oligonucleotides to exclude any dye effects.
MATERIALS AND METHODS
Microorganisms and fixation.
The following type strains were grown: E. coli strain K-12 DSM 30083T (Deutsche Sammlung von Mikroorganismen und Zellkulturen, Braunschweig, Germany), M. sedula DSM 5348T, Pirellula sp. strain 1, and S. cerevisiae PYCC 4455T (Portuguese Yeast Culture Collection, Caparica, Portugal). In a slight modification of the protocol described by Huber et al. (12), M. sedula was grown without any sulfur particles in the media. Pirellula sp. strain 1 was grown as described previously (16). S. cerevisiae was grown aerobically under continuous shaking in YM broth (0.3% [wt/vol] malt extract, 0.2% yeast extract, 0.5% peptone, and 1% glucose) at 25°C. Cells were harvested in the exponential growth phase (prokaryotes, optical density at 600 nm of ∼0.5; yeast, optical density at 600 nm of ∼2.5), washed once with 1× phosphate-buffered saline (130 mM sodium chloride, 10 mM sodium phosphate buffer [pH 7.2]), and fixed with 4% paraformaldehyde as described before (1).
Sequencing.
Almost full-length 16S rRNA gene sequences of M. sedula and Pirellula sp. were amplified directly from freshly harvested cells by PCR as described previously (22). After the subsequent purification with a QIAquick PCR purification kit (Qiagen, Düsseldorf, Germany) both strands of the PCR product were sequenced with an Applied Biosystems 3100 DNA sequencer which used the Applied Biosystems DNA BigDye Terminator, version 3.0, Cycle Sequencing ready reaction kit (Applied Biosystems, Warrington, United Kingdom) supplied with AmpliTaq DNA polymerase in order to corroborate that all probes were indeed targeted to fully complementary target sites. To obtain the 18S rRNA gene sequence of S. cerevisiae, DNA was extracted from yeast cells following the method described by Sampaio et al. (15). PCR amplification and the primers used were previously described by Cai et al. (4). After purifying the PCR products with the GFX PCR DNA and gel band purification kit (Amersham Pharmacia Biotech, Piscataway, N.J.), both strands of the 18S rRNA gene were sequenced with an ALFexpressII automated sequencer (Amersham Pharmacia) (4). The sequences we obtained were identical to those already known and registered with the following accession numbers: E. coli, X80725; Pirellula sp. strain 1, X81938; M. sedula, X90481; and S. cerevisiae, J01353.
The operon diversity of E. coli has been investigated by Fuchs et al. (11). They could not find any effect on the fluorescence intensities in the comparison between operon-specific probes and probes from the standard set. For Pirellula sp. strain 1 and M. sedula, only one rRNA gene operon has been described. S. cerevisiae reveals more than 140 rRNA transcription units. We have not checked for sequence heterogeneity for the numerous copies in S. cerevisiae because the E. coli data suggested no relevant influence on the fluorescence signal intensities.
Probe design.
All oligonucleotide probes were designed to be fully complementary to the respective small-subunit rRNA sequences. The oligonucleotide probes for the 16S rRNA of E. coli were adapted from a study by Fuchs et al. (11). For E. coli, M. sedula, and Pirellula sp., care was taken that probes were designed to homolog target sites. Because of inserts, deletions, and differences in the GC contents of the 16S rRNA sequences (E. coli, 54.6%; Pirellula sp., 54.6%; and M. sedula, 62.6%), it was not possible to find more than 60 oligonucleotide probes that target fully homologous target sites in the three investigated prokaryotes.
For M. sedula, a set of 161 partly overlapping oligonucleotide probes was designed, 131 of which were homologous to those of E. coli. For Pirellula sp. strain 1, a single set of 88 probes was designed, 77 of which were homologous to those of E. coli. The probe sets of M. sedula and Pirellula sp. share 60 target positions. The 18S rRNA of S. cerevisiae was covered with a set of 112 mostly adjacent probes. This set was not homologous to target sites in any of the prokaryotic strains. For better comparability, S. cerevisiae probe designations are based on E. coli numbering (3). All helix numbers were directly taken from the E. coli secondary-structure model according to the ARB software package (http://www.arb-home.de).
Each single probe set covers the full length of the 16S or 18S rRNA of the respective organism. The standard probe length was 18 nucleotides. If the theoretical melting point according to the 4 + 2 formula of Suggs et al. (18), Td = [4 · (G+C) + 2 · (A+T)], exceeded 60°C or was below 48°C, the probe length was varied accordingly. Probe lists are available at http://www.mpi-bremen.de/∼sbehrens.
Probe labeling and quality control.
Probes were synthesized, monolabeled at the 5′ end with Cy3 [5,5′-disulfo-1,1′-(-γ-carbopentynyl)-3,3,3′,3′-tetramethylindolocarbocyanin-N-hydroxysuccinimidester] in the last step of solid-phase synthesis, and high-performance liquid chromatography purified by ThermoHybaid Interactiva Division GmbH (Ulm, Germany). Since differences in the quality of labeling directly influenced the amount of probe-conferred fluorescence (data not shown), aliquots of each probe were analyzed in a spectrophotometer (DU530; Beckmann, München, Germany) as described by Fuchs et al. (11).
Absorption peaks at 550 nm (Cy3) and 260 nm (oligonucleotide) were recorded. According to the Lambert-Beer law, the ratio of absorption at 550 nm (A550) versus 260 nm (A260) of a monolabeled oligonucleotide should match the ratio of the extinction coefficients (ɛ) of Cy3 and oligonucleotide. Values of <1 indicate an incomplete labeling of a probe, whereas values of >1 point to the presence of additional, potentially unbound Cy3 dye. Considering inaccuracies in the estimation of the extinction coefficients of oligonucleotides, we accepted values ranking from 0.7 and 1.3, assuming that these oligonucleotides were monolabeled.
FISH.
Approximately 108 fixed cells were hybridized in 100 μl of buffer containing 0.9 M sodium chloride, 0.1% sodium dodecyl sulfate, 20 mM Tris-HCl (pH 7.2), and 1.5 ng of fluorescent probe μl−1 at 46°C for 3 h (21). Subsequently, cells were pelleted by centrifugation for 2 min at 4,000 × g and resuspended in 100 μl of hybridization buffer containing no probe. After washing for 30 min at 46°C, samples were mixed with 500 μl of 1× phosphate-buffered saline (pH 8.4), immediately placed on ice, and analyzed within 3 h.
Flow cytometry.
The fluorescence intensities of hybridized cells were quantified by a FACStar Plus flow cytometer (BD Lifesciences, Mountain View, Calif). The 514-nm emission line of an argon ion laser was used as a light source and tuned to an output power of 750 mW. Forward-angle light scatter (FSC) was detected with a 530 ± 30 nm (BD Lifesciences) band-pass filter. Fluorescence was detected with a 620 ± 60 nm band-pass filter (FL1; Hugo Anders, Gesellschaft für dünne Schichten mbH, Nabburg, Germany). All measurements were calibrated to polychromatic, 0.5-μm-diameter polystyrene beads (Polysciences, Warrington, Pa.) both to check the stability of the optical alignment of the flow cytometer and to standardize the fluorescence intensities of the probes.
Data acquisition and processing.
The parameters FSC, side scatter, and FL1 were recorded as pulse height signals (four decades in logarithmic scale each), and for each measurement, 10,000 events were stored in list mode files. Subsequent analysis was done with CellQuest software (BD Lifesciences). Probe-conferred fluorescence was determined to be the median of the FL1 values of single cells lying in a gate that was defined in an FSC-versus-FL1 dot plot. Probe-conferred fluorescence intensities were recorded from triplicate samples. Each replicate represents independent cell hybridization. Only triplicates with a coefficient of variation of less than 10% were accepted, otherwise the quantification was repeated. No standard deviations are given, since the coefficient of variation in all cases were <10%.
The fluorescence of cells was corrected by subtraction of background fluorescence of negative controls and standardized to the fluorescence of reference beads. The probe-conferred fluorescence was finally expressed as the percentage of the mean of the whole data set of each organism (mean = 50%). Thereby, effects caused by differences in autofluorescence and ribosome content of the four microorganisms examined in this study can be excluded.
RESULTS
Accessibility of E. coli 16S rRNA for Cy3-labeled oligonucleotide probes.
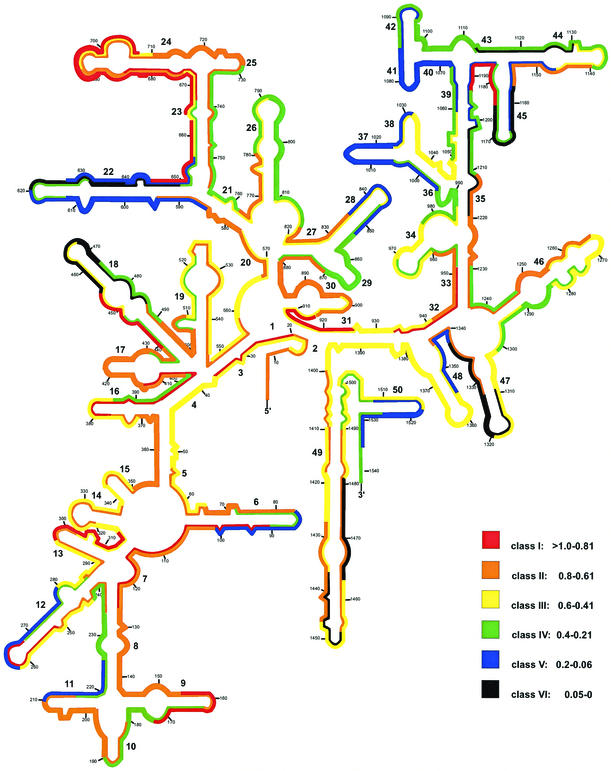
All probes were arbitrarily grouped according to their relative fluorescence hybridization signals into six classes of brightness (relative intensity units are given in parentheses): class I (>0.81), class II (0.8 to 0.61), class III (0.6 to 0.41), class IV (0.4 to 0.21), class V (0.2 to 0.06), and class VI (0.05 to 0). Figure 1 shows the distribution of the different brightness classes over the 16S rRNA secondary-structure model (5).
FIG.1.
Distribution of relative fluorescence hybridization intensities of 171 oligonucleotide probes targeting the 16S rRNA of E. coli. The different colors indicate different brightnesses (classes I through VI). Numbers in small type indicate nucleotide positions. Numbers in larger type reflect helix numbering according to Brosius et al. (3).
Of a total of 176 probes, only 17, i.e., Eco20 (1.15), Eco91 (0.82), Eco109 (0.82), Eco155 (0.99), Eco252 (1.02), Eco298 (0.82), Eco378 (1.09), Eco395 (1.06), Eco440 (0.94), Eco645 (0.81), Eco665 (1.14), Eco668 (0.82), Eco681 (1.30), Eco690 (1.27), Eco907 (1.01), Eco934 (0.88), and Eco1176 (0.84) (brightness values are in parentheses), are in the brightest class, class I, and 48 belong to class II (Table 1). Most probes of class I are directed against five regions where accessibility for oligonucleotide probes in E. coli seems to be very high: (i) positions 91 to 172 (the last few nucleotides of the 3′ half of helix 6 and the 5′ half of helices 7, 8, and 9); (ii) positions 285 to 315 (helix 13); (iii) positions 395 to 439 (the 3′ half of helix 4 and the complete helix 17); (iv) positions 645 to 728 (the 5′ half of helix 23, the complete helix 24, and the 5′ half of helix 25), except for the probe Eco650, Eco657, and Eco693 target positions; (v) positions 907 to 959 (the 5′ halves of helices 31, 32, and 33), except for the probe Eco917 and Eco926 target positions. Five smaller regions with very good accessibility are spread over the whole 16S rRNA. About half of all probes are in classes III (45 probes) and IV (35 probes). The signal-to-noise ratios even for the less-bright probes of class IV were still >20 for exponential-phase E. coli cells.
TABLE 1.
Distribution of probes over the different brightness classes for the four investigated strains
| Strain | No. of probes in brightness class:
|
|||||
|---|---|---|---|---|---|---|
| I | II | III | IV | V | VI | |
| E. coli | 17 | 48 | 45 | 35 | 20 | 11 |
| Pirellula sp. strain 1 | 0 | 37 | 26 | 12 | 10 | 3 |
| M. sedula | 34 | 18 | 14 | 21 | 52 | 22 |
| S. cerevisiae | 25 | 20 | 21 | 14 | 22 | 10 |
About 17% of all probes showed weak or no signals (classes V and VI; 0 to 0.2). Apparently, totally blocked sites (class VI) include the loop regions and the 3′ half of helix 47, the 3′ half of helix 22 and the loop regions of helices 18 and 45, and the target sites of probes Eco1113, Eco1202, Eco1437, and Eco1464. Target regions which are apparently only partially accessible to oligonucleotides (class V) include the 5′ halves of helices 36, 38, and 40; almost the complete helices 22, 37, and 41; the 3′ half of helix 50; and the target sites of probes Eco84, Eco210, Eco262, Eco836, Eco1147, Eco1184, and Eco1338.
Accessibility of Pirellula sp. strain 1 16S rRNA for Cy3-labeled oligonucleotide probes.
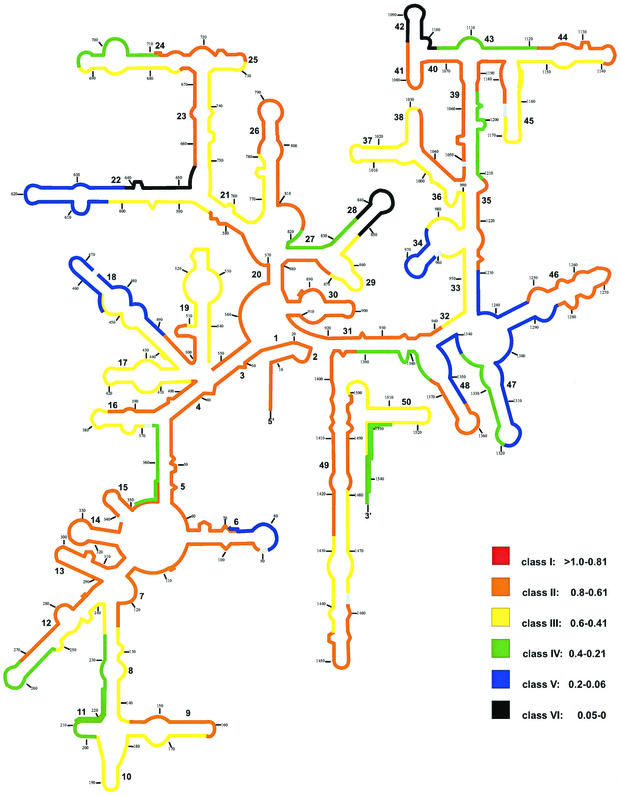
Normalized probe-conferred fluorescence data obtained for Pirellula sp. are summarized in Fig. 2, once again color coded into a 16S rRNA secondary-structure model (5). Of a total of 88 probes, 42% are in class II (37 probes). None of the probes could be assigned to class I. Nevertheless, the in situ accessibility of the 16S rRNA of Pirellula sp. strain 1 for oligonucleotide probes seems to be high. The brightest probes cover target sites including the complete helices 1, 2, 3, 4, 7, 13, 14, 15, 30, and 41 as well as large parts of helices 26, 46, and 49; the 3′ halves of helices 6, 12, 16, 35, and 38; and the 5′ halves of helices 9, 23, 25, 31, 39, 40, and 44.
FIG. 2.
Distribution of relative fluorescence hybridization intensities of 88 oligonucleotide probes targeting the 16S rRNA of Pirellula sp. strain 1. The different colors indicate different brightnesses (classes I through VI). Numbers in small type indicate nucleotide positions. Numbers in larger type reflect helix numbering according to Brosius et al. (3).
Overall, 38 of 88 probes are in classes III (26 probes) and IV (12 probes). The signal-to-noise ratio of the less-bright probes of class IV, for exponential-phase Pirellula sp. strain 1 cells, was about 6. About 15% of all probes showed weak or no signals (classes V and VI). Totally blocked sites include the 3′ half of helix 22, the loop region of helix 28, and helix 42. Apparently, only partially accessible sites for oligonucleotide probes are located at the loop region of helix 6, the upper 5′ half and nearly the complete 3′ half of helix 18, the loop region of helix 22, helix 34, the 5′ and 3′ basal part of helix 46, the 5′ half of helix 47, and probe Pir1338 target sites.
Accessibility of M. sedula 16S rRNA for Cy3-labeled oligonucleotide probes.
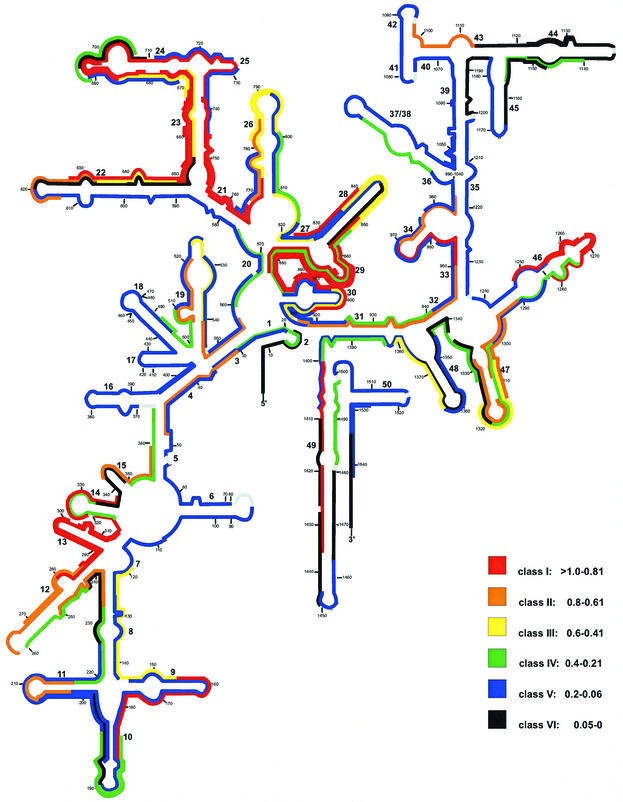
Fig. 3 summarizes the distribution of probe-conferred fluorescence values over the 16S rRNA secondary-structure model of M. sedula (5). Of a total of 161 probes, 34 are in the brightest class, class I, and 18 belong to class II. Most probes of these two classes are directed against five target regions: (i) positions 234 to 338 (helices 12, 13, and 14), except for the Met244 and Met316 target sites; (ii) positions 645 to 682 (the distal part of the 3′ half of helix 22 and the complete 5′ half of helix 23), except for the Met657 target sites; (iii) positions 704 to 772 (the 3′ half of helix 24, helix 25, and the 3′ half of helices 23 and 21), except for the Met711 and Met729 target sites; (iv) positions 850 to 906 (helices 29 and 30 and the 3′ half of helix 20), except for the Met853, Met871, and Met885 target sites; (v) positions 1248 to 1282 (the loop region of helix 46), except for the probe Met1274 target sites. Twenty-three smaller accessible spots are spread over the whole 16S rRNA. About one-fifth of all probes is in class III (14 probes) and IV (21 probes). Probes of class IV had a signal-to-noise ratio of about 21.
FIG. 3.
Distribution of relative fluorescence hybridization intensities of 161 oligonucleotide probes targeting the 16S rRNA of M. sedula. The different colors indicate different brightnesses (classes I through VI). Numbers in small type indicate nucleotide positions. Numbers in larger type reflect helix numbering according to Brosius et al. (3).
About one-half (46%) of all probes showed low signal intensities down to only background fluorescence (class V and VI). Apparently, totally blocked sites (class VI) include the 5′ halves of helices 43 and 45 and the complete helix 44, except for the Met1140 target sites. Eighteen smaller spots of totally blocked sites are distributed over the whole 16S rRNA secondary-structure model. Target regions which are apparently only partially accessible to oligonucleotides (class V) include the 5′ halves of helices 5, 22, 39, and 40; the complete helices 6, 16, 17, 18, 41, and 50; and the 3′ halves of helices 33, 35, 37, 38, and 45. Thirty-four other oligonucleotides belonging to class V are located all over the 16S rRNA.
Accessibility of S. cerevisiae 18S rRNA for Cy3-labeled oligonucleotide probes.
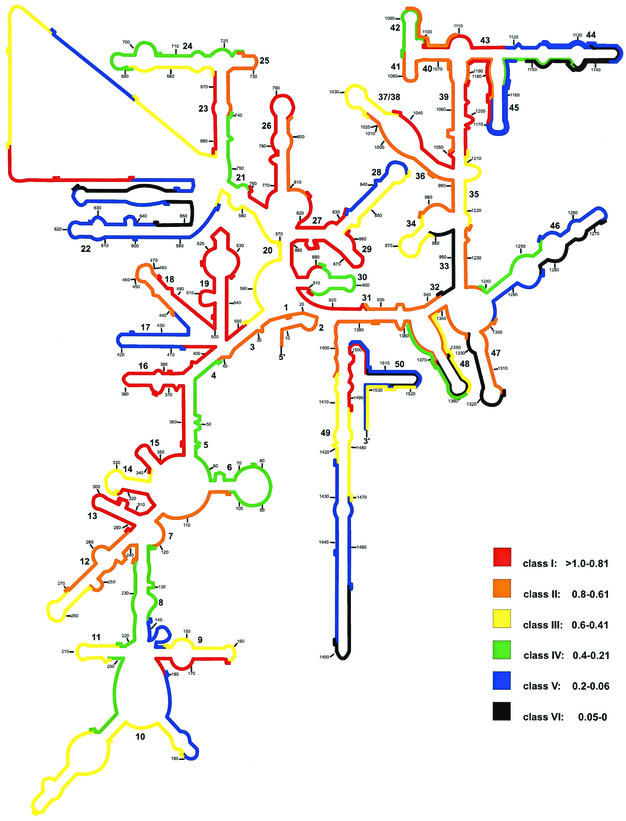
In analogy to the three prokaryotes, the distribution of the six brightness classes over the S. cerevisiae 18S rRNA secondary-structure model is shown in Fig. 4 (5). Of a total of 112 probes, 25 are in class I and 20 belong to class II. Most of these probes cover six major hot spots of good in situ accessibility: (i) positions 270 to 408 (the 5′ half of helix 12 and helices 13, 14, 15, and 16), except for probe Sac322 target positions; (ii) positions 439 to 552 (helices 18 and 19); (iii) positions 759 to 832 (helix 26 and the 3′ half of helix 27); (iv) positions 858 to 927 (helices 29 and 30, the 5′ half of helix 2, and the first few nucleotides of the 3′ half of helix 31), except for probe Sac891 target sites; (v) positions 1037 to 1118 (the 5′ half of helices 37 and 38; helices 39, 40, 41, and 42, and the 3′ half of helix 43), except for probe Sac1084 target sites; and (vi) positions 1171 to 1208 (the 5′ half of helices 45 and 39).
FIG. 4.
Distribution of relative fluorescence hybridization intensities of 112 oligonucleotide probes targeting the 16S rRNA of S. cerevisiae. The different colors indicate different brightnesses (classes I through VI). Numbers in small type indicate nucleotide positions. Numbers in larger type reflect helix numbering according to Brosius et al. (3).
Nearly one-third of all probes are in class III (21 probes) and IV (14 probes). The signal-to-noise ratios even for the less-bright probes of class IV were still 22 for exponential-phase S. cerevisiae cells. Nearly 30% of all probes showed only dim or no fluorescence. Obviously, only partially accessible target regions (class V) include helices 17 and 22, the 5′ half of helices 44 and 45, the distal part of helix 49, except for the probe Sac1449 target positions, and the target sites of probes Sac138, Sac180, Sac651c, Sac651h, Sac832, Sac1256, Sac1284, Sac1502, and Sac1524. Completely blocked regions (class VI) enclose most of the 3′ half of helix 44 and the target sites of probes Sac644, Sac651b, Sac943, Sac1269, Sac1316, Sac1352, Sac1449, and Sac1506.
DISCUSSION
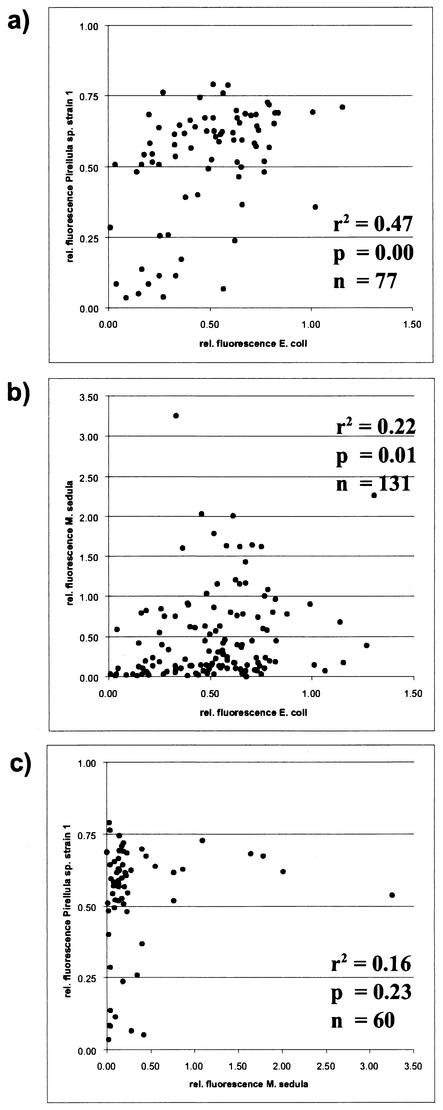
The aim of this study was to compare the in situ accessibility of the small-subunit rRNA of three different prokaryotes and a eucaryote for Cy3-labeled oligonucleotide probes. Care was taken that the probe-mediated fluorescence was not affected by parameters like quality of probe synthesis or dissociation temperature. Effects caused by differences in ribosome content or autofluorescence were minimized by the standardization procedures applied. The best correlation between two data sets was achieved for the 77 probes targeting homolog positions in E. coli and Pirellula sp. The applied P test (P < 0.01) revealed a highly significant r2 value of 0.47 (Fig. 5a). The correlation coefficient decreased when the members of the domain Bacteria were compared to the archaeon M. sedula. Between E. coli and M. sedula the correlation coefficient was 0.22. The P test supports the significance of this value (P < 0.01) because of the extensive set of 131 homolog probes shared by these two organisms (Fig. 5b). The correlation between Pirellula sp. and M. sedula was not significant (P > 0.01). This might be due to the limited number of only 60 probes targeting homolog sites within these organisms (Fig. 5c). The correlation analysis clearly shows that the in situ accessibility maps are more similar for phylogenetically more-related organisms. Extrapolations of our data to other organisms should therefore be based on the data available for the closest relative.
FIG. 5.
Correlation of relative (rel.) fluorescence intensities on fully homologous target sites (n). (a) E. coli versus Pirellula sp. strain 1. (b) E. coli versus M. sedula. (c) Pirellula sp. strain 1 versus M. sedula. Linear correlation coefficients (r2) and P test values (P) were calculated for each pairwise comparison.
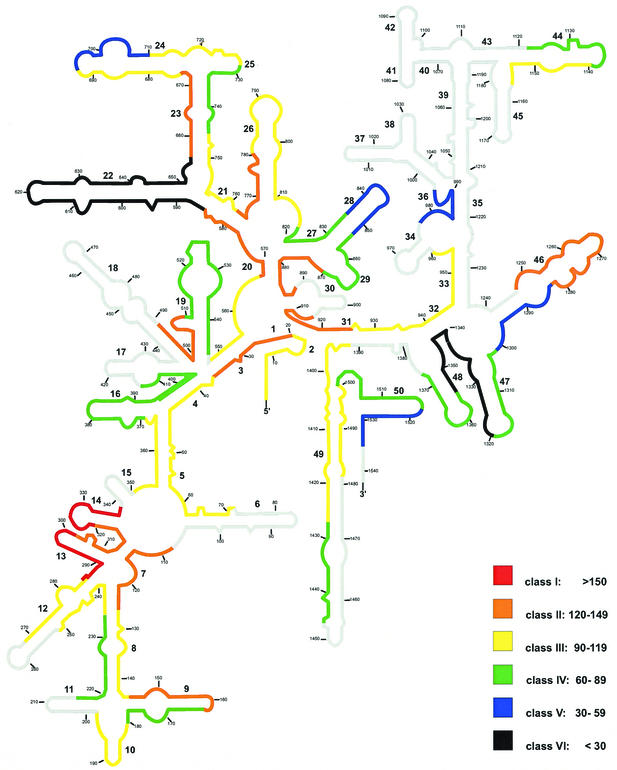
The consensus in situ accessibility map (Fig. 6) of the three prokaryotes considers only the data on the 60 fully homologous target sites. To each organism, rank values were given beginning with 60 for the brightest probe down to 1 for the less bright probe. Rank sum values for each of the 60 target sites were calculated and arbitrarily grouped into six classes of brightness as follows: class I, rank sum values of >150; class II, rank sum values of 120 to 149; class III, rank sum values of 90 to 119; class IV, rank sum values of 60 to 89; class V, rank sum values of 30 to 59; and class VI, rank sum values of <30. Only two of the target sites (positions 285 to 302 and 321 to 338) are in class I. Regions with high accessibility in all three prokaryotes are (i) positions 285 to 338 (helices 13 and 14), (ii) positions 871 to 925, except helix 30 target positions, and (iii) positions 1248 to 1283 (most of the upper part of helix 46). Seven smaller regions of good accessibility are located on helices 2, 3, 7, 9, 20, 23, 26, 27, and 31.
FIG.6.
Consensus accessibility map for prokaryotes. The color coding on a 16S rRNA secondary-structure model of E. coli is based on rank sums for homologous target sites. Grey areas could not be covered with fully homologous probes. The different colors indicate different brightnesses (classes I through VI). Numbers in small type indicate nucleotide positions. Numbers in larger type reflect helix numbering according to Brosius et al. (3).
Recently a homology model of the 30S ribosomal subunit of E. coli became available (20). It is based on the high-resolution three-dimensional structure model of the small ribosomal subunit of Thermus thermophilus (17, 23). We plan to compare our in situ accessibility data to three-dimensional structure models of the 30S ribosomal subunit. It must, however, be considered that this comparison might not be straightforward because the ribosomes of whole paraformaldehyde-fixed cells may be in a denatured conformational stage that does not mimic the native ribosome structure.
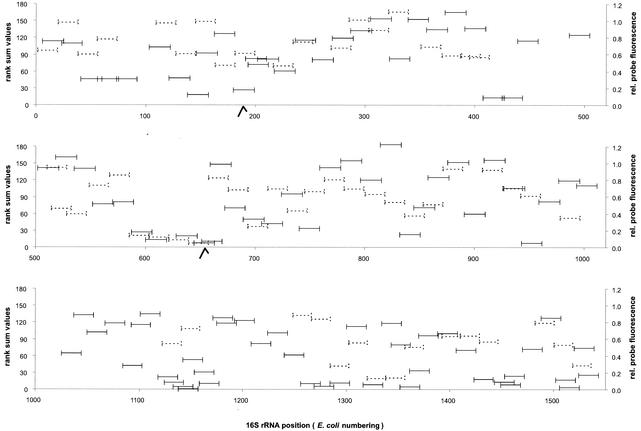
Due to long inserts, it was very difficult to design a larger set of probes for the 18S rRNA of S. cerevisiae that is a homolog to the prokaryote data sets. An independent probe set was created. Therefore, we compared the prokaryotic consensus rank sum values with the relative fluorescence values of each probe of the S. cerevisiae data set over the whole 16S rRNA sequence (Fig. 7). At least for selected regions, in situ accessibilities were similar, e.g., positions 587 to 651 were low both in the prokaryotic consensus and in S. cerevisiae.
FIG. 7.
Comparison of the relative (rel.) fluorescence of S. cerevisiae 18S rRNA probes (solid lines) with the rank sum values of the prokaryotic 16S rRNA consensus model (dotted lines). Hooks on the sequence axis indicate two large inserts of 72 and 166 nucleotides on the 18S rRNA sequence of S. cerevisiae for which not all probes are shown. The lengths and exact positions of probes with respect to E. coli numbering (3) are indicated on the x axes.
Differences in the E. coli in situ accessibility for carboxy-fluorescein- and Cy3-labeled oligonucleotides.
E. coli 16S rRNA accessibility had been examined in 1998 with carboxy-fluorescein-labeled probes (11). This study was performed with Cy3-labeled oligonucleotides, which have, due to their superior fluorescence, almost fully replaced fluorescein- and rhodamine-labeled probes. For comparative purposes, we also reexamined E. coli. The data are generally very consistent, although the probe-conferred fluorescence signals of the fluorescein-labeled probe data set has been normalized differently (11). This is most evident for blocked sites (classes V and VI). When the fluorescein-labeled probe data of Fuchs et al. are normalized the same way we analyzed our data in this study, 37% of the probes are in the same brightness class. One-third of the Cy3-labeled probes is listed in one or two brightness classes higher. The carbo-cyanine dye derivative Cy3 has, in comparison to the triphenylmethane derivative carboxy-fluorescein, a more-linear structure that could reduce steric hindrance and thereby facilitate probe binding to the target (9). Another reason for the superior performance of Cy3 is its pH independence. Interestingly, five of the Cy3-labeled probes were grouped into brightness classes three or four categories higher than the same oligonucleotides carrying a fluorescein label. Three of these probes target the 5′ half of helix 23 (Eco645, Eco665, and Eco668). The decrease in the fluorescein fluorescence for these target regions might be caused by base-specific quenching (7, 13, 24). Torimura et al. described the sequence-specific quenching of fluorescein with special attention to guanine bases (19). For the three mentioned probes targeting the 5′ half of helix 23, 5′-GG (positions 645 and 646) and 5′-GAG6 (positions 664 to 670) can be found on the probe target sequence in spatial proximity to the dye-labeled 5′ end of the hybridized oligonucleotide.
Although fluorescence-quenching has not yet been described for the cyanine dyes Cy3 and Cy5, we argue that positional effects on probe-conferred fluorescence may also be accountable for single cases where effects occur that cannot be explained by hindered or unimpeded probe access to its target position, for example, the 3′ half of helix 22 or the 5′ half of helix 49 in M. sedula, where overlapping probes vary in their fluorescence intensities from class I to class VI. In these regions, the probe-conferred fluorescence may also be influenced by position effects such as sequence-specific quenching of the fluorescence signal by electron energy transfer, as previously described (7, 19, 24).
Although the small-subunit rRNA is a highly conserved molecule, our data show that there are differences in higher-order structures that influence target site accessibility to oligonucleotide probes. By referring to our accessibility maps, probe design should become more reliable. We intend to incorporate the in situ accessibility data into future updates of the commonly used probe design software package ARB (http://www.arb-home.de). Nevertheless, it is still necessary to test every newly designed probe on reference organisms before it is used with environmental samples for the quantification and in situ identification of individual microbial cells. In addition to in situ accessibility effects on FISH results, we found clear indications for positional effects on dye fluorescence that should be further investigated in the future.
Acknowledgments
We thank W. Wosniok (University of Bremen) for statistical recommendations.
This work was supported by grants from the DFG (Am73/3-1) and the Max Planck Society. J.I. received a Ph.D. grant (Praxis XXI/BD/19833/99) from Fundação para a Ciência e a Tecnologia, Lisbon, Portugal.
REFERENCES
- 1.Amann, R. I., L. Krumholz, and D. A. Stahl. 1990. Fluorescent-oligonucleotide probing of whole cells for determinative, phylogenetic, and environmental studies in microbiology. J. Bacteriol. 172:762-770. [DOI] [PMC free article] [PubMed] [Google Scholar]
- 2.Ban, N., P. Nissen, J. Hansen, M. Capel, P. B. Moore, and T. A. Steitz. 1999. Placement of protein and RNA structures into a 5 Å-resolution map of the 50S ribosomal subunit. Nature 400:841-847. [DOI] [PubMed] [Google Scholar]
- 3.Brosius, J., T. J. Dull, D. D. Sleeter, and H. F. Noller. 1981. Gene organization and primary structure of a ribosomal RNA operon from Escherichia coli. J. Mol. Biol. 148:107-127. [DOI] [PubMed] [Google Scholar]
- 4.Cai, J., I. N. Roberts, and M. D. Collins. 1996. Phylogenetic relationships among members of the Ascomycetous yeast genera Brettanomyces, Debaryomyces, Dekkera, and Kluyveromyces deduced by small-subunit rRNA gene sequences. Int. J. Syst. Bacteriol. 46:525-549. [DOI] [PubMed] [Google Scholar]
- 5.Cannone, J. J., S. Subramanian, M. N. Schnare, J. R. Collett, L. M. D'Souza, Y. Du, B. Feng, N. Lin, L. V. Madabusi, K. M. Muller, N. Pande, Z. Shang, N. Yu, and R. R. Gutell. 2002. The Comparative RNA Web (CRW) site: an online database of comparative sequence and structure information for ribosomal, intron, and other RNAs. BMC Bioinformatics 3:15.. [DOI] [PMC free article] [PubMed] [Google Scholar]
- 6.Clemons, W. M., J. L. C. May, B. T. Wimberly, J. P. McCutcheon, M. S. Capel, and V. Ramakrishnan. 1999. Structure of a bacterial 30S ribosomal subunit at 5.5 Å resolution. Nature 400:833-840. [DOI] [PubMed] [Google Scholar]
- 7.Crockett, A. O., and C. T. Wittwer. 2001. Fluorescein-labeled oligonucleotides for real-time PCR: using the inherent quenching of deoxyguanosine nucleotides. Anal. Biochem. 290:89-97. [DOI] [PubMed] [Google Scholar]
- 8.DeLong, E. F., G. S. Wickham, and N. R. Pace. 1989. Phylogenetic stains: ribosomal RNA-based probes for the identification of single microbial cells. Science 243:1360-1363. [DOI] [PubMed] [Google Scholar]
- 9.Fuchs, B. M., F. O. Glöckner, J. Wulf, and R. Amann. 2000. Unlabeled helper oligonucleotides increase the in situ accessibility of 16S rRNA for fluorescently labeled oligonucleotide probes. Appl. Environ. Microbiol. 66:3603-3607. [DOI] [PMC free article] [PubMed] [Google Scholar]
- 10.Fuchs, B. M., K. Syutsubo, W. Ludwig, and R. Amann. 2001. In situ accessibility of the Escherichia coli 23S rRNA for fluorescently labeled oligonucleotide probes. Appl. Environ. Microbiol. 67:961-968. [DOI] [PMC free article] [PubMed] [Google Scholar]
- 11.Fuchs, B. M., G. Wallner, W. Beisker, I. Schwippl, W. Ludwig, and R. Amann. 1998. Flow cytometric analysis of the in situ accessibility of Escherichia coli 16S rRNA for fluorescently labeled oligonucleotide probes. Appl. Environ. Microbiol. 64:4973-4982. [DOI] [PMC free article] [PubMed] [Google Scholar]
- 12.Huber, G., C. Spinnler, A. Gambacorta, and K. O. Stetter. 1989. Metallosphaera sedula gen. and sp. nov. Represents a new genus of aerobic, metal-mobilizing, thermoacidophilic Archaebacteria. Syst. Appl. Microbiol. 12:38-47. [Google Scholar]
- 13.Norman, D. G., R. J. Grainger, D. Uhrin, and D. M. J. Lilley. 2000. Location of cyanine-3 on double-stranded DNA: importance for fluorescence resonance energy transfer studies. Biochemistry 39:6317-6324. [DOI] [PubMed] [Google Scholar]
- 14.Olsen, G. J., D. J. Lane, S. J. Giovannoni, N. R. Pace, and D. A. Stahl. 1986. Microbial ecology and evolution: a ribosomal rRNA approach. Annu. Rev. Microbiol. 40:337-365. [DOI] [PubMed] [Google Scholar]
- 15.Sampaio, J. P., M. Gadanho, and R. Bauer. 2001. Taxonomic studies on the genus Cystofilobasidium: description of Cystofilobasidium ferigula sp. nov. and clarification of the status of Cystofilobasidium lari-marini. Int. J. Syst. Bacteriol. 51:221-229. [DOI] [PubMed] [Google Scholar]
- 16.Schlesner, H. 1994. The development of media suitable for the microorganisms morphologically resembling Planctomyces spp., Pirellula spp., and other Planctomycetales from various aquatic habitats using dilute media. Syst. Appl. Microbiol. 17:135-145. [Google Scholar]
- 17.Schluenzen, F., A. Tocilj, R. Zarivach, J. Harms, M. Gluehmann, D. Janell, A. Bashan, H. Bartels, I. Agmon, F. Franceschi, and A. Yonath. 2000. Structure of functionally activated small ribosomal subunit at 3.3 Å resolution. Cell 102:15-623. [DOI] [PubMed] [Google Scholar]
- 18.Suggs, S. V., T. Hirose, T. Miyake, E. H. Kawashima, M. J. Johnson, K. Itakura, and R. B. Wallace. 1981. Use of synthetic oligodeoxyribonucleotides for the isolation of specific cloned DNA sequences, p. 683-693. In D. Brown and C. F. Fox (ed.), Developmental biology using purified genes. Academic Press, Inc., New York, N.Y.
- 19.Torimura, M., S. Kurata, K. Yamada, T. Yokomaku, Y. Kamagata, T. Kanagawa, and R. Kurane. 2001. Fluorescence-quenching phenomenon by photoinduced electron transfer between a fluorescent dye and a nucleotide base. Anal. Sci. 17:155-160. [DOI] [PubMed] [Google Scholar]
- 20.Tung, C. S., S. Joseph, and K. Y. Sanbonmatsu. 2002. All-atom homology model of the Escherichia coli 30S ribosomal subunit. Nat. Struct. Biol. 9:750-755. [DOI] [PubMed] [Google Scholar]
- 21.Wallner, G., R. Amann, and W. Beisker. 1993. Optimizing fluorescent in situ-hybridization with rRNA-targeted oligonucleotide probes for flow cytometric identification of microorganisms. Cytometry 14:136-143. [DOI] [PubMed] [Google Scholar]
- 22.Wallner, G., B. Fuchs, W. Beisker, S. Spring, and R. Amann. 1997. Flow cytometric sorting of microorganisms for molecular analysis. Appl. Environ. Microbiol. 63:4223-4331. [DOI] [PMC free article] [PubMed] [Google Scholar]
- 23.Wimberly, B. T., D. E. Brodersen, W. M. Clemons, R. J. Morgan-Warren, A. P. Carter, C. Vonrhein, T. Hartsch, and V. Ramakrishnan. 2000. Structure of the 30S ribosomal subunit. Nature 407:327-339. [DOI] [PubMed] [Google Scholar]
- 24.Zahavy, E., and M. A. Fox. 1999. Photophysical quenching mediated by guanine groups in pyrenyl-N-alkylbutanoamide end-labeled oligonucleotides. J. Phys. Chem. 103:9321-9327. [Google Scholar]


