Abstract
The heavy chain of murine ferritin, an iron storage molecule with ferroxidase activity, was developed as a novel endogenous reporter for the detection of gene expression by magnetic resonance imaging (MRI). Expression of both enhanced green fluorescent protein (EGFP) and influenza hemagglutinin (HA)-tagged ferritin were tightly coregulated by tetracycline (TET), using a bidirectional expression vector. C6 cells stably expressing a TET-EGFP-HA-ferritin construct enabled the dynamic detection of TET-regulated gene expression by MRI, followed by independent validation using fluorescence microscopy and histology. MR relaxation rates were significantly elevated both in vitro and in vivo on TET withdrawal, and were consistent with induced expression of ferritin and increase in intracellular iron content. Hence, overexpression of ferritin was sufficient to trigger cellular response, augmenting iron uptake to a degree detectable by MRI. Application of this novel MR reporter gene that generates significant contrast in the absence of exogenously administered substrates opens new possibilities for noninvasive molecular imaging of gene expression by MRI.
Keywords: MRI, gene expression, ferritin, iron, C6 glioma
Introduction
Advances in molecular biology and cellular biochemistry provide innovative approaches for developing new molecular imaging probes for magnetic resonance imaging (MRI), to allow noninvasive dynamic mapping of multiple parameters of biologic processes. Such probes can be developed for specific molecular targets using antibodies, ligands [1–4], or “smart” probes activated by a target enzyme such as β-galactosidase [5–7]. Reporter enzymes were suggested also for magnetic resonance spectroscopy (MRS), including creatine kinase [8] and thymidine kinase [9]. Another option for MRI reporter is the transferrin receptor, in which contrast is generated by inducing receptor-mediated internalization of exogenously administered transferrin coupled to paramagnetic particles [2]. Recently, tyrosinase-catalyzed melanin synthesis was suggested as a reporter, in which contrast was generated by exogenously administered iron, which binds to the melanin [10,11]. However, overexpression of either tyrosinase or transferrin receptor could elevate radical formation by Fenton reaction due to the increase in free iron concentration [12].
Thus far, all the reporter genes developed for MRI rely on exogenous administration of contrast material; therefore, delivery barriers and clearance must be considered. The aim of our work was to develop a novel endogenous reporter for imaging gene expression by MRI. Endogenous reporter proteins for optical imaging such as GFP are widely used. However, sensitivity as well as resolution for detection of fluorescent proteins are significantly limited by the depth of penetration and scattering of light. MRI offers exquisite spatial resolution for deep tissues; thus, an endogenous reporter of gene expression for MRI would provide an important tool, complementing optical imaging for deep tissue molecular imaging.
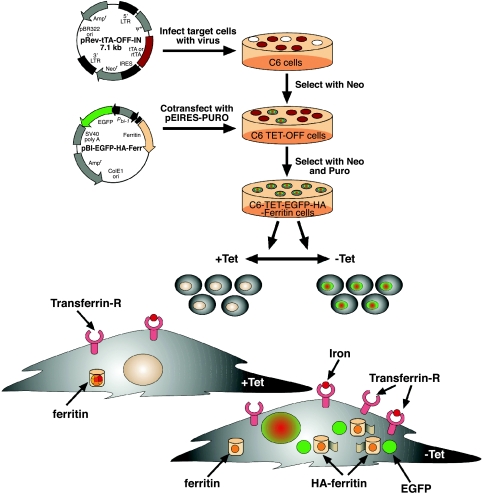
Here we would like to propose ferritin as an endogenous reporter protein for MRI, which would directly change the MR signal, in its expression site, in analogy to fluorescent proteins in optical imaging, without the need to administer additional contrast materials (Figure 1). Overexpression of ferritin is expected to transiently lower intracellular iron concentration, leading to physiological compensation augmenting iron uptake. Excess intracellular iron would be safely sequestered within the overexpressed ferritin, thus minimizing iron toxicity. Sensitivity for detection by MR would be enhanced by two mechanisms, including net iron uptake as well as changes in iron relaxivity, due to redistribution of the existing intracellular iron within a larger ferritin pool. HA tag as well as enhanced green fluorescent protein (EGFP) were added to allow independent validation of the MRI data by molecular analysis and fluorescence microscopy (Figure 1). Ferritin is a ubiquitous and highly conserved iron-binding protein. In vertebrates, the cytosolic ferritin is a heteropolymer composed of variable proportions of H and L subunits [13]. Twenty-four ferritin subunits assemble to form the apoferritin shell. Each apoferritin molecule of 450 kDa can sequester up to 4500 iron atoms, depending on the tissue type and physiologic status of the cell. Cellular models in which ferritin expression was modulated revealed that the heavy (H) chain is the main regulator of ferritin activity. The H subunit has ferroxidase activity that promotes iron oxidation and incorporation [14]. In contrast, the L-chain lacks detectable ferroxidase activity but facilitates the activity of the H-chain by offering sites for iron nucleation and mineralization, and by increasing the turnover at the ferroxidase center [15]. Cells transfected with the mouse H-chain ferritin responded by upregulation of transferrin receptor and increased iron uptake [16].
Figure 1.
TET-regulated expression of EGFP-HA-ferritin as a multimodality endogenous reporter of gene expression for MRI and optical imaging. C6-TET-EGFP-ferritin was generated by the infection of C6 cells with viruses carrying the TET transactivator (tTA) under a constitutive promoter (pRev-tTA-OFF-IN vector). The cells were then transfected to express TET-EGFP-HA-ferritin using a bidirectional vector (pBI-EGFP-HA-Ferr vector). Selected clones showed overexpression of EGFP and HA-tagged ferritin, both of which were tightly suppressed by administration of TET (+Tet). In the absence of TET (-Tet), overexpression of ferritin leads to redistribution of intracellular ferritin iron and chelation of intracellular free iron, thereby generating MR contrast by increasing R1 and R2 relaxation rates. Iron homeostasis is restored by the compensatory expression of transferrin receptor and increased iron uptake, providing further gain in MR contrast.
Ferritin shortens both T1 and T2 relaxation times; thus, MRI was used for in vivo quantification of ferritin-bound iron in liver and brain nuclei in pathologies including β-thalassemia and Alzheimer's disease [17,18]. Several in vitro studies were conducted to determine the transverse (T2) relaxation of water as a function of iron load on ferritin [19,20]. These studies showed that the contribution of iron atoms to relaxivity is exceptionally high at low iron loading. Based on these findings, we postulated that changes in the expression of apoferritin and redistribution of iron could alter MR contrast even in the absence of changes in total iron content [19].
A cassette of multimodality reporter genes was constructed so as to allow tight tetracycline (TET) regulation of expression of ferritin as well as EGFP (Figure 1). The proposed reporter would permit the detection of TET-regulated gene expression by MRI, as well as independent validation by fluorescence microscopy and histology, in genetically identical cells or tumors. We show here that overexpression of ferritin H-chain in C6 rat glioma cells under TET regulation (C6-TET-EGFP-HA-ferritin) increased cellular iron content in vitro and significantly increased MR relaxation rates, both in vitro and in vivo, without altering tumor growth. These results indicate the potential use of ferritin as a reporter for dynamic detection of gene expression by noninvasive MRI.
Materials and Methods
Construction of C6-TET-EGFP-HA-Ferritin Cells
The murine ferritin H-chain cDNA (GenBank accession no. NM-010239) with an HA (influenza hemagglutinin) tag (HA-ferritin) and a Kozak sequence at the N-terminus was generated by reverse transcription polymerase chain reaction (RT-PCR). Retroviral gene delivery and expression system RevTet-Off-IN (Clontech, Palo Alto, CA) was used to establish C6 cells expressing murine HA-ferritin cDNA. HA-ferritin cDNA was cloned downstream of the TET response element in the bidirectional pBI-EGFP vector (Clontech) to form pBI-EGFP-HA-ferritin construct (Figure 1). Packaging cells (PT67; Clontech) were transfected with pRevTet-Off-IN, and the virus containing supernatant was used to infect C6 cells. Stable C6 cells expressing C6pRevTet-Off were selected with neomycin (400 µl; Gibco-BRL, Life Technologies, Paisley, Scotland, UK) and served as parental cells for cotransfection with pBI-EGFP-HA-ferritin and pEIRES-Puro vector (20:1 molar ratio) using FuGene 6 (Roche Diagnostics Corporation, Mannheim, Germany). EGFP-expressing cells were selected and expression of ferritin was monitored by Western blot analysis. Stable cell populations were maintained in DMEM containing the Tet system-approved and USDA-approved FBS (DB Biosciences; Clontech, Palo Alto, CA) supplemented with neomycin (400 µg/ml; Gibco-BRL/Life Technologies) and puromycin (2.5 µg/ml; Sigma Chemical Co., St. Louis, MO).
Neutral Red Staining of Viable Cells
Cells (2 x 10⁴) were grown in a 96-well tissue culture plate. After 24, 48, or 72 hours, the medium was discarded and cells were stained (0.4% NR solution; 90 minutes, room temperature), washed (1% formaldehyde, 1% CaCl), and destained (50% ethanol, 1% acetic acid). Optical densities were read at 595 nm [21].
Western Blot Analysis
Cells (3 x 10⁵) were lysed in RIPA buffer [0°C; 20 mM Tris, pH 7.4, 137 mM 10% glycerol, 0.5% (wt/vol) sodium deoxycholate, 0.1% (wt/vol) sodium dodecyl sulfate (SDS), 1% Triton X-100, 2 mM EDTA; 200 µl of phenylmethylsulfonyl fluoride (PMSF; 1 mM), and protease inhibitor cocktail (Sigma Chemical Co.)]. Equal amounts of protein (30 µg/lane; Bradford method) were electrophoresed (15% SDS polyacrylamide gel). Blocked membranes [2% BSA in 10 mM Tris-buffered saline, 0.05% Tween (TBST) 3 hours, 24°C] were incubated overnight (4°C) with either anti-HA monoclonal antibody (HA.11, 1:1000; Covance, Inc., Berkeley, CA), anti-GFP rabbit polyclonal antibody (1:5000; Abcam Ltd., Cambridge Science Park, UK), or anti-actin polyclonal antibody (1:1000; Sigma Chemical Co.). Membranes were washed (x3) with TBST and incubated with horseradish peroxidase-labeled antibodies (1: 10,000; Zymed, Inc., San Francisco, CA).
MRI of Cell Suspension
Cells were suspended in 0.2 ml of agarose (1% in PBS) in triplicates in a 96-well plate (2.5 x 10⁵ cells/well). R1 and R2 relaxation rates were determined from spin-echo images at 4.7 T on a horizontal Bruker Biospec spectrometer (Bruker, Karlsruhe, Germany) using a birdcage excitation coil (R1: 12 repetition times: 5000, 2000, 1000, 800, 700, 600, 500, 400, 300, 200, 100, and 50 milliseconds; TE 10 milliseconds; R2: multiecho spin echo; TR 5000 milliseconds; eight echo times: 10, 20, 30, 40, 50, 60, 70, and 80 milliseconds; two averages; spectral width 50,000 Hz; matrix 128 x 128; FOV 40 x 40 mm). A horizontal slice was selected using orthogonal images, through the center of the cell suspension of all wells (2 mm slice thickness at the center of 6 mm in each well).
In Vivo MRI
Animal experiments were approved by the Weizmann Institutional Animal Care and Use Committee. C6-TET-EGFP-HA-ferritin cells were inoculated (subcutaneously; 106 cells/mouse) in the hind limb of CD1-nude mice (females, 6–10 weeks, 28–30 g). Ferritin overexpression was suppressed by addition of TET to the drinking water [+Tet, Tevacycline; 0.5 mg/ml and 3% sucrose, three times a week starting 2 days before inoculation; Teva Pharmaceutical Industries Ltd., Petah Tikva, Israel) or kept on (-Tet; 3% sucrose only). Three experiments were conducted (-Tet, n = 12; +Tet, n = 15). Mice were imaged once in two experiments and three times in the third experiment, when tumor diameter was 4 to 6 mm.
MRI was acquired at 4.7 T using birdcage excitation coil and actively decoupled 1.5-cm surface detection coil. Anesthesized mice (ketamine 75 mg/kg ip; Fort Dodge Animal Health, Fort Dodge, IA; xylazine 3 mg/kg; Vitamed Ltd., Bat Yam, Israel) were positioned with the tumor centered on the surface coil. Coronal single-slice spin echo images were selected on orthogonal images through the center of the tumor (R1: five repetition times: 2000, 1000, 500, 200, and 100 milliseconds; TE 20 milliseconds; R2: multiecho spin echo; TR 2000; four echo times: 20, 40, 60, and 80 milliseconds; two averages; spectral width 50,000 Hz;, FOV 20 x 20 mm; slice thickness 1 mm; matrix 128 x 128; in-plane resolution 156 µm).
Analysis of MRI Data
Images were zero-filled to 256 x 256 so as to improve spatial resolution by reducing partial volume artifacts [22]. Pixel-by-pixel single exponential fits of signal intensity (I) as a function of TR or TE were done to generate longitudinal (R1) and transverse (R2) relaxation maps, respectively (MATLAB software; MathWorks, Inc. Hill Drive, Natick, MA):
Changes in relaxation rates were determined by selection of a region of interest (for tumors or cell suspension) on the relaxation maps. Data are presented as mean ± SD of all data points. P values reported were derived by unpaired, two-tailed Student's t test analysis.
Analysis of Gene Expression in Tumors
Total EGFP fluorescence was determined on formaldehyde-fixed whole tumors. Histologic tumor sections were stained for HA-ferritin using fluorescein-labeled anti-HA antibody [1:50, 1 hour; HA.11 monoclonal antibody (Covance, Inc.) labeled with 5(6)-carboxyfluorescein, succinimidyl ester; Molecular Probes, Inc., Eugene, OR], and for EGFP using biotinylated goat anti-GFP antibody (1:100, 1 hour; Abcam Ltd.) and ABC reagent (Vector Laboratories, Inc. Burlingame, CA), visualized using DAB (Bio-Rad Laboratories, Hercules, CA).
Determination of Intracellular Iron Content
Inductively coupled plasma atomic emission spectrometry [ICP-AES; Optima 3300, Perkin-Elmer, Boston, MA) was used to determine iron content in C6 cells (106 per sample; +/-Tet; suspended in 50 µl of HNO3, 1 hour at 90°C and diluted in 2 ml of DDW). In addition, intracellular iron was stained with Prussian Blue (Sigma Chemical Co.).
Results
Overexpression of Ferritin H-Chain Leads to Elevated Intracellular Iron Content
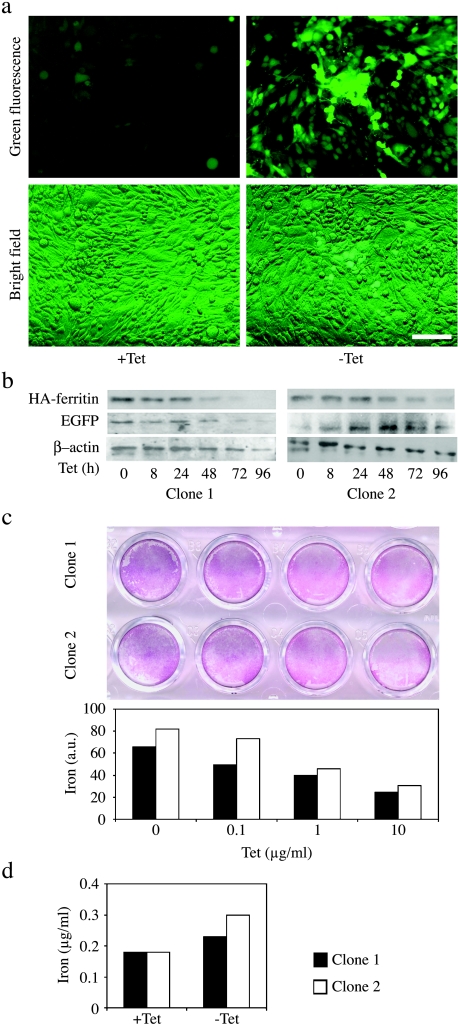
C6 rat glioma cells were transfected to express the murine H-chain of ferritin under TET regulation. Two clones (cloned 1 and 2) were selected, in which significant overexpression of both HA-tagged ferritin (HA-ferritin) and EGFP could be effectively suppressed by TET (C6-TET-EGFP-HA-ferritin; Figure 2). Thus, both EGFP and HA tag could be used for independent validation of the expression of the transgene. The cells were cultured in the absence or presence of TET, and activation of expression of the transgene was initially evaluated by fluorescence microscopy of EGFP (Figure 2a). Western blot analysis of the HA-ferritin showed silencing of overexpression on addition of TET, in a time-dependent manner and in correlation with EGFP expression level (Figure 2b). The impact of ferritin overexpression on iron balance was assessed by ICP-AES and Prussian Blue staining (Figure 2, c and d). Staining cells with Prussian Blue showed a dose-dependent suppression of iron uptake by TET (Figure 2c). Intracellular iron uptake in response to overexpression of ferritin, in the absence of TET, was confirmed by ICP-AES analysis, showing a large rise of 27% and 66% in intracellular iron content for clones 1 and 2, respectively (Figure 2d).
Figure 2.
TET-regulated expression of EGFP-HA-ferritin in C6 rat glioma cells augments iron uptake. (a) C6-TET-EGFP-HA-ferritin cells (clone 2) were grown in culture plates in the presence or absence of TET (48 hours; 1 µg/ml). Confluent cell layers were examined for EGFP fluorescence (upper panel) and in combination with bright field (lower panel). Scalebar = 50 µm. (b) Time-dependent expression of EGFP and HA-ferritin in C6 cells as a response to TET switch (1 µg/ml) was determined by Western blot analysis. β-Actin was used to normalize protein amounts. (c) Prussian Blue analysis of dose-dependent TET-induced (48 hours) iron uptake into the cells. Staining intensity was quantified by NIH image. (d) Quantification of intracellular iron content by ICP-AES (1 µg/ml; 48 hours). Close and open bars represent clones 1 and 2, respectively.
Overexpression of Ferritin H-Chain Does Not Affect Cell Proliferation
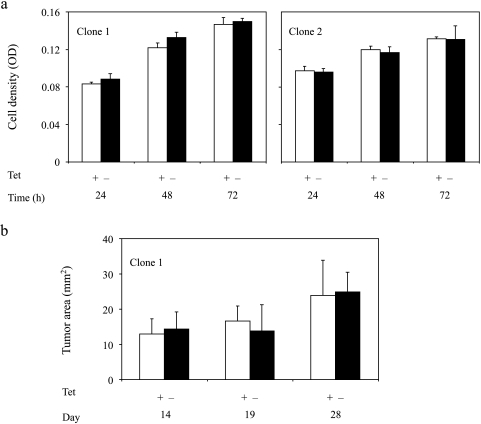
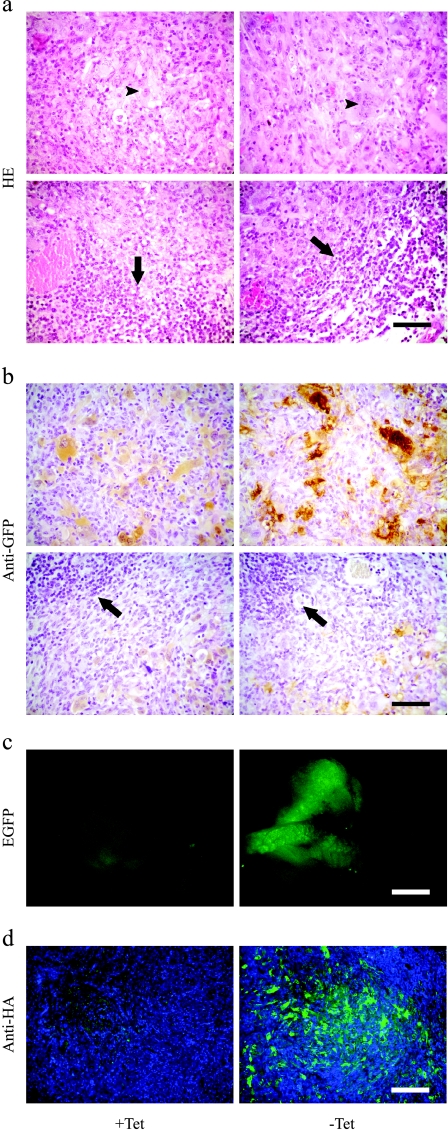
The impact of ferritin overexpression was evaluated by checking cell proliferation and viability in vitro and tumor progression in vivo as well as by histologic evaluation of tumor specimens. Addition of TET followed by suppression of ferritin overexpression did not cause any significant change in the rate of cell proliferation up to 72 hours (Figure 3). In vivo tumor progression appeared similar in mice supplied either with TET and sucrose in the drinking water or in mice supplied only with sucrose (Figure 3). Hematoxylin-eosin-stained histologic sections showed prevalence of multinucleated giant tumor cells and, in the rim of some tumors, also infiltration of inflammatory cells, mainly lymphocytes and neutrophils. The tumors were highly vascular, showing a high fraction of stroma endothelial cells. No detectable pathologic differences were associated with expression of the transgene (Figure 4a).
Figure 3.
Expression of ferritin does not affect the growth of C6-TET-EGFP-HA-ferritin cells in vitro or in vivo. (a) In vitro growth rate of C6-TET-EGFP-HA-ferritin cells cultured in the absence or presence of TET (1 µg/ml; up to 72 hours) calculated using neutral red assay (n = 3-5; mean ± SD). (b) In vivo growth rate of C6-TET-EGFP-HA-ferritin tumors measured from MR images. C6-TET-EGFP-HA-ferritin cells (clone 1) were inoculated in the hind limb of nude mice and the mice were supplied with TET and sucrose (n = 7; or sucrose only, n = 4) in drinking water for 4 weeks (mean ± SD).
Figure 4.
TET-regulated overexpression of EGFP-HA-ferritin in tumors. C6-TET-EGFP-HA-ferritin cells (clone 1) were inoculated in the hind limb of nude mice. TET and sucrose (or sucrose only) were supplied in drinking water and the tumors were retrieved for histology at the end of 4 weeks. (a) Histologic sections stained with hematoxylin-eosin. Multinucleated giant tumor cells (arrowheads) and infiltrating inflammatory cells at the tumor rim (arrows) are indicated. (b) Histologic sections stained with anti-GFP polyclonal antibody (brown), counterstained with hematoxylin. (c) Expression of EGFP in subcutaneous tumors and skin whole mounts visualized by fluorescent microscopy. (d) Histologic sections stained with fluorescent anti-HA antibody (green) and nuclear stain (Hoechst, Molecular Probes, Inc., Eugene, OR; blue). Scalebar = 50 µm (a and b), 1 mm (c), and 200 µm (d).
TET-Regulated Overexpression of Ferritin H-Chain Is Detectable in Tumor Samples
Subcutaneous C6-TET-EGFP-HA-ferritin tumors examined ex vivo by fluorescence microscopy and immunohistochemistry staining of EGFP showed a significant difference in expression of EGFP, consistent with the effect of the TET switch (Figure 4, b and c). Fluorescence intensity was suppressed by addition of TET to the drinking water (Figure 4c). Staining of histologic sections with anti-GFP antibodies as well as staining of the HA-tagged ferritin revealed that administration of TET switched off the expression of the transgene (Figure 4, b and d). However, overexpression in the absence of TET was not observed uniformly in all tumor cells. Expression was particularly elevated in the multinucleated giant tumor cells. HA tag or EGFP-stained cells occupied less than 10% of the tumors not treated with TET. As expected, infiltrating tumor stroma cells did not express the transgene. The fraction of labeled cells was similar in tumors of TET-treated mice, but the level of expression in these cells was significantly reduced (Figure 4, b and d).
Overexpression of Ferritin H-Chain Is Detectable by MRI In Vitro
The sensitivity for the detection of expression of the transgene by MRI depends on the density of the expressing cells, the level of expression, and the corresponding changes in iron content. Although the significant change in expression level and the robust change in iron content were encouraging, the very low percentage of cells showing a high expression in tumors provided a challenge for detection by MRI. We thus tested the ability to detect changes in MRI relaxation rates in cell suspensions using a low density of cells (2.5 x 10⁵ cells suspended in 0.2 ml of agarose). This cell density is 40-fold lower than previously reported for in vitro MR detection of TET-regulated expression of tyrosinase [11].
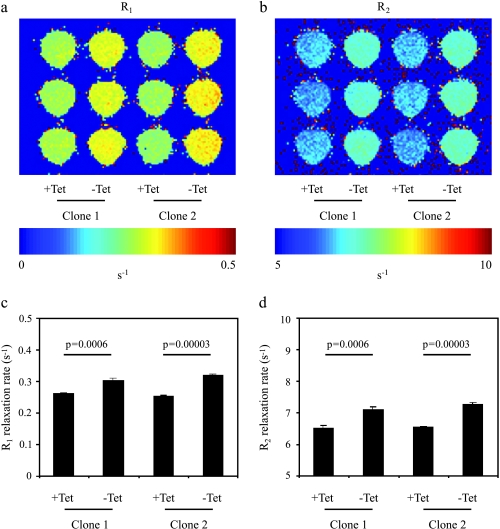
In vitro MRI analysis of longitudinal (R1) and transverse (R2) relaxation rates of cell suspensions showed highly significant changes with administration of TET (Figure 5). The enhanced relaxation rate in the absence of TET was consistent with induced expression of the transgene and with the measured increase in intracellular iron (Figure 2). Thus, both clones revealed that R1 and R2 were significantly elevated in the absence of TET, and were lower when cells were treated with TET, thereby suppressing overexpression of the transgene (two-tailed unpaired, P % .0006). These results demonstrate the high sensitivity of MRI relaxation rates and ferritin as a reporter, which can be utilized for the detection of changes in gene expression even at very low cell density.
Figure 5.
In vitro MRI detection of switchable ferritin expression in C6 rat glioma cells. (a and b) R1 and R2 relaxation rate maps of C6-TET-EGFP-HA-ferritin cell samples suspended in agarose and placed in a 96-well plate. Two clones are shown incubated with and without TET (5 days; 1 µg/ml). (c and d) Relaxation rates derived from the R1 and R2 maps (mean ± SD; n = 3, P values: two-tailed unpaired t-test).
In Vivo MRI Detection of TET-Induced Expression of Ferritin H-Chain in Tumors
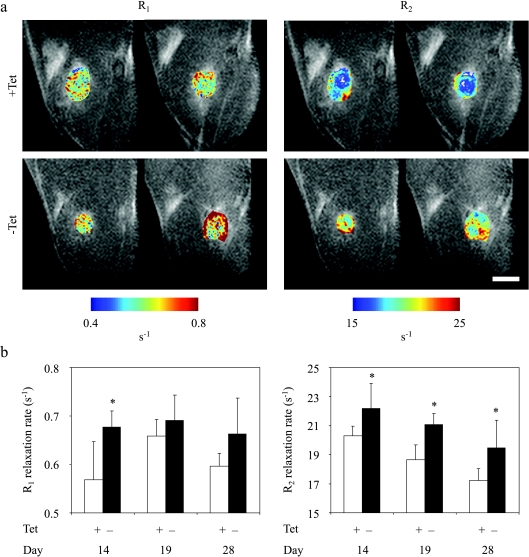
In order to determine the ability to detect changes in relaxivity associated with induced gene expression in vivo, C6-TET-EGFP-HA-ferritin cells were inoculated subcutaneously in CD-1 nude mice. TET was supplied in the drinking water in order to suppress the overexpression of EGFP and ferritin in the tumor (+Tet), whereas the transgene was overexpressed in the absence of TET (-Tet). In three different experiments, both R1 and R2 relaxation rates were elevated in the ferritin-overexpressing tumors (-Tet). An example of one study is presented in Figure 6 for four transgene-expressing (-Tet) mice and seven mice in which transgene expression was suppressed (+Tet; Figure 6). R1 was significantly elevated at early stages of tumor growth, whereas R2 was significantly increased by switching on the expression of the transgene throughout the course of tumor growth (two-tailed unpaired, P < .05; Figure 6).
Figure 6.
In vivo MRI detection of switchable ferritin expression in C6 tumors. MRI of ferritin-expressing tumors at different times after inoculation of C6-TET-EGFP-HA-ferritin tumor cells (clone 1) in the hind limb of nude mice. TET and sucrose (or sucrose only) were supplied in drinking water, starting 2 days before inoculation. (a) R1 and R2 maps of tumor regions overlaid on the MR images are shown for two representative mice from each group. (b) R1 and R2 values (mean ± SD) at the tumor region in the presence (ferritin off; n = 7) or absence (ferritin on; n = 4) of TET in drinking water. All four -Tet mice were imaged three times each (on days 14, 19, and 28 after tumor inoculation). All seven +Tet mice were imaged on the first (day 14) and second (day 19) MRI sessions, and five of these mice were scanned also on the third (day 28) session. *P < .05: two-tailed unpaired t-test. Scalebar = 2.5 mm.
Discussion
A number of MRI reporters of gene expression were published so far, all of which were dependent on exogenous contrast agents for generation of detectable contrast changes [1–7,10,11]. In the study reported here, the H-chain of ferritin was applied as the first endogenous intracellular reporter of gene expression that is detectable by MRI, both in vitro (in cell suspensions) and in vivo (in solid tumors). In both cases, no administration of exogenous contrast agents was required.
Independent validation of MRI reporters is important due to the indirect detection of contrast changes in MRI that depend on changes in the relaxation rates of the abundant water signal. To gain such a validation, expression of both EGFP and HA-tagged ferritin was placed under a tight TET switchable promoter using a bidirectionally expression vector. Thus, independent detection and cross-validation of changes in the expression of the reporter transgene were provided by measurements of fluorescence and MR relaxation rates in genetically identical cells or tumors. Sensitivity for detection of ferritin was high; thus, TET withdrawal and activation of ferritin expression resulted in significant changes in relaxation rates even for very low densities of cells.
The use of ferritin as a reporter for MRI is based on the hypothesis that sensitivity for the detection of ferritin overexpression by MRI would be enhanced by redistribution of intracellular iron as well as by a physiological response leading to net intracellular iron uptake. The bases for this work are previous studies that demonstrated the ferroxidation reaction catalyzed by the ferritin H-chain [16,23]; the anomalies of ferritin relaxivity, which is particularly high for ferritin at low iron loading [19,24–26]; and the demonstration of redistribution of iron between ferritin molecules [27]. In addition to that, induction of iron deficiency mechanisms in cells exposed to overexpression of H-ferritin was reported, including induced expression of transferrin receptor and increased iron uptake [16].
The anomalous relaxivity of ferritin has been well characterized [19,24–26]. Although ferritin can carry a core of a few thousand iron atoms, detailed studies by Vymazal et al. [25,26] revealed maximal relaxivity at a very low loading factor of 13 ± 14 iron atoms per molecule These results imply that induced expression of apoferritin could result in alterations of R1 and R2 relaxation rates and thus lead to changes in MRI contrast, even in the absence of a change in total intracellular iron content, provided that redistribution of iron between ferritin complexes is possible. Indeed, migration of iron atoms that are not incorporated into mature ferrihydrite particles between ferritin molecules was demonstrated by Mossbauer spectroscopy [27]. The higher sensitivity of R2 relative to R1 for the detection of ferritin expression, as reported here, and the corresponding larger variability in R1 are in accord with the mechanism of relaxivity and previous studies of ferritin suspension [28].
However, the effects of overexpression of ferritin on MR contrast are not limited to the redistribution of iron. In fact, as shown here, overexpression of ferritin resulted in a significant increase in net intracellular iron content, which was detected by Prussian Blue staining and ICP-AES. The compensation for ferritin expression by augmented iron uptake is consistent with previous reports that overexpression of the ferritin H-chain induced expression of transferrin receptor and increased iron uptake [16].
The nonuniform relaxation rates in the tumor are consistent with the variable degree of transgene expression as seen by immunohistochemistry. It should be noted that relaxation rates include contribution from other factors, in addition to ferritin. Selection of ferritin contribution could perhaps be facilitated by its unique field dependence [29].
One of the requirements from a reporter is that it will have minimal impact on the studied process. Due to the high reactivity of iron, particularly in oxygenated environment, homeostasis of intracellular iron is fine-tuned by a panel of iron-regulated genes whose expression and stability are regulated at the mRNA level through specific iron response elements [30–32]. Ferritin expression is typically induced in the presence of elevated levels of iron; its expression is suppressed, whereas expression of transferrin receptor is induced in iron deficiency. The observed increase in iron content suggested that cells were able to compensate for iron chelation into ferritin by inducing iron uptake. It is important to note that overexpression of ferritin, whose role is to detoxify free iron by its sequestration, is expected to produce less undesirable physiological effects than overexpression of transferrin receptor, a previously published MR reporter that could elevate the level of reactive soluble iron in cells [2]. Overexpression of ferritin in an iron-independent manner could result in iron deficiency, and accordingly, affect cell proliferation; however, as shown here, overexpression of H-ferritin did not alter growth rate in vitro or in vivo. These results are in line with previous studies of MEL cells [33] but in contrast to studies of HeLa cells [16], suggesting variability among cells in sensitivity to changes in iron homeostasis.
The high sensitivity for detection of ferritin by MRI is manifested by the fact that the number of cells that we were able to detect in vitro was 40-fold lower than that reported for TET-regulated expression of tyrosinase [11]. Furthermore, it should be noted that tyrosinase contrast was detectable only after supplementation of exogenously administered iron, whereas ferritin contrast reported here was endogenous and was achieved with no exogenously administered contrast agents. Thus, despite the low fraction of transgene-expressing cells within subcutaneous tumors, the change in relaxation rate was significant and was detectable throughout tumor progression. Combination of ferritin expression with HA-tag and EGFP as reported here provides a means for independent validation and complementary analysis by optical imaging.
In summary, the results presented here demonstrate that the use of ferritin as a reporter for in vivo mapping of gene expression by MRI is feasible. The first demonstration of this approach, as reported here for tumors, may aid the tracking of tumor cell migration. However, this approach could open many additional exciting possibilities for studying the activation of genes during development and in disease models, as well as for specific labeling of cells for tracking cell recruitment and migration. The use of endogenous reporter gene as developed here would be particularly beneficial in those cases where administration of contrast material is compromised by barriers, including embryonic development and the central nervous system.
Footnotes
This work was supported by a grant from the Israel Science Foundation (to M.N.) and, in part, by the Forchheimer Center for Molecular Genetics (to M.N. and B.C.).
We would like to dedicate this study to the memory of the late Dr. Yoav Citri, whose vision led to this work.
References
- 1.Sipkins DA, Cheresh DA, Kazemi MR, Nevin LM, Bednarski MD, Li KC. Detection of tumor angiogenesis in vivo by alphaVbeta3-targeted magnetic resonance imaging. Nat Med. 1998;4:623–626. doi: 10.1038/nm0598-623. [DOI] [PubMed] [Google Scholar]
- 2.Weissleder R, Moore A, Mahmood U, Bhorade R, Benveniste H, Chiocca EA, Basilion JP. In vivo magnetic resonance imaging of transgene expression. Nat Med. 2000;6:351–355. doi: 10.1038/73219. [DOI] [PubMed] [Google Scholar]
- 3.Winter PM, Morawski AM, Caruthers SD, Fuhrhop RW, Zhang H, Williams TA, Allen JS, Lacy EK, Robertson JD, Lanza GM, Wickline SA. Molecular imaging of angiogenesis in early-stage atherosclerosis with alpha(v)beta3-integrin-targeted nanoparticles. Circulation. 2003;108:2270–2274. doi: 10.1161/01.CIR.0000093185.16083.95. [DOI] [PubMed] [Google Scholar]
- 4.Artemov D, Mori N, Ravi R, Bhujwalla ZM. Magnetic resonance molecular imaging of the HER-2/neu receptor. Cancer Res. 2003;63:2723–2727. [PubMed] [Google Scholar]
- 5.Kircher MF, Josephson L, Weissleder R. Ratio imaging of enzyme activity using dual wavelength optical reporters. Mol Imaging. 2002;1:89–95. doi: 10.1162/15353500200201124. [DOI] [PubMed] [Google Scholar]
- 6.Ray P, Wu AM, Gambhir SS. Optical bioluminescence and positron emission tomography imaging of a novel fusion reporter gene in tumor xenografts of living mice. Cancer Res. 2003;63:1160–1165. [PubMed] [Google Scholar]
- 7.Louie AY, Huber MM, Ahrens ET, Rothbacher U, Moats R, Jacobs RE, Fraser SE, Meade TJ. In vivo visualization of gene expression using magnetic resonance imaging. Nat Biotechnol. 2000;18:321–325. doi: 10.1038/73780. [DOI] [PubMed] [Google Scholar]
- 8.Brosnan MJ, Raman SP, Chen L, Koretsky AP. Altering creatine kinase isoenzymes in transgenic mouse muscle by overexpression of the B subunit. Am J Physiol. 1993;264:C151–C160. doi: 10.1152/ajpcell.1993.264.1.C151. [DOI] [PubMed] [Google Scholar]
- 9.Stegman LD, Rehemtulla A, Beattie B, Kievit E, Lawrence TS, Blasberg RG, Tjuvajev JG, Ross BD. Noninvasive quantitation of cytosine deaminase transgene expression in human tumor xenografts with in vivo magnetic resonance spectroscopy. Proc Natl Acad Sci USA. 1999;96:9821–9826. doi: 10.1073/pnas.96.17.9821. [DOI] [PMC free article] [PubMed] [Google Scholar]
- 10.Weissleder R, Simonova M, Bogdanova A, Bredow S, Enochs WS, Bogdanov A., Jr MR imaging and scintigraphy of gene expression through melanin induction. Radiology. 1997;204:425–429. doi: 10.1148/radiology.204.2.9240530. [DOI] [PubMed] [Google Scholar]
- 11.Alfke H, Stoppler H, Nocken F, Heverhagen JT, Kleb B, Czubayko F, Klose KJ. In vitro MR imaging of regulated gene expression. Radiology. 2003;228:488–492. doi: 10.1148/radiol.2282012006. [DOI] [PubMed] [Google Scholar]
- 12.Crichton RR, Wilmet S, Legssyer R, Ward RJ. Molecular and cellular mechanisms of iron homeostasis and toxicity in mammalian cells. J Inorg Biochem. 2002;91:9–18. doi: 10.1016/s0162-0134(02)00461-0. [DOI] [PubMed] [Google Scholar]
- 13.Harrison PM, Arosio P. The ferritins: molecular properties, iron storage function and cellular regulation. Biochim Biophys Acta. 1996;1275:161–203. doi: 10.1016/0005-2728(96)00022-9. [DOI] [PubMed] [Google Scholar]
- 14.Treffry A, Zhao Z, Quail MA, Guest JR, Harrison PM. Dinuclear center of ferritin: studies of iron binding and oxidation show differences in the two iron sites. Biochemistry. 1997;36:432–441. doi: 10.1021/bi961830l. [DOI] [PubMed] [Google Scholar]
- 15.Hempstead PD, Yewdall SJ, Fernie AR, Lawson DM, Artymiuk PJ, Rice DW, Ford GC, Harrison PM. Comparison of the three-dimensional structures of recombinant human H and horse L ferritins at high resolution. J Mol Biol. 1997;268:424–448. doi: 10.1006/jmbi.1997.0970. [DOI] [PubMed] [Google Scholar]
- 16.Cozzi A, Corsi B, Levi S, Santambrogio P, Albertini A, Arosio P. Overexpression of wild type and mutated human ferritin H-chain in HeLa cells: in vivo role of ferritin ferroxidase activity. J Biol Chem. 2000;275:25122–25129. doi: 10.1074/jbc.M003797200. [DOI] [PubMed] [Google Scholar]
- 17.Argyropoulou MI, Kiortsis DN, Efremidis SC. MRI of the liver and the pituitary gland in patients with beta-thalassemia major: does hepatic siderosis predict pituitary iron deposition? Eur Radiol. 2003;13:12–16. doi: 10.1007/s00330-002-1421-3. [DOI] [PubMed] [Google Scholar]
- 18.Bartzokis G, Tishler TA. MRI evaluation of basal ganglia ferritin iron and neurotoxicity in Alzheimer's and Huntingon's disease. Cell Mol Biol (Noisy-le-Grand) 2000;46:821–833. [PubMed] [Google Scholar]
- 19.Gottesfeld Z, Neeman M. Ferritin effect on the transverse relaxation of water: NMR microscopy at 9.4 T. Magn Reson Med. 1996;35:514–520. doi: 10.1002/mrm.1910350410. [DOI] [PubMed] [Google Scholar]
- 20.Herynek V, Bulte JW, Douglas T, Brooks RA. Dynamic relaxometry: application to iron uptake by ferritin. J Biol Inorg Chem. 2000;5:51–56. doi: 10.1007/s007750050007. [DOI] [PubMed] [Google Scholar]
- 21.Borenfreund EPJ. Cytotoxicity of metals, metal-metal and metal-chelator combinations assayed in vitro. Toxicology. 1986;39:121–134. doi: 10.1016/0300-483x(86)90130-7. [DOI] [PubMed] [Google Scholar]
- 22.Du YP, Parker DL, Davis WL, Cao G. Reduction of partial-volume artifacts with zero-filled interpolation in three-dimensional MR angiography. J Magn Reson Imaging. 1994;4:733–741. doi: 10.1002/jmri.1880040517. [DOI] [PubMed] [Google Scholar]
- 23.Bauminger ER, Harrison PM, Hechel D, Hodson NW, Nowik I, Treffry A, Yewdall SJ. Iron (II) oxidation and early intermediates of iron-core formation in recombinant human H-chain ferritin. Biochem J. 1993;296(Part 3):709–719. doi: 10.1042/bj2960709. [DOI] [PMC free article] [PubMed] [Google Scholar]
- 24.Gossuin Y, Roch A, Muller RN, Gillis P, Lo Bue F. Anomalous nuclear magnetic relaxation of aqueous solutions of ferritin: an unprecedented first-order mechanism. Magn Reson Med. 2002;48:959–964. doi: 10.1002/mrm.10316. [DOI] [PubMed] [Google Scholar]
- 25.Vymazal J, Brooks RA, Bulte JW, Gordon D, Aisen P. Iron uptake by ferritin: NMR relaxometry studies at low iron loads. J Inorg Biochem. 1998;71:153–157. doi: 10.1016/s0162-0134(98)10047-8. [DOI] [PubMed] [Google Scholar]
- 26.Vymazal J, Zak O, Bulte JW, Aisen P, Brooks RA. T1 and T2 of ferritin solutions: effect of loading factor. Magn Reson Med. 1996;36:61–65. doi: 10.1002/mrm.1910360111. [DOI] [PubMed] [Google Scholar]
- 27.Bauminger ER, Treffry A, Hudson AJ, Hechel D, Hodson NW, Andrews S, Levi S, Nowik I, Arosio P, et al. Iron incorporation into ferritins: evidence for the transfer of monomeric Fe(III) between ferritin molecules and for the formation of an unusual mineral in the ferritin of Escherichia coli. Biochem J. 1994;302(Part 3):813–820. doi: 10.1042/bj3020813. [DOI] [PMC free article] [PubMed] [Google Scholar]
- 28.Wood JC, Fassler JD, Meade T. Mimicking liver iron overload using liposomal ferritin preparations. Magn Reson Med. 2004;51:607–611. doi: 10.1002/mrm.10735. [DOI] [PMC free article] [PubMed] [Google Scholar]
- 29.Bartzokis G, Aravagiri M, Oldendorf WH, Mintz J, Marder SR. Field dependent transverse relaxation rate increase may be a specific measure of tissue iron stores. Magn Reson Med. 1993;29:459–464. doi: 10.1002/mrm.1910290406. [DOI] [PubMed] [Google Scholar]
- 30.Rouault T, Klausner R. Regulation of iron metabolism in eukaryotes. Curr Top Cell Regul. 1997;35:1–19. doi: 10.1016/s0070-2137(97)80001-5. [DOI] [PubMed] [Google Scholar]
- 31.Klausner RD, Rouault TA, Harford JB. Regulating the fate of mRNA: the control of cellular iron metabolism. Cell. 1993;72:19–28. doi: 10.1016/0092-8674(93)90046-s. [DOI] [PubMed] [Google Scholar]
- 32.Theil EC. Ferritin: at the crossroads of iron and oxygen metabolism. J Nutr. 2003;133:1549S–1553S. doi: 10.1093/jn/133.5.1549S. [DOI] [PubMed] [Google Scholar]
- 33.Picard V, Renaudie F, Porcher C, Hentze MW, Grandchamp B, Beaumont C. Overexpression of the ferritin H subunit in cultured erythroid cells changes the intracellular iron distribution. Blood. 1996;87:2057–2064. [PubMed] [Google Scholar]


