Abstract
In the simple, helical, wall-less bacterial genus Spiroplasma, chemotaxis and motility are effected by a linear, contractile motor arranged as a flat cytoskeletal ribbon attached to the inner side of the membrane along the shortest helical line. With scanning transmission electron microscopy and diffraction analysis, we determined the hierarchical and spatial organization of the cytoskeleton of Spiroplasma citri R8A2. The structural unit appears to be a fibril, ∼5 nm wide, composed of dimers of a 59-kDa protein; each ribbon is assembled from seven fibril pairs. The functional unit of the intact ribbon is a pair of aligned fibrils, along which pairs of dimers form tetrameric ring-like repeats. On average, isolated and purified ribbons contain 14 fibrils or seven well-aligned fibril pairs, which are the same structures observed in the intact cell. Scanning transmission electron microscopy mass analysis and sodium dodecyl sulfate-polyacrylamide gel electrophoresis of purified cytoskeletons indicate that the 59-kDa protein is the only constituent of the ribbons.
The mollicutes (Spiroplasma, Mycoplasma, and Acholeplasma spp.) are the smallest and simplest free-living and self-replicating forms of life. The mollicutes evolved by regressive evolution and genome reduction from the genus Clostridium (for a review, see reference 15). The reduced genome of the mollicutes yields a minimal inventory of cellular components and extreme structural simplicity. Nonetheless, the cells have a well-defined shape, are chemotactic and motile, and demonstrate a variety of cell movements and dynamic morphologies. For example, mycoplasmas and acholeplasmas glide on solid and semisolid surfaces, while the spiroplasmas (2) are free swimmers (for a review, see reference 11).
The mollicutes lack cell walls and flagella but have an internal, contractile cytoskeleton that functions as a linear motor (for a review, see reference 20). The spiroplasmas have a particularly unique cellular geometry, such that the Spiroplasma cell can be viewed as a membranous tube to which a flat cytoskeletal ribbon of parallel fibrils is attached along the shortest helical line on the inner surface of the cellular tube. Both tube and cytoskeleton are mutually coiled into a dynamic helix, the latter driving the former. The cytoskeletal ribbon functions as a linear motor by differentially changing the length of its fibril components (21).
The genus Spiroplasma was first described by Saglio et al. (16). Williamson (25) and Williamson and Whitcomb (26) reported the isolation of Spiroplasma cytoskeletons by cell lysis and detergent extraction. It has also been shown that cytoskeletons can be released from Spiroplasma cells by repeated freezing and thawing (19). Further electron microscopy studies on Spiroplasma spp. (4, 5, 17, 27) led to a model of a flat, polar, dense cytoskeletal ribbon ∼94 nm wide attached to the inner surface of the cell membrane and constructed from ∼4.5- to 5.0-nm-diameter fibrils with an ∼9-nm repeat. The cytoskeleton accounts for ∼1% of the total cellular proteins in Spiroplasma spp. (19). In Spiroplasma citri, the subunit of the cytoskeletal fibrils contains 515 amino acids, as deduced by sequencing the cell's fib gene (28), with a molecular mass of 59 kDa.
Recently, cryoelectron microscopy studies have been performed on whole Spiroplasma cells and their cytoskeletal components (21). In whole cryo-fixed and freeze-substituted cells and in individually lysed cells, the cytoskeleton consistently appears as a seven-membered ribbon constructed from pairs of fibrils. In low-electron-dose images of both negatively stained and vitrified specimens, isolated ribbons as well as fibril pairs exhibit ring-like substructures consistent with a tetrameric arrangement of subunits. It was found that when applying mild extraction and purification procedures and sodium dodecyl sulfate-polyacrylamide gel electrophoresis (SDS-PAGE) with silver staining, a consistent group of polypeptides copurify with the cytoskeleton. It is not clear whether these components are integral ribbon proteins. These findings, along with previous results, raise the question of what constitutes the basic structural and functional unit of the contractile cytoskeletal ribbon.
We approached this question by analyzing whole, exhaustively purified ribbons as well as the products of their disassembly by scanning transmission electron microscopy (STEM) (24) and negative-stain transmission electron microscopy with computed diffractogram analysis. STEM provides mass-per-length values, which reveal the hierarchical organization of subunits in the fibrils and the organization of fibrils in the ribbons. Diffraction analysis provides complementary information about the spacing of subunits and fibrils.
MATERIALS AND METHODS
Strains.
S. citri R8A2 was used in this study because its fib gene has been fully sequenced (28). Mass and structural analyses were also performed on Spiroplasma melliferum BC3; the results were similar to those for S. citri.
Media and growth conditions.
S. citri R8A2 cells were grown in the following growth medium, containing (per liter) 4 g of fructose, 60 g of sucrose, 0.4 g of KCl, 0.3 g of KH2PO4, 0.2 g of MgSO4 · 7H2O, 1.4 g of NaCl, 0.5 g of Na2SO3, 0.6 g of arginine, 0.6 g of asparagine, 0.4 g of cysteine, 0.6 g of glutamine, 0.4 g of methionine, 0.4 g of α-ketoglutarate, 0.4 g of pyruvate, 15 g of HEPES, 2 ml of 2% yeastolate, 100 ml of fetal bovine serum, 2.5 ml of 5% thallium acetate, 300,000 U of penicillin, and 5 ml of 5% phenol red. The pH was adjusted to 7.6. Typically, 500-ml stationary cultures were grown at 30°C for 24 to 36 h in the dark. Spiroplasma melliferum BC3 was grown as described by Trachtenberg and Gilad (21).
Cytoskeleton isolation and purification.
Spiroplasma citri R8A2 or Spiroplasma melliferum BC3 cells were centrifuged in a Sorvall SS-34 rotor (4°C, 15,000 rpm, 30 min). The pellets were rinsed in Tris buffer (10 mM, pH 7.6) containing 400 mM NaCl. The pellets were lysed in 100 volumes of 10 mM Tris buffer, pH 7.6, containing 1% Triton X-100, 1% sodium deoxycholate, and 2 M glycerol. Mg2+ (1 to 10 mM) and DNase (50 μg/ml) were added to digest the released DNA. A commercial mixture of protease inhibitors (Complete-Mini; Boehringer) was added at one tablet per 10 ml of lysate. The lysing suspension was stirred at room temperature for 3 to 5 h and at 4°C for an additional 18 to 24 h.
The lysate was centrifuged in a Beckmann TI60 rotor (4°C, 100,000 × g, 120 min), and the pellet, containing the insoluble cell fractions, was rinsed in Tris-EDTA buffer (TE: 10 mM Tris, 10 mM EDTA, pH 7.6) to remove Mg2+ (added to enhance DNA digestion). Cells were suspended by stirring at 4°C for at least 24 h in 500 μl of TE containing 1 M KCl (TEK). Prolonged suspension in TEK under continuous stirring (up to a week) improved the disintegration of the cytoskeletal ribbons into individual fibrils.
The cytoskeleton suspension in TEK was layered onto preformed 15% to 60% metrizamide gradients in TE buffer and centrifuged in a Beckman SW55 rotor (20°C, 100,000 × g, 120 min). The recovered bands were suspended in 25 ml of TE buffer and sedimented in a Beckmann TI60 rotor (4°C, 100,000 × g, 120 min). The pellet was resuspended in 250 μl of TE. Prolonged stirring (for up to a month) at 4°C in sealed, sterile tubes increased the disassembly of the cytoskeletal ribbons into individual fibrils. The sharp bands recovered from the metrizamide gradient were subjected to standard SDS-12% PAGE with Coomassie blue staining. Markers of 26, 33, 46, 85, and 118 kDa (Fermentas/MBI) were used.
Electron microscopy.
Uniformly thin (∼3-nm) carbon films were evaporated onto cleaved mica, floated off in deionized water, and picked up on lacy Formvar-carbon films (EM Sciences) supported on 200-mesh copper grids. The grids were glow discharged in air before applying 5-μl drops of the protein at a concentration of ∼1 μg/μl for periods of 4 min. Specimens were negatively stained with methylamine vanadate (NanoVan; Nanoprobes Inc.) (9). Digital images were recorded with an FEI CM120 transmission electron microscope equipped with a Gatan GIF100 postcolumn energy filter incorporating a cooled 1,024 by 1,024 pixel charge-coupled device camera (8, 12) and Gatan Digital Micrograph image analysis software. The pixel size of the charge-coupled device camera was 25 μm, corresponding to 0.46 nm on the specimen at a magnification of 53,000× on the viewing screen of the microscope.
STEM.
For STEM mass mapping, 5-μl aliquots of protein at a concentration of ∼1 μg/μl were applied to thin (∼3-nm) carbon films supported on lacy Formvar-carbon films over 200-mesh copper grids, as described above. Subsequently, a 2-μl aliquot of tobacco mosaic virus at a concentration of 0.4 μg/μl was injected into the drop and also allowed to adsorb for 4 min before being washed 10 times by applying drops of deionized water and drawing off the excess liquid. Grids were partially blotted to maintain a thin layer of water and were immediately plunge-frozen into liquid ethane at −180°C with a KF80 freezing device (Leica). Specimens were cryotransferred at −170°C into an HB501 STEM (Vacuum Generators Instruments) and freeze-dried by warming slowly to −100°C (13, 14). After recooling the sample to −170°C, annular dark-field images were acquired digitally at an accelerating voltage of 100 kV. Images were recorded with a Gatan DigiScan system to count single pulses from the dark-field YAG scintillator coupled to a photomultiplier.
The field emission source of the STEM provided a probe diameter of approximately 1 nm. The probe current was reduced to 2 pA, as measured by the number of electrons in the zero-loss peak of the energy-loss spectrum recorded with a Gatan DigiPEELS 766 electron spectrometer. Images containing 1,024 by 1,024 pixels were recorded with a 100-μs counting time per pixel to give an electron dose of approximately 103 electrons/nm2 and an acquisition time of 100 s. Images were recorded from 1.25-μm regions of the specimen to give a pixel size of 1.22 nm. Images were transferred to an Apple Macintosh computer and processed with the program NIH Image (available at http://rsb.info.nih.gov/nih-image/). Integrated intensities of 50-nm or 100-nm lengths of the fibrils were measured, and the average value of background intensities from two adjacent regions of the support film was subtracted. Mass-per-length values were determined by measuring integrated intensities in similar lengths of tobacco mosaic virus, which has a mass per length of 131 kDa/nm (24). Mass measurements were performed on cytoskeletal assemblies situated in specimen regions where the background was free of extraneous protein.
RESULTS AND DISCUSSION
Cytoskeleton purity.
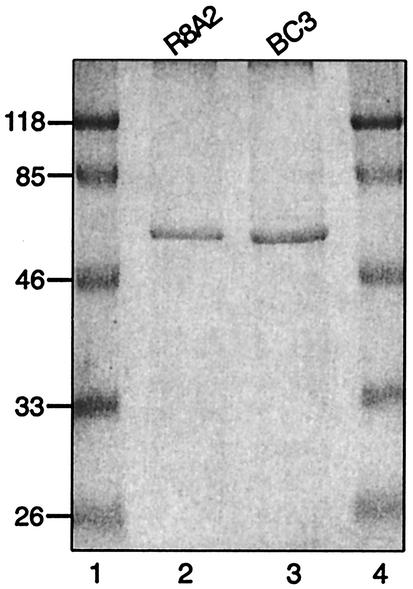
Figure 1 shows a Coomassie blue-stained SDS-PAGE gel of exhaustively purified cytoskeletons of Spiroplasma citri R8A2 and Spiroplasma melliferum BC3. The purified specimens appear as single bands of similar molecular masses (∼60 kDa), consistent with the presence of a single protein species in the cytoskeletal preparations. The purification procedures and the results are similar to those of Williamson et al. (28), indicating, together with electron microscopy (see below), the presence of only the fib gene product.
FIG. 1.
Coomassie blue-stained SDS-12% PAGE gel of exhaustively purified cytoskeletons of Spiroplasma citri R8A2 (lane 2) and Spiroplasma melliferum BC3 (lane 3). Protein markers (lanes 1 and 4) were 26, 33, 46, 85, and 118 kDa. Single bands of similar molecular masses (∼60 kDa) suggest the presence of a single protein species (the fib gene product) in the cytoskeletal preparations.
Diffraction analysis of cytoskeletal ribbons and fibrils.
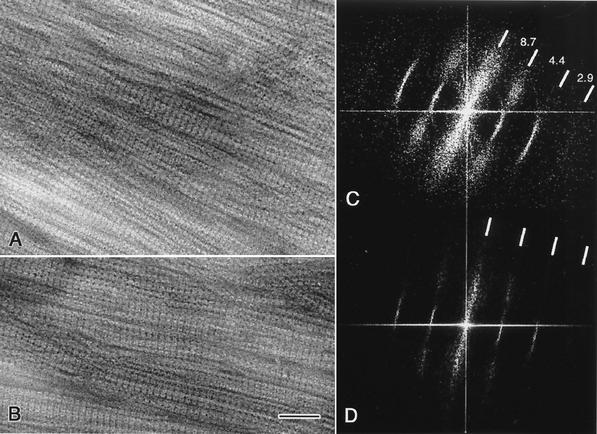
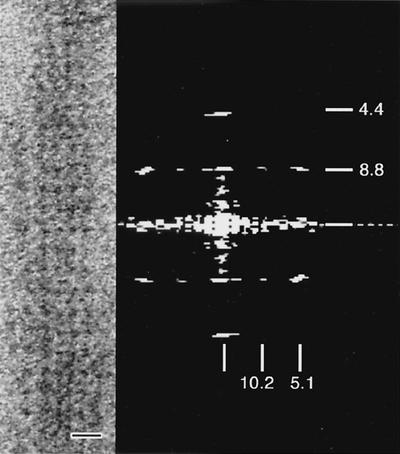
Figure 2A and 2B are contrast-enhanced electron micrographs of negatively stained, multilayered bundles of aligned, purified ribbons or segments of ribbons. The corresponding diffraction patterns, obtained by computing the two-dimensional fast Fourier transforms of the image intensities, are shown in Fig. 2C and 2D, respectively. Sets of high-intensity, sharp meridional arcs (Fig. 2C) or lines (Fig. 2D) accompanied by highly diffuse spots dominate the diffractograms. Meridional reflections, spaced at 1/8.7, 1/4.4, and 1/2.9 nm−1, correspond to the average axial repeats along the fibrils (21), while diffuse spots perpendicular to the axial dimension correspond to disordered lateral repeats within the bundles. Figure 3A shows a monolayered, straight segment of a cytoskeletal ribbon whose calculated diffraction pattern (Fig. 3B) reveals sharper reflections and more uniform spacings. The spatial frequency of the axial repeat is still ∼1/8.7 nm−1, but a clear lateral spatial frequency of ∼1/10.2 nm−1, obscured in the laterally disordered bundles, emerges.
FIG. 2.
Transmission electron micrographs of negatively stained bundles of purified cytoskeletal ribbons that are densely packed and relatively well aligned; area A is thicker and less ordered than area B. Computed diffractograms of the ribbon bundles shown in A and B are presented in C and D, respectively; sharp meridional reflections corresponding to the axial repeat along the fibrils are evident. Lateral order is less preserved in the bundles, as indicated by the diffuse reflections. The axial repeat is ∼8.7 nm in both diffraction patterns. Bar, 50 nm.
FIG. 3.
Transmission electron micrograph of a thin monolayered segment of a straight and well-ordered cytoskeletal ribbon (left) and its diffraction pattern (right). In comparison with Fig. 2, lateral repeats (∼10.2 nm) are well resolved. A glancing view along the ribbon reveals the fibrils and rings. Bar, 20 nm.
Direct measurements of spatial repeats in cytoskeletons and fibrils.
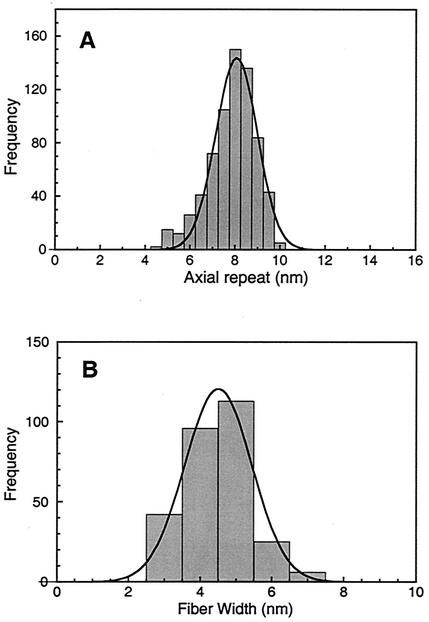
To this point, data analysis has been based on diffraction patterns of images of ribbons and bundles in which all structural features are averaged, but the cytoskeletal ribbons are linear motors whose subunit spacing is expected to vary during contraction and expansion (21, 22). Whereas the average distances between subunits are determined by the spatial frequencies of the diffraction spots, the variation in subunit spacing can be determined directly from images. Histograms of the measured axial and lateral spacings, measured on individual fibers and ribbons, are given in Fig. 4A and 4B, respectively. The average of 690 axial repeats was 8.2 ± 1.0 nm (standard deviation). The pixel size of 0.46 nm contributes to the error in a single measurement of the lateral spacing but is not expected to produce a systematic error in the value of the mean spacing. The directly measured lateral spacing is slightly lower than the mean value of 8.7 nm obtained from the diffractograms; this difference might be because the direct measurements were performed on individual fibrils rather than on cytoskeletal ribbons. In the intact ribbon, length changes in individual fibrils are correlated and more restrictive than in individual, free fibrils. The average projected width of 282 discrete fibril segments was 4.5 ± 0.9 (standard deviation) nm, in reasonable agreement with an expected diameter of 5.1 nm for the equivalent sphere of a 59-kDa protein molecule (21).
FIG. 4.
(A) Distribution of axial repeats along fibrils and ribbons measured directly from transmission electron micrographs of negatively stained preparations. (B) Distribution of projected width as measured directly on isolated fibrils. These values are consistent with the diffraction data in Fig. 2 and 3.
Our experience is that isolated cytoskeletons in the bulk, whether negatively stained or vitrified, tend to straighten, while within the cells they are helical (21). When the isolated cytoskeleton straightens, the fibrils become more uniform in length and the distribution of the axial subunit lengths narrows; this may well be their relaxed and more stable state. In contrast, the cytoskeletal ribbon in the cell, coiled due to differential length changes of the fibrils, is characterized by a wider distribution of subunit dimensions. In the isolated, straight fibrils the subunits are relatively extended—to about 85% of the maximal extension that occurs in the circular state —but subunits with shorter axial lengths are still present. Thus, the frequency of subunit size distribution may differ between the in vivo and in vitro states, even though the range of subunit axial lengths does not. This would explain the relatively sharp reflections in the diffraction patterns in Fig. 2C and 2D compared to the range of individual subunit dimensions as measured directly. This view is supported by calculations of fibril lengths in the cytoskeleton of live, helical cells with different helical conformations (22). The number of subunits per fibril unit length is constant, ∼100 fully expanded subunits per micrometer. Because the fibril length depends on subunit axial length, the range of axial lengths is expected to correlate with the range of fibril lengths at all conformational states. We find that this is indeed the case (22), which is reflected in the results and data analysis below.
Images of single and paired fibrils.
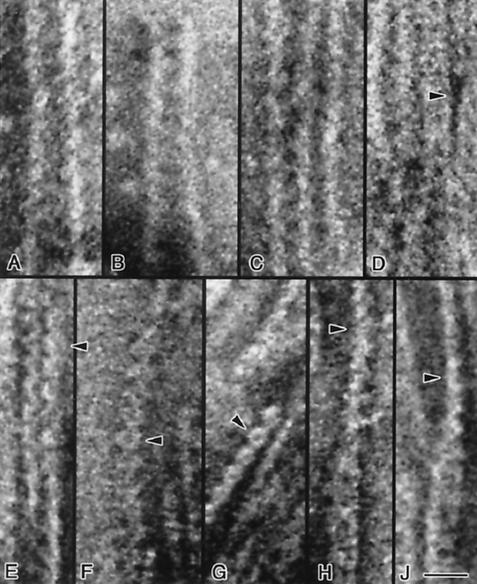
In order to recover information lost upon averaging of the bulk specimens, we analyzed images of individual negatively stained fibrils and pairs of fibrils. The independent existence of individual fibrils, ∼5 nm wide with ∼8- to 9-nm axial repeats, and their pairing is revealed by following the pattern of stain accumulation around and between fibrils as the interfibrillar distance shortens (Fig. 5A to 5D). Two ring-like structures are clearly visible at the top of Fig. 5D, and the fibrils are seen to pair (compare to panels H and J).
FIG. 5.
Transmission electron micrographs of negatively stained single and paired fibrils. Single fibrils ∼5 nm in width are shown in A to D. As two fibrils approach each other (panels A to D), the gap between them becomes filled with pools of stain (e.g., panel D, arrowhead) separated axially by ∼8 nm; two closely associated fibrils are seen in panel D (top). In this panel, two fibrils are seen to dissociate towards the lower part of the figure. This pattern of staining may indicate the presence of a periodic, concave structural element along the fibril that is prone to accumulate stain. The pairing of ∼4- to 5-nm fibrils into wider ∼9- to 10-nm structures is illustrated in panels E to G; pairs of serrated fibrils are visible in panels E and G. Chains of ring-like structures ∼9 nm in width and separated by ∼8 nm in the axial direction are shown in panels E to G (arrowheads). Twisted pairs of fibrils are illustrated in panels H and J; rings ∼10 nm in width are visible in the lower parts of these panels. At the center of both panels, pairs of fibrils are seen to twist, and at the top they are observed in side view (arrowheads) with the same axial repeat but with a width of only ∼5 nm. Bar, 20 nm.
Figures 5E to 5G illustrates ring-like repeats along the fibrils; serration of the fibrils (e.g., Fig. 5E and G) suggests the presence of concave elements along the fibril. The flatness of fibrils and their monomolecular thickness are demonstrated by following twisted structures (Fig. 5H and 5J) in which the thickness and width of the fibrils are displayed simultaneously. As a consequence of twisting, the subunits may seem slightly distorted. Although the axial repeat remains constant at ∼8 to 9 nm, the width of the fibrils is ∼5 nm when viewed from the side (Fig. 5H and 5J, top) and ∼10 nm when viewed from the top (Fig. 5H and 5J, bottom). The ring-like substructure resulting from the tight pairing of the fibrils is again distinguishable. These observations indicate that the motor has a flat, single-layered organization.
STEM: linear mass density of cytoskeletal fibrils and ribbons.
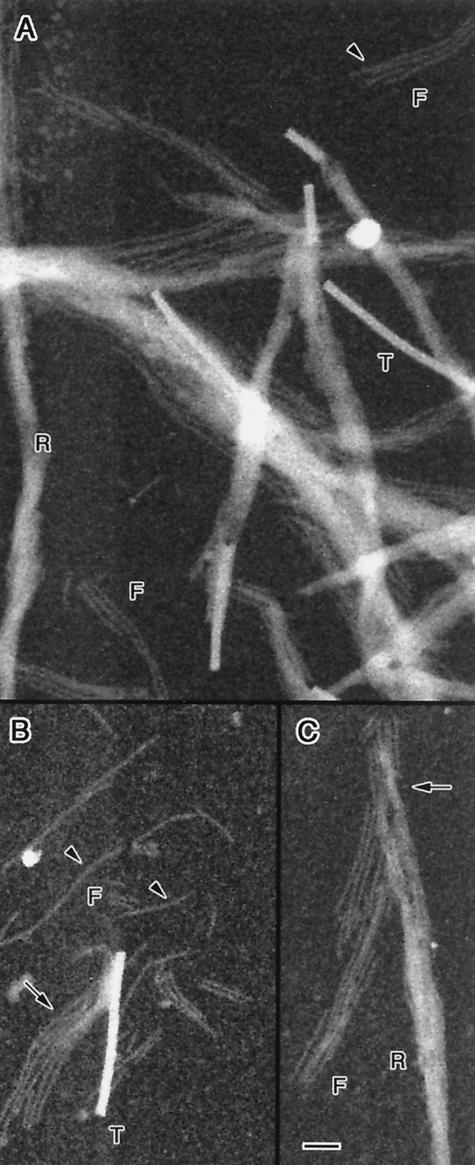
STEM dark-field images of purified cytoskeletons are presented in Fig. 6. Scattered in the field of view are whole cytoskeletal ribbons (R) as well as individual fibrils (F) that are either completely separated from the ribbons or occur at frayed ends. Also present in the images are dense tobacco mosaic virus particles (T) ∼18 nm in diameter (24), which were used for mass-per-length calibration.
FIG. 6.
(A to C) Dark-field STEM images of ribbons (R), fibrils (F), and tobacco mosaic virus particles (T) used for mass calibration. Some ribbons are completely disassembled into fibrils (arrowheads); others are intact or frayed (arrows). Variations in image intensity along some segments of ribbons may be due to twisting as the ribbons cross the field (so that there are more or fewer fibrils in projection) and possibly also to disassembly during isolation. Bar, 50 nm.
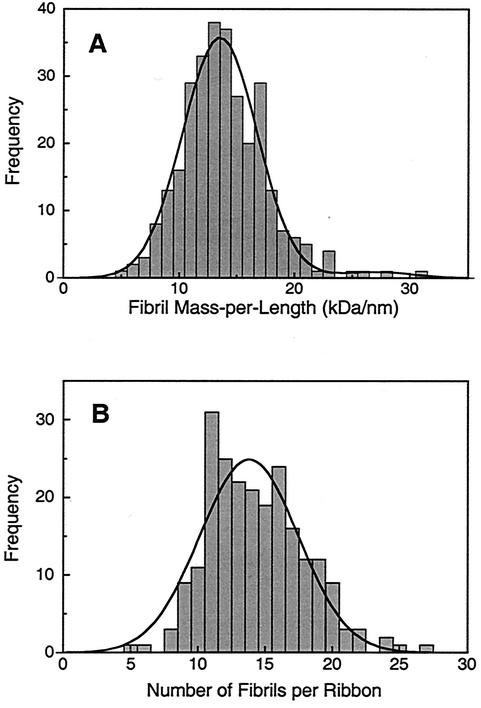
The distribution of the linear mass density of 296 individual fibril segments, displayed as a histogram in Fig. 7A, exhibits a major Gaussian-shaped peak at 13.5 kDa/nm with a standard deviation of 3.7 and a standard error of the mean of 0.2. A very minor peak at ∼27 kDa/nm is also evident, which is likely attributable to pairs of fibrils that happen to lie on top of each other and therefore cannot be dimensionally distinguished from single fibrils in the STEM image.
FIG. 7.
(A) Measured distribution of mass per length for isolated fibrils, which is well fit by a prominent Gaussian corresponding to single fibrils (13.5 kDa/nm) plus a very weak Gaussian corresponding to residual component of paired fibrils (27 kDa/nm). (B) Measured distribution of fibrils per ribbon as deduced from STEM mass analysis by assuming that each fibril has a mass per length of 13.5 kDa/nm.
Knowing the mass per length of individual fibrils, we can now deduce the average number of fibrils in a ribbon from the mass per length of straight, untwisted ribbon segments that have uniform density and width. A histogram of the ribbon mass per length divided by the fibril mass per length is plotted in Fig. 7B for 212 ribbon segments. By treating the distribution as a single Gaussian peak, the mean number of fibrils per ribbon is ∼13.8 (standard deviation = 3.5; standard error of the mean = 0.2). Fitting the distribution to two Gaussian peaks gives a major component at 14.5 fibrils/ribbon and a minor component at 11.3, whose width of 0.8 is narrower than the expected error in the measurement. We therefore believe the distribution to be best represented by a single peak. The spread in the distribution can be attributed to uncertainties in the mass measurements due to electron counting statistics and also to some disruption of ribbons during specimen preparation resulting in gain or loss of fibrils from the segments that were analyzed.
These data, taken together with the earlier observation that in whole cells the ribbon appears to be constructed from subunits arranged in seven parallel rows (21), strongly support the conclusion that assembled cytoskeletal ribbons contain seven pairs of fibrils. They also indicate, consistent with the gels shown in Fig. 1, that individual fibrils contain only one protein (Fib) and that no protein other than Fib is present in the ribbon. These results imply that the Fib protein is probably multifunctional, containing several domains (motor, ATPase, membrane association, etc.). Alternatively, there may be cytoplasmic and/or membranous auxiliary proteins, external to the ribbon, which fulfill some of these functions.
Spatial and functional organization of fibrils and cytoskeletal ribbons.
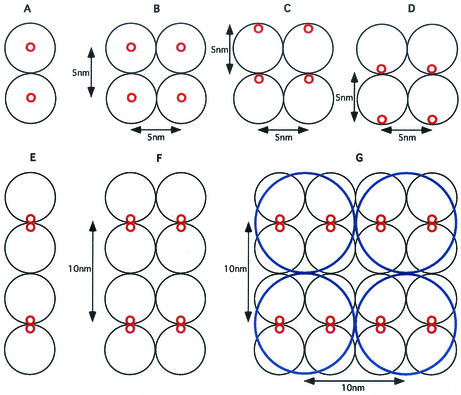
The cytoskeletal fibril of S. citri R8A2 is a protein of 59 kDa, assembled from a product of the fib gene (28). With an average volume per mass of 1.2 × 10⁻³ nm3/Da, the molecule occupies an equivalent sphere of diameter ∼5.1 nm (20, 21). From diffraction analysis of isolated whole ribbon bundles (Fig. 2C and 2D), individual fibrils (21), and direct measurements on electron micrographs of negatively stained preparations (Fig. 4A and 4B), it appears that the average axial and lateral repeats are on the order of ∼9 nm. How can these spatial repeats and molecular dimensions be merged into a coherent structure? Figure 8 schematically depicts the problem and potential solutions: a molecular chain (A) or a pair of chains (B) of symmetric 5-nm-diameter spheres can generate only 5-nm axial and 5-nm lateral repeats. Introducing molecular polarity (up, C; down, D) does not affect the magnitude of the repeat. The axial repeat in a molecular chain can be doubled if the polar monomers are arranged in pairs with opposite polarities (dimers, E), but the lateral repeat in such an array (F) is still only 5 nm. The lateral repeat can be doubled (G) by pairing the chains or assigning a tetramer (bold circle, G) as the structural subunit. The latter organization is consistent with the frequent occurrence of rings.
FIG. 8.
Model for subunit assembly into fibrils and ribbons. (A) Molecular chain consisting of symmetrical spherical subunits, 5 nm in diameter. (B) Pair of chains. (C and D) Molecular polarity of subunits that are arranged in the same orientation does not alter spacing. (E) Spacing is doubled if polar monomers are arranged in pairs with opposite polarities. (F) Parallel chains of opposed dimers yield a lateral repeat that is still only 5 nm. (G) Lateral repeat is doubled by pairing chains or by assigning a tetramer (bold circle, G) as the structural subunit, which is consistent with the experimental data.
Analysis of the combined STEM and TEM/diffractogram data suggests the following model. A molecule of mass MW = 59 kDa occupies an average distance, FL, along a fibril of measured linear mass density, ML = 13.5 ± 0.2 kDa/nm (standard error of the mean). An estimate of FL is given by FL = MW/ML = 4.36 ± 0.06 (standard error of the mean) nm. The number of monomers, N, contained within an axial repeat, P = 8.7 nm, along a fibril is N = P/FL = 1.99 ± 0.03 (standard error of the mean) monomers/axial repeat. Thus, we conclude that the basic structural repeat along the fibril is a dimer.
The lateral repeat within a monolayered ribbon is ∼10.2 nm (see Fig. 3), corresponding to a pair of fibrils (see Fig. 4B). Disassembly of the ribbon without harsh biochemical treatments, as in our experiments, produces fibrils rather than individual tetrameric rings; this observation indicates that the structural building block of the ribbon is a chain of dimers. Given the even number of fibrils in a ribbon, as determined by the appearance of the cytoskeleton in cryofixed and freeze-substituted whole cells (21), we deduce that the functional units are pairs of dimer chains, while the tetrameric rings are pairs of dimers along paired fibrils. In this model, motive force is generated, as previously proposed (21), by a conformational change in the linked tetrameric subunit from a circular to elliptical arrangement. Note that a micron-long fibril would accommodate 100 fully extended tetrameric rings or 400 Fib molecules per μm. In the ribbon, 1 μm will accommodate 2,800 molecules. Therefore, a total of ∼14,000 molecules may be expected in the average cell, which has a length of five ∼1-μm helical repeats.
We have mainly confined this report to the cytoskeletal structure of S. citri R8A2, whose fib gene has been fully sequenced. However, similar results were obtained for S. melliferum BC3, suggesting a general underlying structure and pattern of molecular interactions between these two closely related organisms. Also, we restricted this study to the spatial organization of the highly purified Fib macromolecular complex. However, in order to complete the functional picture, critical information still remains to be determined, including the high-resolution, three-dimensional structure of the Fib molecule and the detailed nature of the interaction between the cell membrane and its cytoskeleton. Furthermore, it will be necessary to establish the role of copurifying proteins (21), and to elucidate the energetics and driving force of the system.
Prokaryotic versus eukaryotic linear motors.
In eukaryotes, the term linear motor usually refers to a combination of a linear cytoskeletal filament (e.g., F-actin and microtubules) with a specific motor protein, a mechano-enzyme (e.g., myosin, dynein, or kinesin). With ATP as an energy source, the motor moves filaments relative to each other or, possibly, relative to the cell membrane (3). In prokaryotes, a linear motor is quite different, a filamentous polymer, the actual length of which changes reversibly due to conformational switching of its monomers. Examples are the reversible polymorphic transitions in (extracellular) supercoiled bacterial flagellar filaments driven by relative length changes of their protofilament components (1) and the (intracellular) cytoskeletal ribbon in Spiroplasma spp. driven by the same underlying principle (21). Flagellar protofilaments and the cytoskeletal fibrils are assembled from single protein species, flagellin and Fib, respectively. The spiroplasmal cytoskeletons act as both a structural element and a linear motor.
The last point needs further explanation. Bacterial propulsion is driven by the rotary flagellar motor, in which the helical filament (propeller) converts the rotary motion into linear thrust. However, fine tuning of motility is accomplished by continuous control of the helical parameters (pitch, wavelength, and hand) of the propeller. Although controlling flagellar polymorphism does not generate propulsive force, its functional behavior is similar to that of known linear motors.
The associations between the Spiroplasma cytoskeleton, specific membrane proteins, and cell shape and motility are well established. Spiralin is a membrane protein that copurifies with the cytoskeleton (21); antibodies against spiralin applied to live cells (2) interfere with cell shape and impair motility. A 40-kDa membrane protein missing in the ASP-1 mutant impairs motility and causes the cell to straighten (18). These proteins may serve as anchor proteins against which the contractile and extensive forces of the cytoskeletal motors are exerted.
Recently, the presence of actin-related bacterial cytoskeletons was reported in the cell-walled bacteria Bacillus subtilis (11) and Thermotoga maritima (23). Interestingly, the constituent MreB molecules form paired chains with 5.1-nm axial repeats (compared to 5.5 nm in actin). However, unlike eukaryotic actin, the paired chain is not twisted to form a double helix but is straight and parallel, much like the Spiroplasma fibrils. A typical cell contains ∼8,000 MreB molecules and ∼12,000 to 14,000 Mbl molecules (10), sufficient to generate a flat spiraling ribbon with ∼10 protofilaments 3 to 6 μm in length (6). Actin itself does not contract, and the axial repeat along the protofilament is stable and consistent with the shape of the monomer. Actin may generate force and contraction-expansion through filament sliding, driven by the motor molecule myosin (not found in prokaryotes) or by a directional polymerization-depolymerization process. Another example (14a) is plasmid partitioning during the bacterial cell cycle, a process driven by the ParM protein, which forms actin-like filaments. In this case, force is generated by ATP-driven polymerization-depolymerization of the paired filaments which may form a bundle that spans the cell from end to end.
This is where the analogy with the Spiroplasma cytoskeleton ends; Spiroplasma fibrils are extremely stable and resistant to depolymerization, unlike MreB ribbons. Moreover, a clear range of (differential) axial length changes, correlating with the dynamic, helical geometry of the cell, has been observed for Spiroplasma fibrils and in the molecules along their length, suggesting contractility (22).
Acknowledgments
This study was supported by funds from the Israel Academy of Sciences, the U.S.-Israel Binational Science Foundation (S.T.), and the NIH Intramural Program.
We thank Jacqueline Fletcher, Oklahoma State University, Stillwater, Okla., for providing S. citri cultures, G. Stubbs of Vanderbilt University, Nashville, Tenn., for supplying the tobacco mosaic virus, Christine Brantner, NIH, and Marina Hutoran, Jerusalem, for invaluable technical assistance, and T. S. Reese, NIH, for helpful comments. We are grateful to P. G. McQueen, NIH, for help and advice with Mathematica.
REFERENCES
- 1.Asakura, S. 1970. Polymerization of flagellin and polymorphism of flagella. Adv. Biophys. 1:99-155. [PubMed] [Google Scholar]
- 2.Bove, J. M., X. Foissac, and C. Saillard. 1993. Spiralins. Subcell. Biochem. 20:203-223. [DOI] [PubMed] [Google Scholar]
- 3.Bray, D. 2001. Cell movements, 2nd ed. Garland, New York, N.Y.
- 4.Charbonneau, D. L., and W. C. Ghiorse. 1984. Ultrastructure and location of cytoplasmic fibrils in Spiroplasma floricola OBMG. Curr. Microbiol. 10:65-72. [Google Scholar]
- 5.Davis, R. E., I. M. Lee, and J. F. Worley. 1981. Spiroplasma floricola, a new species isolated from surfaces of flowers of the tulip tree, Liriodendrom tulipifera. Int. J. Syst. Bacteriol. 31:456-464. [Google Scholar]
- 6.Erickson, H. P. 2001. Evolution in bacteria. Nature 413:30.. [DOI] [PubMed] [Google Scholar]
- 7.Gilad, R., A. Porat, and S. Trachtenberg 2003. Motility modes of Spiroplasma melliferum BC3: a helical, wall-less bacterium driven by a linear motor. Mol. Microbiol. 47:657-669. [DOI] [PubMed]
- 8.Gubbens, A. J., H. A. Brink, M. K. Kundmann, S. L. Friedman, and O. L. Krivanek. 1993. Application of a post-column imaging filter in biology and materials science. Ultramicroscopy 51:146-159. [DOI] [PubMed] [Google Scholar]
- 9.Hainfeld, J. F., D. Safer, J. S. Wall, M. Simon, B. Lin, and R. D. Powell 1994. Methylamine vanadate (NanoVan) negative stain, p. 132-133. In G.W. Bailey and A. J. Garratt-Reed (ed.), Proceedings of the 52nd Annual Meeting of the Microscopy Society of America. San Francisco Press, San Francisco, Calif.
- 10.Jones, L. J. F., R. Carballido-Lopez, and J. Errington. 2001. Control of cell shape in bacteria: helical, actin-like filaments in Bacillus subtilis. Cell 104:913-922. [DOI] [PubMed] [Google Scholar]
- 11.Kirchhoff, H. 1992. Motility, p. 289-306. In J. Maniloff, R. N. McElhaney, L. R. Finch, and J. B. Baseman (ed.), Mycoplasmas: molecular biology and pathogenesis. American Society for Microbiology, Washington, D.C.
- 12.Krivanek, O. L., A. J. Gubbens, N. Dellby, and C. Meyer. 1992. Design and first applications of a postcolumn imaging filter. Microsc. Microanal. Microstruct. 3:187-199. [Google Scholar]
- 13.Leapman, R. D., and S. B. Andrews. 1992. Characterization of biological macromolecules by combined mass mapping and electron energy loss spectroscopy. J. Microsc. 165:225-238. [DOI] [PubMed] [Google Scholar]
- 14.Leapman, R. D., P. E. Gallant, T. S. Reese, and S. Andrews. 1997. Phosphorylation and subunit organization of axonal neurofilaments determined by scanning transmission electron microscopy. Proc. Natl. Acad. Sci. USA 94:7820-7824. [DOI] [PMC free article] [PubMed] [Google Scholar]
- 14a.Møller-Jensen, J. B. Jensen, J. R. Loewe, and K. Gerdes. 2002. Prokaryotic DNA segregation by an actin-like filament. EMBO J. 21:3119-3127. [DOI] [PMC free article] [PubMed] [Google Scholar]
- 15.Razin, S., D. Yogev, and Y. Naot. 1998. Molecular biology and pathogenicity of mycoplasmas. Microbiol. Mol. Biol. Rev. 62:1094-1156. [DOI] [PMC free article] [PubMed] [Google Scholar]
- 16.Saglio, P., M. L'Hospital, D. Laflèche, G. Dupont, J. M. Bòve, J. G. Tully, and E. A. Freundt. 1973. Spiroplasma citri: a mycoplasma-like organism associated with “stubborn” disease of citrus. Int. J. Syst. Bacteriol. 23:191-204. [Google Scholar]
- 17.Schmitt, U., H. Petzold, and R. Marwitz.1984. An in situ freeze-fracture study of Spiroplasma citri and the corn stunt Spiroplasma. J. Phytopathol. 111:297-304. [Google Scholar]
- 18.Townsend, R., P. G. Markham, K. A. Plaskitt, and M. J. Daniels. 1977. Isolation and characterization of a non-helical strain of Spiroplasma citri. J. Gen. Microbiol. 100:15-21. [Google Scholar]
- 19.Townsend, R., D. B. Archer, and K. A. Plaskitt. 1980. Purification and preliminary characterization of Spiroplasma fibrils. J. Bacteriol. 142:694-700. [DOI] [PMC free article] [PubMed] [Google Scholar]
- 20.Trachtenberg, S. 1998. Mollicutes—wall-less bacteria with internal cytoskeletons. J. Struct. Biol. 124:244-256. [DOI] [PubMed] [Google Scholar]
- 21.Trachtenberg, S., and R. Gilad. 2001. A bacterial linear motor: cellular and molecular organization of the contractile cytoskeleton of the helical bacterium Spiroplasma melliferum. Mol. Microbiol. 41:827-848. [DOI] [PubMed] [Google Scholar]
- 22.Trachtenberg, S., R. Gilad, and N. Geffen. 2003. The bacterial linear motor of Spiroplasma melliferum BC3: from single molecules to swimming cells. Mol. Microbiol. 47:671-697. [DOI] [PubMed]
- 23.van den Ent, F., L. A. Amos, and J. Loewe. 2001. Prokaryotic origin of the actin cytoskeleton. Nature 413:39-44. [DOI] [PubMed] [Google Scholar]
- 24.Wall, J. S., and J. F. Hainfeld. 1986. Mass mapping with the scanning transmission electron microscope. Annu. Rev. Biophys. Biophys. Chem. 15:355-376. [DOI] [PubMed] [Google Scholar]
- 25.Williamson, D. L. 1974. Unusual fibrils from the spirochete-like sex ratio organism. J. Bacteriol. 117:904-906. [DOI] [PMC free article] [PubMed] [Google Scholar]
- 26.Williamson, D. L., and R. F. Whitcomb. 1974. Helical, wall-free prokaryotes in Drosophila, leafhoppers and plants, p. 283-290. In J. M. Bóve and J. F. Duplan (ed.), Les mycoplasmas de l'homme, des animaux, des vegetaux et des insectes. INSERM, Paris, France.
- 27.Williamson, D. L., P. R. Brink, and G. W. Zieve. 1984. Spiroplasma fibrils. Isr. J. Med. Sci. 20:830-835. [PubMed] [Google Scholar]
- 28.Williamson, D. L., J. Renaudin, and J. M. Bové. 1991. Nucleotide sequence of the Spiroplasma citri fibril protein gene. J. Bacteriol. 173:4353-4362. [DOI] [PMC free article] [PubMed] [Google Scholar]


