Figure 2.
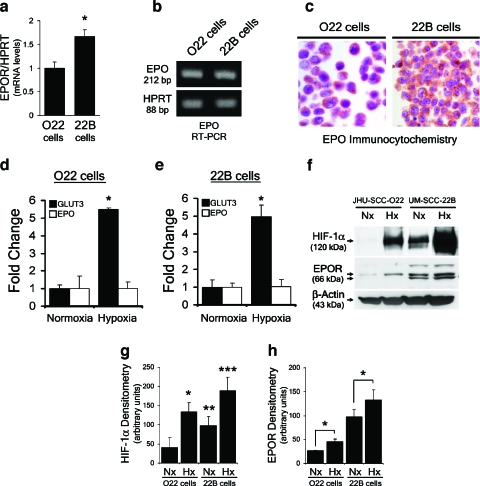
Differential invasiveness of HNSCC cell lines correlates with higher HIF and EpoR expression. (a) Quantitative real-time PCR analysis of EpoR from O22 and 22B cell cDNA with HPRT as control gene. (b) PCR amplification of Epo from O22 and 22B cell cDNA with HPRT as control gene. (c) Epo immunocytochemistry demonstrated protein expression in normoxic 022 cells and 22B cells, Epo antibody concentration 1:200, and no primary control exhibited no staining. (d) Quantitative real-time PCR analysis of Epo and GLUT3 mRNA levels in O22 cells after 24 hours of treatment with hypoxia. The amount of each mRNA in samples was normalized to the average of HPRT1 mRNA and GUS mRNA in the same sample. (e) Quantitative real-time PCR analysis of Epo and GLUT3 mRNA levels in 22B cells cultured for 24 hours under hypoxia. The amount of each mRNA in samples was normalized to the average of HPRT1 mRNA and GUS mRNA in the same sample. (f) Differential expression of HIF-1 and EpoR expression in O22 and 22B HNSCC cells. For hypoxia treatment, cells were exposed to 1% O2 for 24 hours. (g) HIF-1 protein levels from (f) were quantified using densitometry. Densitometry values from three independent experiments were graphed and a two-tailed Student's t test was performed to compare relative HIF-1 levels of indicated treatment groups. (*, **, ***P < .05; all treatment groups were compared to HIF-1 levels of normoxic O22 cells). (h) EpoR protein levels from (f) were quantified using densitometry. Densitometry values from three independent experiments were graphed and a two-tailed Student's t test was performed to compare EpoR levels of normoxia- versus hypoxia-treated cells (*P < .05).

