Abstract
Continuous low-dose (metronomic) therapy, based on cyclophosphamide (CTX) combined with thalidomide (Tha), was evaluated on Dunning prostate R3327-AT1 rat tumors. Significantly delayed tumor growth (P < .001) was observed with oral CTX alone at a low dose (metronomic cyclophosphamide or M-CTX; 30 mg/kg per day) or combined with Tha. To investigate dynamic changes in tumor physiology during early stages of treatment, magnetic resonance imaging (MRI) was applied before and during the M-CTX or M-CTX + Tha therapy. Dynamic contrast-enhanced MRI revealed significant changes in the tumor center by day 3 (P < .01); by day 7, only a thin peripheral tumor region showed high signal enhancement. There was a significant correlation between poorly enhancing fraction on day 7 and ultimate tumor growth delay (P < .02). The apparent transverse relaxation rate (R2*) showed similar baseline tumor heterogeneity, but no obvious changes with growth or therapy. Histology confirmed substantial necrosis in the tumor center, leaving a thin live peripheral rim. Immunohistochemistry showed a significant increase in vascular endothelial growth factor, and apoptotic tumor and vascular endothelial cells. These results show the efficacy of the metronomic CTX ± Tha for delaying tumor growth and indicate that MRI provides insights into the mode of action and early indication of efficacy.
Keywords: continuous low-dose (metronomic) chemotherapy, prostate tumor, magnetic resonance imaging (MRI), immunohistochemistry, antiangiogenesis
Introduction
Recent studies show that extended continuous administration of certain cytotoxic agents at very low doses, so-called “metronomic” chemotherapy, generates antiangiogenic activity [1–5]. Furthermore, continuous low-dose chemotherapy combined with an antiangiogenic agent effectively circumvented acquired drug resistance [6]. Previous tests have generally used human tumor xenografts in immunocompromised mice or fast-growing rodent tumors. The current study examines this new treatment strategy in a slower-growing tumor, the anaplastic Dunning R3327-AT1 rat prostate tumor implanted syngeneically in Copenhagen rats. The popular chemotherapeutic agent, cyclophosphamide (CTX) was chosen because it is one of the most widely used alkylating drugs. CTX is also effective against a wide variety of cancers including androgen-independent prostate cancer (AIPC), and recent reports indicated efficacy when it was administered continuously at low doses [7,8]. Thalidomide (Tha) was also used because it has recently been shown to exhibit antiangiogenic activity [9–11].
This study had two primary goals: the first was to determine whether metronomic cyclophosphamide (M-CTX), with or without the addition of Tha, could significantly delay the growth of the syngeneic prostate tumor in an immunocompetent rat. The second goal was to determine whether magnetic resonance imaging (MRI) could delineate sequential physiological changes, especially in the vasculature during the early stages of treatment. MRI permits noninvasive evaluation of tumor physiology, potentially revealing treatment-induced changes occurring prior to overt changes in tumor size [12,13]. Dynamic contrast-enhanced (DCE) MRI based on the transport of gadolinium DTPA (Gd-DTPA) has been widely used in animal and clinical studies to provide an indication of tumor perfusion and permeability [14–17]. Blood oxygen level-dependent (BOLD) contrast in 1H MRI has also been applied to assess acute response to drugs [17–19].
Methods
Tumor Model
Syngeneic Dunning prostate R3327-AT1 rat tumors were implanted in a skin pedicle surgically created on the foreback of adult male Copenhagen 2331 rats (∼250 g; Harlan, Indianapolis, IN), as described in detail previously [20]. Cells were originally obtained from Dr. J. T. Isaacs (Johns Hopkins, Baltimore, MD) and provided to us by Dr. P. Peschke (DKFZ, Heidelberg, Germany). Wechose the AT1 subline because it is slower-growing (VDT = 5.2 days) and, normally, the tumor does not develop a central necrosis [21,22]. Experiments were approved by the Institutional Animal Care and Use Committee.
Drugs and Treatment Proztocol
Tumor-bearing rats were divided into five groups, and treatment was initiated when tumor size reached ∼1 cm diameter—group 1: untreated control (n = 6); group 2: Tha (Tocris Cookson, Inc., Ellisville, MO) at 60 mg/kg, intraperitoneally (i.p.), twice per week (n = 6). Tha was prepared in saline plus a few drops of DMSO with rapid stirring and gentle warming to ∼45°C; group 3: standard CTX (Sigma Chemical Co., St. Louis, MO) therapy at 150 mg/kg, i.p., twice per week (n = 6); group 4: continuous low-dose cyclophosphamide (M-CTX) dissolved in distilled water at 30 mg/kg, p.o., daily (n = 12), as suggested by the dosing schedule of Man et al. [3]. Daily water consumption by the Copenhagen rats was monitored for five consecutive days and was found to be highly consistent with a volume ∼30 ml/day. Subgroup 4a (n = 6) was used for growth delay study, whereas subgroup 4b (n = 6) was monitored by MRI and sacrificed on day 7; group 5: combination of low-dose M-CTX (30 mg/kg, p.o., daily) with Tha (60 mg/kg, i.p., twice per week, n = 13). Subgroup 5a (n = 7) was observed for 42 days, whereas those in subgroup 5b (n = 6) were sacrificed following MRI on day 7. Tumor size was measured every 3 days using a caliper and volume was calculated as π/6abc, where a, b, and c are three respective dimensions.
MRI Experiments
MRI was performed on all the rats in subgroup 4b (n = 6), group 5 (n = 13), and selected controls (n = 3) using a 4.7-T horizontal bore magnet with a Varian Unity Inova system (Palo Alto, CA). The M-CTX-treated subgroup 4b and the M-CTX + Tha-treated subgroup 5a were studied before treatment (day 0) and 7 days after treatment, whereas the six rats treated with M-CTX + Tha (subgroup 5b) were scanned more frequently (days 0, 1, 3, and 7) to detect earlier changes in response to treatment. Each rat was anesthetized with ketamine hydrochloride (200 µl; 100 mg/ml) as a relaxant (i.p.) and maintained under general anesthesia (air and 1% isoflurane). The tail vein was catheterized using a 27-G butterfly (Abbott Laboratories, Abbott Park, IL) for contrast agent administration. Each animal was placed on its side in a cradle with a thermal blanket to maintain body temperature. Typically, three 2-mm-thick cross sections parallel to the animal were selected from a T1-weighted scout image to represent tumor regions of surface, center, and base (adjacent to the animal). The following MRI investigations were applied.
R2* measurements Multigradient echo (MGRE) images with eight echoes [repetition time (TR) = 195 milliseconds, initial echo time (TE) = 7 milliseconds, echo spacing = 6 milliseconds, flip angle = 45°, field of view = 40 x 40 mm, matrix = 128 x 128] were acquired simultaneously on the three 2-mm-thick slices with a total acquisition time of 6 minutes, 40 seconds. The transverse relaxation rate (R2*) map of each section was generated using all eight images with variable echo time by fitting an exponential model on a voxel-by-voxel basis. Mean R2* for each tumor was obtained by averaging the value from each of the three sections.
DCE MRI DCE MRI was performed on the same slices using T1-weighted spin-echo images (TR = 220 milliseconds, TE = 16 milliseconds, field of view = 40 x 40 mm, matrix = 128 x 128, two acquisitions, voxel size = 2.0 x 0.3 x 0.3 mm, total time for three slices = 59 seconds). A baseline was measured for 3 minutes and then a bolus of Gd-DTPA-BMA (125 µl of 0.1 mmol/kg Omniscan; Amersham Health, Inc., Princeton, NJ) was injected through the tail vein catheter in situ by hand over 1 second and continuous images were acquired for 10 minutes. Data were processed on a voxel-by-voxel basis using IDL 5.3/5.4 (Research Systems, Boulder, CO). In addition to global mean signal intensity, data were analyzed separately for center and periphery, represented by a 1- to 2-mm-thick rim around the whole tumor. Following Gd-DTPA-BMA injection, signal intensity versus time curves were plotted and relative signal intensity changes (ΔSI) of each tumor voxel were analyzed using the equation: (ΔSI) = (SIE - SIb)/SIb, where SIE refers to enhanced signal intensity in the voxel and SIb is defined as the average of the baseline images. The area under the signal intensity-time curve (AUC) was integrated as AUC60,120,180 = . Although AUC values were compared for each time point, all presented data are for AUC180.
Histology and Immunohistochemistry
Following MRI on day 7, three tumors from each of groups 1, 4b, and 5b were prepared for sacrifice and histologic evaluation. The hypoxia marker, pimonidazole hydrochloride (60 mg/kg, Hypoxyprobe-1; NPI, Inc., Belmont, MA) was injected into the tail vein to assess tumor hypoxia. Ninety minutes later, rats were anesthetized and perfused for 20 min with physiological saline containing 5 mM CaCl2 [23]. Tumors were excised and cut into half through the center of the tumor, corresponding to the central MRI slice. Tumor tissues were fixed in 10% formalin or immediately immersed in liquid nitrogen and stored at -80°C. For H&E staining and immunohistochemistry for apoptosis, hypoxia, and vascular endothelial growth factor (VEGF), the formalin-fixed tissues were embedded in paraffin and sectioned (4 µm), whereas cryostat sections (6 µm thick) were used for vascular endothelium (anti-CD31) staining. The paraffin sections were treated in boiling citrate buffer (0.1 M, pH 6.0) for 15 minutes and hydrated using xylene and ethanol prior to immunostaining.
Necrosis Necrotic tumor regions were identified on the H&E-stained slides of the central tumor slice examined under low magnification (x2 objective). Optical fields (∼30) in each section were captured by a digital camera and processed using Metaview software (Universal Imaging Corporation, West Chester, PA). The proportion of necrotic areas (% necrosis) was calculated as the sum of all necrotic areas divided by the total area x 100.
Apoptosis Apoptotic cells were detected using anti-caspase-3 polyclonal antibody (1:100; Promega, Madison, WI) with overnight incubation at 4°C and secondary horseradish peroxidase (HRP)-conjugated goat antirabbit secondary antibody (1:100 dilution; Serotec, Raleigh, NC) for 1 hour at 37°C.
VEGF Primary anti-VEGF(147) polyclonal antibody (1:100; Santa Cruz Biotechnology, Inc., Santa Cruz, CA) and HRP-conjugated goat antirabbit secondary antibody (1:100) were used.
Hypoxia Hypoxic regions were detected using monoclonal antibody Mab1 (1:100; NPI, Inc.) and HRP-conjugated goat antimouse secondary antibody (1:100 dilution; Serotec). Hypoxic fraction was determined as an area positively stained for pimonidazole relative to the total tissue area. Necrotic regions were excluded in this analysis.
Blood vessel density The frozen sections were incubated with mouse antirat CD31 monoclonal antibody (1:20; Serotec) for 2 hours, and then FITC-conjugated goat antimouse secondary antibody (1:100 dilution; Jackson Immunoresearch Laboratories, West Grove, PA) for 1 hour at 37°C. After mounting with Vectorshield medium (Vector Laboratories, Burlingame, CA), the slides were observed under green fluorescence (450–490 nm excitation). Vascular density of peripheral tumor regions was evaluated using the “hot spot” technique, as described by Weidner [24]. The five most vascularized areas in each tumor were selected under low magnification (x10). Vascular density was determined by counting the total number of structures positive for CD31 using x20 objective (area 0.079 mm2) and by calculating the mean number of vessels per square millimeter.
Statistical Analysis
Statistical significance was assessed using an analysis of variance (ANOVA) on the basis of Scheffe's F test (Statview; SAS Institute, Inc., Cary, NC) or Student's t tests.
Results
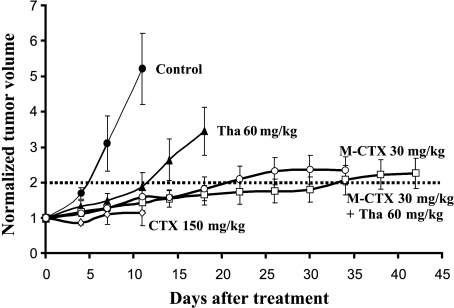
The conventional MTD of CTX (150 mg/kg, i.p.) significantly delayed tumor growth, but there was extreme toxicity resulting in severe body weight loss and animal death after three doses (3 x 150 mg/kg, P < .01). By contrast, no obvious side effects were observed in the rats treated with the low-dose M-CTX (30 mg/kg) alone or combined M-CTX + Tha. Significant tumor growth delay was observed for both groups 4 (P < .01 by day 3) and 5 (P < .01 by day 3), compared with the untreated control tumors (Figure 1); after 10 days, the growth delay was not significantly less than group 3. Tumors in group 2 also showed significantly delayed growth by day 7, compared with the control tumors (P < .05).
Figure 1.
Tumor growth with respect to treatment. Treatment started on the established AT1 tumors with an average volume of 0.6 cm3 (day 0) and normalized mean tumor volumes (±SE) are shown for each treatment group. Group 1 (●, control), Group 2 (▲, Tha alone), Group 3 (◊, MTD CTX). All six animals treated with a standard MTD of CTX (150 mg/kg, i.p., twice per week) died after three doses on or before day 12. Group 4a (◯, M-CTX), Group 5a (□, M-CTX + Tha). M-CTX = metronomic cyclophosphamide given orally in drinking water.
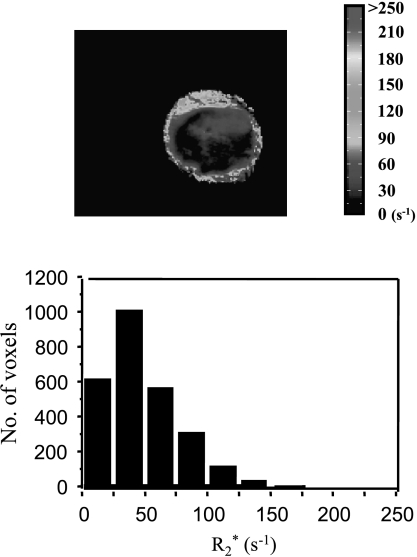
R2* maps revealed baseline heterogeneity with R2* ranging from ∼5 to 400 second-1 (T2*: ∼2.5–200 milliseconds; Figure 2). For subgroup 4b (M-CTX), significantly lower R2* values were found in two tumors on day 7 than on day 0 (P < .01). However, there was no significant difference in the mean R2* between days 0 and 7 in the group of six tumors (Table 1). For subgroup 5b, the mean R2* value increased significantly on day 1 in one tumor and on day 3 in two other tumors (P < .01) and then returned to pretreatment levels (data not shown), whereas the remaining tumors showed no significant changes. For the group of six tumors, there was no significant difference in the mean R2* for any of the measurements (Table 1). Likewise, untreated control tumors showed no significant change in R2* over 7 days.
Figure 2.
The R2* map and distribution histogram obtained from a representative tumor on day 0 showed significant heterogeneity. R2* ranged from 4.5 to 326 second-1 (mean = 51 second-1).
Table 1.
Comparison of R2* Data in the Treated and Control Tumors.
| Groups | R2* Values (second-1) | |||||||
| Day 0 | Day 1 | Day 3 | Day 7 | |||||
| Mean | Range | Mean | Range | Mean | Range | Mean | Range | |
| (1), | 56 ± 2 | 52–59 | 55 ± 4 | 49–61 | 61 ± 7 | 49–73 | 57 ± 5 | 49–66 |
| Control | ||||||||
| (n = 3) | ||||||||
| (4b), | 65 ± 4 | 55–81 | NA | NA | 53 ± 4 | 38–65 | ||
| M-CTX | ||||||||
| (n = 6) | ||||||||
| (5b) | 52 ± 4 | 39–67 | 70 ± 7 | 46–91 | 64 ± 9 | 41–102 | 47 ± 3 | 39–57 |
| M-CTX + | ||||||||
| Tha | ||||||||
| (n = 6) | ||||||||
M-CTX: metronomic cyclophosphamide (30 mg/kg per day, p.o.); M-CTX + Tha: cyclophosphamide (30 mg/kg per day, p.o.) + thalidomide (60 mg/kg, i.p., twice per week); values are shown as mean ± SE, and range of mean values; NA: no measurement.
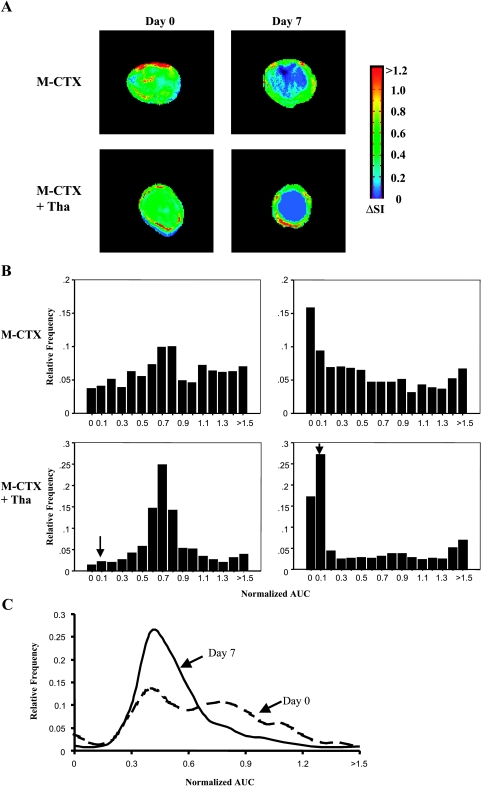
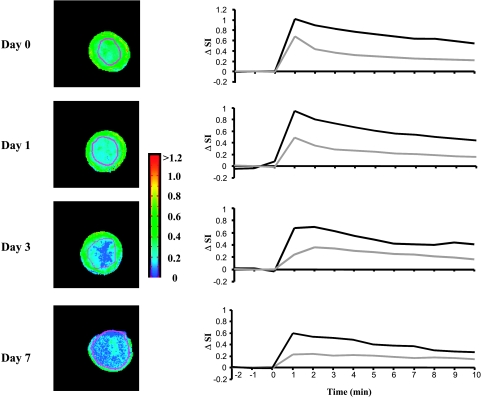
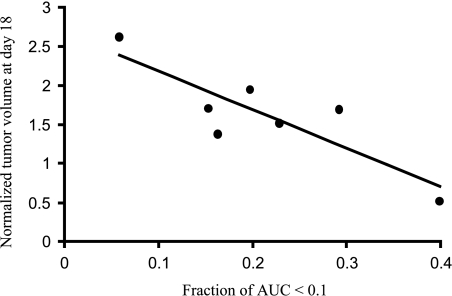
DCE MRI indicated that, in all tumors, pretherapy or post-therapy, the periphery was better perfused than the center, with faster and greater signal enhancement and significantly greater AUC (Figures 3 and 4; Table 2). In control tumors (Table 2), peripheral perfusion remained similar at each time, although central response decreased and was significantly lower by day 7 (P < .05). Rats receiving M-CTX (subgroup 4b) or M-CTX + Tha (subgroup 5a) showed a somewhat similar behavior, with little change in peripheral perfusion, but a significant decrease in the center on day 7 (P < .001). The histogram of AUC values showed a significant shift to the left in both treated groups (Figure 3B). Control tumors also showed a tendency toward a left shift, but more subtle and less severe (Figure 3C). When the study was repeated for M-CTX + Tha-treated tumors (subgroup 5b), significant changes were found in the tumor centers by day 3, compared to baseline (day 0) or control animals (Figure 4; Table 2). On day 7, central regions continued to show highly significant reduction in AUC (like group 5a), but in this case, the periphery also indicated significant reduction (Figure 4; Table 2). Tumors in groups 5a and 5b behaved similarly and we attribute the level of significance for change in tumor periphery in group 5b to the smaller variability within tumors in the group (SE on day 7). When the fraction of AUC < 0.1 observed by DCE MRI on day 7 was plotted versus normalized tumor volume on day 18 (subgroup 5a), a significant correlation was found (r = 0.85, P < .02; Figure 5).
Figure 3.
(A) Signal enhancement (ΔSI) maps at 60 seconds after infusion of Gd-DTPA-BMA observed from DCE MR images from the central slice of representative tumors before (day 0, left) and during treatment (day 7, right). Top row: The M-CTX-treated tumor (subgroup 4b—volumes: day 0 = 0.9 cm3, day 7 = 1.0 cm3). Bottom row: The M-CTX + Tha-treated tumor (subgroup 5a—volumes: day 0 = 0.7 cm3, day 7 = 0.4 cm3). In both of the tumors, significant signal enhancement after intravenous injection of Gd-DTPA-BMA was seen in the whole section on day 0. However, only a peripheral rim with highly enhancing signal remained on day 7. (B) Normalized AUC frequency histograms obtained from the three slices of the same tumors showed a significant left shift following therapy (AUC < 0.1, P < .001). The bins labeled with (↓) indicate an AUC of 0.0001 to 0.1. (C) Histograms of a control tumor showed much less shift.
Figure 4.
Dynamic change in signal intensity-time curve of DCE MRI in a M-CTX + Tha-treated tumor (also shown in Figure 2). T1-weighted images (left column) showed that the area with lower signal enhancement (blue) progressively increased with time. Like the tumor shown in Figure 3A, the majority of tumor showed little or no increase in signal enhancement on day 7. Signal versus time curves (right column) revealed differential behavior between peripheral (dark line) and central (light line) tumor regions observed by DCE MRI.
Table 2.
Comparison of DCE MRI Results in the Treated and Control Tumors.
| Groups | AUC by DCE (mean ± SD) | |||||
| Day 0 | Day 1 | Day 3 | Day 7 | |||
| Control (n = 3) | Group 1 | Periphery | 0.71 ± 0.12 | 0.62 ± 0.12 | 0.61 ± 0.05 | 0.63 ± 0.04 |
| Center | 0.54 ± 0.06* | 0.45 ± 0.01* | 0.41 ± 0.05* | 0.39 ± 0.02*,† | ||
| Whole | 0.61 ± 0.05 | 0.53 ± 0.01 | 0.53 ± 0.04 | 0.50 ± 0.06 | ||
| M-CTX (n = 6) | Subgroup 4b | Periphery | 0.83 ± 0.14 | NA | NA | 0.70 ± 0.12 |
| Center | 0.62 ± 0.15* | NA | NA | 0.22 ± 0.08*,‡,§ | ||
| Whole | 0.72 ± 0.14 | NA | NA | 0.48 ± 0.10† | ||
| M-CTX + Tha (n = 3) | Subgroup 5a (n = 7) | Periphery | 0.81 ± 0.14 | NA | NA | 0.66 ± 0.15 |
| Center | 0.63 ± 0.10* | NA | NA | 0.16 ± 0.10*,‡,§ | ||
| Whole | 0.71 ± 0.11 | NA | NA | 0.43 ± 0.08†,§ | ||
| Subgroup 5b (n = 6) | Periphery | 0.70 ± 0.14 | 0.61 ± 0.12 | 0.61 ± 0.09 | 0.52 ± 0.08† | |
| Center | 0.50 ± 0.09* | 0.40 ± 0.08* | 0.31 ± 0.07*,†,§ | 0.19 ± 0.09*,‡,§ | ||
| Whole | 0.60 ± 0.13 | 0.51 ± 0.07 | 0.49 ± 0.08 | 0.38 ± 0.07†,§ | ||
M-CTX: metronomic cyclophosphamide (30 mg/kg per day, p.o.); M-CTX + Tha: cyclophosphamide (30 mg/kg per day, p.o.) + thalidomide (60 mg/kg, i.p., twice per week); NA: no measurement.
P < .005 vs periphery.
P < .05. vs day 0.
P < .001 vs day 0.
P < .05 vs control.
Figure 5.
A significant correlation (r = 0.85, P < .02) was found between normalized tumor volume on day 18 and the fraction of poorly DCE-enhancing tumor (AUC < 0.1) on day 7 in the seven M-CTX + Tha-treated (group 5a) tumors.
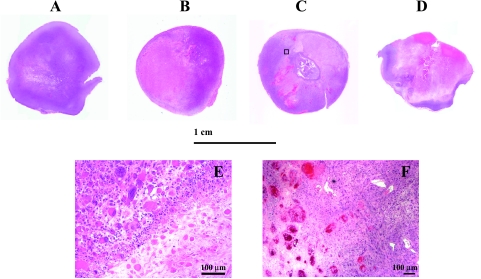
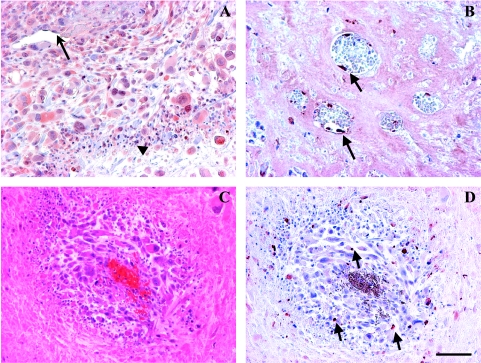
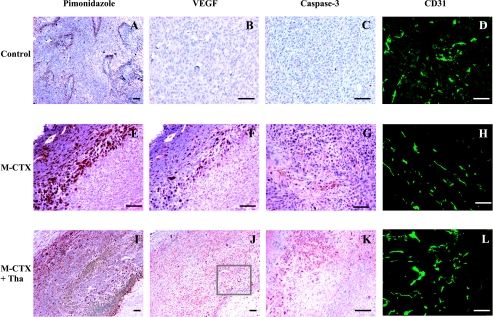
The results of histologic and immunohistologic studies are summarized in Table 3. H&E staining showed a huge central necrosis in the M-CTX- or M-CTX + Tha-treated tumors after 7 days of treatment (Figure 6), contrasting to multifocal micronecroses typical of the control R3327-AT1 tumors (52% for M-CTX and 56% for M-CTX + Tha vs 6% for control, P < .01; Table 2). In other words, M-CTX alone or combined M-CTX + Tha induced the central necrosis in these tumors. The CTX + Tha-treated tumors also showed severe microvascular thromboses (Figures 6 and 8). Immunohistochemical staining for caspase-3 showed a significant increase in apoptotic tumor cells and apoptotic vascular endothelia (Table 2; Figures 7 and 8). Tumor hypoxia, as detected by pimonidazole, was also found in much of the surviving rim in either M-CTX- or M-CTX + Tha-treated tumors, whereas positive staining in the control tumors was primarily detected in tumor tissues surrounding micro-necroses (Figure 7). Intriguingly, overexpression of VEGF was found in both M-CTX- and M-CTX + Tha-treated tumor cells, vascular endothelia, and inflammatory cells (Figures 7 and 8; Table 3). A global colocalization with hypoxia in the rim of the tumors treated with M-CTX alone or M-CTX + Tha implies a close relationship between hypoxia and angiogenesis (Figure 7, E and F, I and J). However, tumor microvessel density (MVD) showed no significant difference between the M-CTX-treated (177/mm2) and the M-CTX + Tha-treated (154/mm2) and control (141/mm2) tumors (Figure 7, D, H, and L; Table 3).
Table 3.
Evaluation of Antitumor Effects by Histology.
| Groups | H&E Necrosis (%) | Apoptosis Caspase-3 (%) | Hypoxia Pimonidazole (%) | Angiogenesis VEGF (%) | MVD CD31 (mm-2) |
| (1) Control | 6 ± 1 | 3 ± 1 | 15 ± 3 | 4 ± 2 | 141 ± 15 |
| (n = 3) | |||||
| (4b) M-CTX | 52.7* | 16 ± 4† | 64.3* | 60 ± 8* | 177 ± 11 |
| (n =3) | |||||
| (5b) M-CTX + | 56.6* | 14 ± 3† | 78 ± 4* | 66 ± 6* | 154 ± 17 |
| Tha (n = 3) | |||||
M-CTX: metronomic cyclophosphamide (30 mg/kg per day, p.o.); M-CTX + Tha: cyclophosphamide (30 mg/kg per day, p.o.) + thalidomide (60 mg/kg, i.p. twice per week); MVD: microvascular density.
P < 0.01 from control.
P < 0.05 from control.
Figure 6.
H&E staining of whole mount sections of M-CTX- and M-CTX + Tha-treated tumors, compared with a size-matched control tumor (A). For the M-CTX-treated (B) and M-CTX + Tha-treated (C) tumors, a large central necrosis was obvious on day 7; only a very thin rim with viable tissue was seen on day 42 of the M-CTX + Tha tumor (D). Enlarged image (x10) for the area selected from (C) shows a border region between the necrotic and viable tissues (E). Significant increase in the size of nuclei and cells indicates an inhibition of tumor mitosis. An increased number of vascular thromboses was identified in the tumors treated with M-CTX + Tha (F). Bar: 100 µm.
Figure 8.
M-CTX + Tha-induced elevated VEGF and endothelial apoptosis. A region of VEGF staining enlarged from Figure 6A (A). The positive VEGF staining was detected in tumor cells (cytoplasm and nuclei), vascular endothelium (arrow), and infiltrated inflammatory cells (arrow head). Detached endothelial cells from basement membrane were positively stained for apoptosis using anti-active caspase-3 (arrow) (B). A typical perivascular cuff was seen in regions surrounding an embolized microvessel resulting in tumor necrosis outside the cuff (C) and apoptosis in the cuff (arrows) (D). Bar: 100 µm.
Figure 7.
After 7 days of treatment, immunohistology showed a significant increase in tumor hypoxia, VEGF expression, and apoptosis in both the M-CTX-treated (middle, E–G) and the M-CTX + Tha-treated (bottom, I–K) tumors, compared with untreated controls (top, A–C). There was no significant change in MVD (D versus H versus L). Colocalization of tumor hypoxia and VEGF expression in the M-CTX-treated (E and F) and M-CTX + Tha-treated (I and J) tumors was seen in the two adjacent tissue sections. Bar: 100 µm.
Discussion
The current study shows significant growth delay in anaplastic Dunning prostate R3327-AT1 tumors by administering CTX on a continuous low-dose (M-CTX) schedule, alone or in combination with Tha. Significantly, the data show physiological changes detectable noninvasively by MRI prior to changes in tumor volume. DCE MRI revealed a significant decrease in signal enhancement (AUC) starting on day 3 of treatment through day 7, and a good correlation between very low AUC (<0.1) on day 7 and tumor growth delay. In good agreement, histology confirmed that M-CTX alone or M-CTX + Tha treatment caused a huge central necrotic core, leaving just a thin peripheral region alive.
There are increasing applications of noninvasive imaging for in vivo tumor diagnosis and prognosis [18,25–27]. Given the noted tumor heterogeneity, and hence observed heterogeneous responses to treatment, it is vital to be able to assess early therapeutic response and in turn be able to individualize treatment regimens. Functional MRI permits noninvasive evaluation of tumor physiology; thus, MRI may be a useful tool to detect early treatment-induced changes prior to overt changes in tumor size. The detection of early changes following antiangiogenic or vascular targeting treatment may be particularly valuable.
There is increasing interest in using DCE MRI to assess tumor vascularization in both diagnostic and prognostic aspects. Strong signal enhancement on T1-weighted images is reported to correlate with well-vascularized and highly permeable vessels [16,17]. Indeed, some studies have indicated that DCE MRI is capable of detecting early changes in tumor vascular perfusion and permeability after treatment with antiangiogenic or vascular targeting agents [16,17]. In the present study, we demonstrate that DCE MRI provides early indication related to the efficacy of M-CTX therapy (Figure 5). Our results showed a significant decrease in AUC (tumor perfusion and permeability), especially in central regions, as early as 3 days after initiating combined M-CTX + Tha therapy. Furthermore, tumor size on day 18 is significantly associated with weakly enhancing fraction (AUC < 0.1) on day 7. This is in line with our histologic findings of increased avascular fractions due to central necrosis formation. These results also parallel a study by Klement et al. [2], who found that a combination of continuous low-dose vinblastine and DC101 caused a 65% decrease in tumor perfusion within 14 days as assessed by histologic analysis of fluorescent perfusion marker.
Qualitative analysis of DCE MRI provides estimates of tumor perfusion and permeability based on the initial slope of the time-signal intensity curve or time-concentration product curve (IAUC) [17,28,29]. In the present study, we applied a spin-echo multiple slice (SEMS) pulse sequence with 59 seconds acquisition time and integrated signal enhancement during the first 3 minutes for AUC analysis, which gave a lower temporal resolution than some published studies [17,29]. It is possible that the longer acquisition time and extended AUC missed information regarding the “first pass” of the bolus contrast. However, comparison of AUC estimated over the first 60, 120, or 180 seconds showed essentially equivalent results. We have previously studied DCE MRI in the AT1 tumors by using echo planar imaging with fast acquisition time (4 seconds), which showed similar heterogeneity between tumor center and periphery [30].
Diverse MRI techniques have previously been used to study early physiological changes after CTX administered at the higher conventional dose [28,31,32]. Zhao et al. [31] found significant changes in apparent diffusion coefficient (ADC) of water in RIF-1 tumors in mice 2 days after a single dose of 150 or 300 mg/kg CTX. Poptani et al. [28] reported an increase in perfusion of RIF-1 tumors in mice 24 hours after a single dose CTX (300 mg/kg). For the present group of AT1 tumors, we routinely found significantly decreased perfusion in central tumor regions within 3 days and in the periphery by day 7 (Figure 4; Table 2), whereas control tumors showed no changes in the periphery, but did show change in the tumor center over 7 days (Table 2). It is critical to note that the changes are much less apparent when central and peripheral regions were combined for analysis (Table 2).
BOLD MRI or susceptibility-weighted R2* measurement exploits the intrinsic paramagnetic properties of deoxy-hemoglobin. Recently, BOLD MRI has been used to assess tumor response to antiangiogenesis, vascular targeting, and photodynamic therapy agents [17,18,33]. An increase in R2* may relate to increased paramagnetic deoxyhemoglobin in tumor tissue, which could be caused by a reduction in tissue perfusion. Some of our treated tumors showed increased R2* on days 1 and 3, but with return to baseline or even lower levels in our final MRI measurements on day 7. The transient change in R2* may have resulted from decreased vasculature and increased thrombosis. However, tumor R2* is also related to several other factors (e.g., necrotic tissue development) [19]. Overall, R2* neither correlated with growth in the control group nor with M-CTX or M-CTX + Tha therapy.
Significant increase in tumor apoptosis and evidence of apoptotic vascular endothelia in this study (Figures 7 and 8; Table 3) indicated the antiangiogenic effect of M-CTX alone or M-CTX + Tha. These data coincide with other studies using antiangiogenic agents [34] or M-CTX [35,36]. There is increasing evidence that several conventional chemotherapeutic agents including CTX, doxorubicin, vinblastine, and paclitaxel have potential antiangiogenic activity against experimental and clinical cancers, especially administered at continuous low doses [5,37,38]. Furthermore, recent studies have shown that M-CTX induced thrombospondin 1 expression, which can further enhance antiproliferative and proapoptotic effects [35,36]. Tha has been recognized as an antiangiogenic agent, which inhibits neovascularization by suppressing TNF-α, bFGF, and VEGF production [9,11]. In addition, clinical studies have shown that Tha, alone or combined with chemotherapeutic agents, caused vascular thromboses [39]. In the current study, we found increased thromboses in microvessels of treated tumors, compared with control tumors.
We observed a significant increase in VEGF expression in the tumors treated with M-CTX or M-CTX + Tha, as also reported in studies of several other antiangiogenic agents (e.g., TNP-470 and SU6668) [16,34]. Colocalization of VEGF overexpression with hypoxia (pimonidazole staining; Figure 7) supports the hypothesis that tumor hypoxia may have mediated a feedback or compensatory increase of VEGF. Poptani et al. [28] recently reported that RIF-1 fibrosarcoma treated with a single dose of CTX, 300 mg/kg, i.p., showed a significant decrease in tissue pO2 24 hours after treatment. The decrease in glycolytic rates and increase in oxidative metabolism observed in their study suggest that hypoxia resulted from more oxygen consumption by surviving cells rather than shortage of oxygen supply [32]. In our current study, MVD evaluation by the “hot spot” technique revealed no significant change in vasculature of the tumor periphery between the treated and pretreated tumors or size-matched controls (Figure 7). However, the overall fraction of vasculature decreased significantly and resulted in a huge avascular central necrotic area, evidenced by both histology and MRI, as also reported for other antiangiogenic studies [16]. Important to this observation is the fact that AT1 tumors do not normally develop a central necrosis [21–23,40]. In terms of tumor growth delay, M-CTX, alone or combined with Tha, significantly increased tumor volume doubling time (Figure 1). Compared with the M-CTX alone, the combination with Tha in this study had an additional inhibitory effect on tumor growth, although the effect of Tha appears to be, at best, additional rather than synergistic. However, a recent phase II study conducted by NCI [41] concluded that adding Tha to docetaxel resulted in an encouraging PSA decline rate and overall median survival rate in patients with metastatic AIPC. Another phase II trial [42] also suggests that low-dose Tha (100 mg/kg, daily) may be an option for patients with AIPC. Others reported that this continuous low-dose regimen, if combined with other therapeutic approaches (e.g., antiangiogenesis or immunotherapy), could produce a synergistic effect in a variety of experimental tumors [3,4]. The mode of action of Tha is complicated and its antiangiogenic effect is believed to be at least partly independent of VEGF. This might explain that the level of VEGF overexpression, accompanied with M-CTX treatment-induced hypoxia, was not reduced in the M-CTX + Tha group. Metronomic therapy has also been shown to be effective at overcoming drug resistance [6]. In the future, it would be interesting to develop sublines of the Dunning prostate R3327 tumor resistant to traditional CTX doses and to investigate whether the metronomic approach would still be effective. Our higher dose CTX (150 mg/kg) schedule, which is equivalent to the clinical MTD dose, induced significant tumor growth delay during the first 12 days of treatment, but all six animals died after three doses. A similar observation has been reported by Man et al. [3] that mice with MDA-MB-231 breast tumor xenografts died after three doses of 150 mg/kg CTX. Reduced toxicity of continuous low-dose therapy could be an important advantage and, recently, the combination of metronomic CTX with methotrexate has been reported to have a significant response in patients with advanced or recurrent breast carcinoma [5].
In summary, continuous low-dose CTX, alone or combined with Tha, significantly inhibited tumor growth of the syngeneic rat prostate R3327-AT1 tumor with reduced toxicity compared with multiple conventional doses. Our results demonstrate that physiological changes in the early stage of this low-dose regimen can be detected by MRI. MRI revealed intratumoral heterogeneity in situ and in vivo, and changes in temporo-spatial dynamics, which may give an early indication of treatment response and ultimately allow scheduling, dosage, and drug combination to be optimized and individualized.
Acknowledgements
We are grateful to Anca Constantinescu, Sophia Ran, Philip Thorpe, and Matthew Merritt for collegial support.
Abbreviations
- MRI
magnetic resonance imaging
- DCE MRI
dynamic contrast-enhanced MRI
- BOLD MRI
blood oxygen level-dependent MRI
- R2*
transverse relaxation rate
- AUC
area under the signal intensity-time curve
- CTX
cyclophosphamide
- Tha
thalidomide
- M-CTX
metronomic cyclophosphamide
- MTD
maximum tolerated dose
- AIPC
androgen-independent prostate cancer
Footnotes
This work was supported by a DOD Prostate Cancer Postdoctoral Fellowship (DAMD 170110108 to D.Z.), in conjunction with National Cancer Institute (RO1 CA79515/EB002762) and the Cancer Imaging Program (P20 Pre-ICMIC CA86354). MRI experiments were performed at the Mary Nell and Ralph B. Rogers MR Center (NIH BTRP no. P41-RR02584).
References
- 1.Browder T, Butterfield CE, Kraling BM, Shi B, Marshall B, O'Reilly MS, Folkman J. Antiangiogenic scheduling of chemotherapy improves efficacy against experimental drug-resistant cancer. Cancer Res. 2000;60:1878–1886. [PubMed] [Google Scholar]
- 2.Klement G, Baruchel S, Rak J, Man S, Clark K, Hicklin DJ, Bohlen P, Kerbel RS. Continuous low-dose therapy with vinblastine and VEGF receptor-2 antibody induces sustained tumor regression without over toxicity. J Clin Invest. 2000;105:R15–R24. doi: 10.1172/JCI8829. [DOI] [PMC free article] [PubMed] [Google Scholar]
- 3.Man S, Bocci G, Francia G, Green SK, Jothy S, Hanahan D, Bohlen P, Hicklin DJ, Bergers G, Kerbel RS. Antitumor effects in mice of low-dose (metronomic) cyclophosphamide administered continuously through drinking water. Cancer Res. 2002;62:2731–2735. [PubMed] [Google Scholar]
- 4.Hermans IF, Chong TW, Palmowski MJ, Harris AL, Cerundolo V. Synergistic effect of metronomic dosing of cyclophosphamide combined with specific antitumor immunotherapy in a murine melanoma model. Cancer Res. 2003;63:8408–8413. [PubMed] [Google Scholar]
- 5.Colleoni M, Rocca A, Sandri MT, Zorzino L, Masci G, Nole F, Peruzzotti G, Robertson C, Orlando L, Cinieri S, et al. Low-dose oral methotrexate and cyclophosphamide in metastatic breast cancer: antitumor activity and correlation with vascular endothelial growth factor levels. Ann Oncol. 2002;13:73–80. doi: 10.1093/annonc/mdf013. [DOI] [PubMed] [Google Scholar]
- 6.Kerbel RS, Kamen BA. The anti-angiogenic basis of metronomic chemotherapy. Nat Rev Cancer. 2004;4:423–436. doi: 10.1038/nrc1369. [DOI] [PubMed] [Google Scholar]
- 7.Small EJ, Srinivas S, Egan B, McMillan A, Rearden TP. Doxorubicin and dose-escalated cyclophosphamide with granulocyte colony-stimulating factor for the treatment of hormone-resistant prostate cancer. J Clin Oncol. 1996;14:1617–1625. doi: 10.1200/JCO.1996.14.5.1617. [DOI] [PubMed] [Google Scholar]
- 8.Hellerstedt B, Pienta KJ, Redman BG, Esper P, Dunn R, Fardig J, Olson K, Smith DC. Phase II trial of oral cyclophosphamide, prednisone, and diethylstilbestrol for androgen-independent prostate carcinoma. Cancer. 2003;98:1603–1610. doi: 10.1002/cncr.11686. [DOI] [PubMed] [Google Scholar]
- 9.D'Amato RJ, Loughnan MS, Flynn E, Folkman J. Thalidomide is an inhibitor of angiogenesis. Proc Natl Acad Sci USA. 1994;91:4082–4085. doi: 10.1073/pnas.91.9.4082. [DOI] [PMC free article] [PubMed] [Google Scholar]
- 10.Figg WD, Dahut W, Duray P, Hamilton M, Tompkins A, Steinberg SM, Jones E, Premkumar A, Linehan WM, Floeter MK, et al. A randomized phase II trial of thalidomide, an angiogenesis inhibitor, in patients with androgen-independent prostate cancer. Clin Cancer Res. 2001;7:1888–1893. [PubMed] [Google Scholar]
- 11.Ng SS, Gutschow M, Weiss M, Hauschildt S, Teubert U, Hecker TK, Luzzio FA, Kruger EA, Eger K, Figg WD. Antiangiogenic activity of N-substituted and tetrafluorinated thalidomide analogues. Cancer Res. 2003;63:3189–3194. [PubMed] [Google Scholar]
- 12.Evelhoch JL, Gillies RJ, Karczmar GS, Koutcher JA, Maxwell RJ, Nalcioglu O, Raghunand N, Ronen SM, Ross BD, Swartz HM. Applications of magnetic resonance in model systems: cancer therapeutics. Neoplasia. 2000;2:152–165. doi: 10.1038/sj.neo.7900078. [DOI] [PMC free article] [PubMed] [Google Scholar]
- 13.Gillies RJ, Bhujwalla ZM, Evelhoch J, Garwood M, Neeman M, Robinson SP, Sotak CH, Van Der Sanden B. Applications of magnetic resonance in model systems: tumor biology and physiology. Neoplasia. 2000;2:139–151. doi: 10.1038/sj.neo.7900076. [DOI] [PMC free article] [PubMed] [Google Scholar]
- 14.Tofts PS. Modeling tracer kinetics in dynamic Gd-DTPA MR imaging. J Magn Reson Imaging. 1997;7:91–101. doi: 10.1002/jmri.1880070113. [DOI] [PubMed] [Google Scholar]
- 15.Port RE, Knopp MV, Hoffmann U, Milker-Zabel S, Brix G. Multicompartment analysis of gadolinium chelate kinetics: blood-tissue exchange in mammary tumors as monitored by dynamic MR imaging. J Magn Reson Imaging. 1999;10:233–241. doi: 10.1002/(sici)1522-2586(199909)10:3<233::aid-jmri3>3.0.co;2-m. [DOI] [PubMed] [Google Scholar]
- 16.Bhujwalla ZM, Artemov D, Natarajan K, Solaiyappan M, Kollars P, Kristjansen PE. Reduction of vascular and permeable regions in solid tumors detected by macromolecular contrast magnetic resonance imaging after treatment with antiangiogenic agent TNP-470. Clin Cancer Res. 2003;9:355–362. [PubMed] [Google Scholar]
- 17.Robinson SP, McIntyre DJ, Checkley D, Tessier JJ, Howe FA, Griffiths JR, Ashton SE, Ryan AJ, Blakey DC, Waterton JC. Tumour dose response to the antivascular agent ZD6126 assessed by magnetic resonance imaging. Br J Cancer. 2003;88:1592–1597. doi: 10.1038/sj.bjc.6600926. [DOI] [PMC free article] [PubMed] [Google Scholar]
- 18.Gross S, Gilead A, Scherz A, Neeman M, Salomon Y. Monitoring photodynamic therapy of solid tumors online by BOLD-contrast MRI. Nat Med. 2003;9:1327–1331. doi: 10.1038/nm940. [DOI] [PubMed] [Google Scholar]
- 19.Howe FA, Robinson SP, McIntyre DJ, Stubbs M, Griffiths JR. Issues in flow and oxygenation dependent contrast (FLOOD) imaging of tumours. NMR Biomed. 2001;14:497–506. doi: 10.1002/nbm.716. [DOI] [PubMed] [Google Scholar]
- 20.Hahn EW, Peschke P, Mason RP, Babcock EE, Antich PP. Isolated tumor growth in a surgically formed skin pedicle in the rat: a new tumor model for NMR studies. Magn Reson Imaging. 1993;11:1007–1017. doi: 10.1016/0730-725x(93)90219-4. [DOI] [PubMed] [Google Scholar]
- 21.Peschke P, Hahn EW, Wenz F, Lohr F, Braunschweig F, Wolber G, Zuna I, Wannenmacher M. Differential sensitivity of three sublines of the rat Dunning prostate tumor system R3327 to radiation and/or local tumor hyperthermia. Radiat Res. 1998;150:423–430. [PubMed] [Google Scholar]
- 22.Heckl S, Pipkorn R, Waldeck W, Spring H, Jenne J, von der Lieth CW, Corban-Wilhelm H, Debus J, Braun K. Intracellular visualization of prostate cancer using magnetic resonance imaging. Cancer Res. 2003;63:4766–4772. [PubMed] [Google Scholar]
- 23.Zhao D, Ran S, Constantinescu A, Hahn EW, Mason RP. Tumor oxygen dynamics: correlation of in vivo MRI with histological findings. Neoplasia. 2003;5:308–318. doi: 10.1016/S1476-5586(03)80024-6. [DOI] [PMC free article] [PubMed] [Google Scholar]
- 24.Weidner N. Intratumor microvessel density as a prognostic factor in cancer. Am J Pathol. 1995;147:9–19. [PMC free article] [PubMed] [Google Scholar]
- 25.Taylor JS, Reddick WE. Evolution from empirical dynamic contrast-enhanced magnetic resonance imaging to pharmacokinetic MRI. Adv Drug Deliv Rev. 2000;41:91–110. doi: 10.1016/s0169-409x(99)00058-7. [DOI] [PubMed] [Google Scholar]
- 26.Galbraith SM, Maxwell RJ, Lodge MA, Tozer GM, Wilson J, Taylor NJ, Stirling JJ, Sena L, Padhani AR, Rustin GJ. Combretastatin A4 phosphate has tumor antivascular activity in rat and man as demonstrated by dynamic magnetic resonance imaging. J Clin Oncol. 2003;21:2831–2842. doi: 10.1200/JCO.2003.05.187. [DOI] [PubMed] [Google Scholar]
- 27.Zhao D, Jiang L, Hahn EW, Mason RP. Tumor physiological response to combretastatin A4 phosphate assessed by MRI. Int J Radiat Oncol Biol Phys. 2005 doi: 10.1016/j.ijrobp.2005.03.009. (in press) [DOI] [PubMed] [Google Scholar]
- 28.Poptani H, Bansal N, Graham RA, Mancuso A, Nelson DS, Glickson JD. Detecting early response to cyclophosphamide treatment of RIF-1 tumors using selective multiple quantum spectroscopy (SelMQC) and dynamic contrast enhanced imaging. NMR Biomed. 2003;16:102–111. doi: 10.1002/nbm.816. [DOI] [PubMed] [Google Scholar]
- 29.Evelhoch JL. Key factors in the acquisition of contrast kinetic data for oncology. J Magn Reson Imaging. 1999;10:254–259. doi: 10.1002/(sici)1522-2586(199909)10:3<254::aid-jmri5>3.0.co;2-9. [DOI] [PubMed] [Google Scholar]
- 30.Jiang L, Zhao D, Constantinescu A, Mason RP. Comparison of BOLD contrast and Gd-DTPA dynamic contrast-enhanced imaging in rat prostate tumor. Magn Reson Med. 2004;51:953–960. doi: 10.1002/mrm.20069. [DOI] [PubMed] [Google Scholar]
- 31.Zhao M, Pipe JG, Bonnett J, Evelhoch JL. Early detection of treatment response by diffusion-weighted 1H-NMR spectroscopy in a murine tumour in vivo. Br J Cancer. 1996;73:61–64. doi: 10.1038/bjc.1996.11. [DOI] [PMC free article] [PubMed] [Google Scholar]
- 32.Poptani H, Bansal N, Jenkins WT, Blessington D, Mancuso A, Nelson DS, Feldman M, Delikatny EJ, Chance B, Glickson JD. Cyclophosphamide treatment modifies tumor oxygenation and glycolytic rates of RIF-1 tumors: 13C magnetic resonance spectroscopy, Eppendorf electrode, and redox scanning. Cancer Res. 2003;63:8813–8820. [PubMed] [Google Scholar]
- 33.Abramovitch R, Dafni H, Smouha E, Benjamin LE, Neeman M. In vivo prediction of vascular susceptibility to vascular susceptibility endothelial growth factor withdrawal: magnetic resonance imaging of C6 rat glioma in nude mice. Cancer Res. 1999;59:5012–5016. [PubMed] [Google Scholar]
- 34.Laird AD, Christensen JG, Li G, Carver J, Smith K, Xin X, Moss KG, Louie SG, Mendel DB, Cherrington JM. SU6668 inhibits Flk-1/KDR and PDGFRbeta in vivo, resulting in rapid apoptosis of tumor vasculature and tumor regression in mice. FASEB J. 2002;16:681–690. doi: 10.1096/fj.01-0700com. [DOI] [PubMed] [Google Scholar]
- 35.Bocci G, Francia G, Man S, Lawler J, Kerbel RS. Thrombospondin 1, a mediator of the antiangiogenic effects of low-dose metronomic chemotherapy. Proc Natl Acad Sci USA. 2003;100:12917–12922. doi: 10.1073/pnas.2135406100. [DOI] [PMC free article] [PubMed] [Google Scholar]
- 36.Hamano Y, Sugimoto H, Soubasakos MA, Kieran M, Olsen BR, Lawler J, Sudhakar A, Kalluri R. Thrombospondin-1 associated with tumor microenvironment contributes to low-dose cyclophosphamide-mediated endothelial cell apoptosis and tumor growth suppression. Cancer Res. 2004;64:1570–1574. doi: 10.1158/0008-5472.can-03-3126. [DOI] [PubMed] [Google Scholar]
- 37.Bocci G, Nicolaou KC, Kerbel RS. Protracted low-dose effects on human endothelial cell proliferation and survival in vitro reveal a selective antiangiogenic window for various chemotherapeutic drugs. Cancer Res. 2002;62:6938–6943. [PubMed] [Google Scholar]
- 38.Wang J, Lou P, Lesniewski R, Henkin J. Paclitaxel at ultra low concentrations inhibits angiogenesis without affecting cellular microtubule assembly. Anticancer Drugs. 2003;14:13–19. doi: 10.1097/00001813-200301000-00003. [DOI] [PubMed] [Google Scholar]
- 39.Desai AA, Vogelzang NJ, Rini BI, Ansari R, Krauss S, Stadler WM. A high rate of venous thromboembolism in a multi-institutional phase II trial of weekly intravenous gemcitabine with continuous infusion fluorouracil and daily thalidomide in patients with metastatic renal cell carcinoma. Cancer. 2002;95:1629–1636. doi: 10.1002/cncr.10847. [DOI] [PubMed] [Google Scholar]
- 40.Mason RP, Constantinescu A, Hunjan S, Le D, Hahn EW, Antich PP, Blum C, Peschke P. Regional tumor oxygenation and measurement of dynamic changes. Radiat Res. 1999;152:239–249. [PubMed] [Google Scholar]
- 41.Dahut WL, Gulley JL, Arlen PM, Liu Y, Fedenko KM, Steinberg SM, Wright JJ, Parnes H, Chen CC, Jones E, et al. Randomized phase II trial of docetaxel plus thalidomide in androgen-independent prostate cancer. J Clin Oncol. 2004;22:2532–2539. doi: 10.1200/JCO.2004.05.074. [DOI] [PubMed] [Google Scholar]
- 42.Drake MJ, Robson W, Mehta P, Schofield I, Neal DE, Leung HY. An open-label phase II study of low-dose thalidomide in androgen-independent prostate cancer. Br J Cancer. 2003;88:822–827. doi: 10.1038/sj.bjc.6600817. [DOI] [PMC free article] [PubMed] [Google Scholar]


