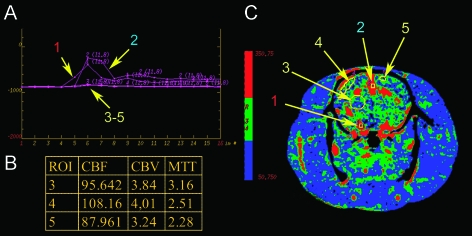
Figure 7.
Perfusion images of the rat brain were obtained after intravenous application of 1 ml of Iomeprol and scanning performed in cine mode with 2 seconds of rotation time over 32 seconds. Panel A shows the attenuation curves of the artery (1), vein (2), and three regions of interest. Region (3) covers parts of the basal ganglia; region (4) is located in the right parietal cortex; and region (5) is located in the left frontal cortex. The corresponding perfusion map for the cerebral blood flow is given in panel C and measured values for CBF (ml/100 g per minute), CBV (ml/100 g), and MTT (seconds) are given in the table (B).

